(meta-)genomic data from host-associated microorganisms
Analyse und Interpretation von (meta-)genomischen Daten aus Wirt-assoziierten Mikroorganismen
Dissertation zur Erlangung des naturwissenschaftlichen Doktorgrades der Graduate School of Life Sciences, Julius–Maximilians–Universität Würzburg
Klasse: Integrative Biology
vorgelegt von Hannes Horn, M. Sc.
aus
Schwäbisch Gmünd
Würzburg, 2017
Mitglieder des Promotionskomitees:
Vorsitzender: Prof. Dr. Thomas Müller
1. Betreuer: Prof. Dr. Ute Hentschel Humeida
2. Betreuer: Prof. Dr. Markus Riederer
3. Betreuer: Dr. Alexander Keller
4. Betreuer: Dr. Mitja N. P. Remus–Emsermann
Tag des Promotionskolloquiums:
Promotionsurkunde ausgehändigt am:
that makes your rose so important.”
Antoine de Saint–Exupéry
Acknowledgements
Completing this work would have been impossible without the support of many people. I would like to express my gratitude to all of you.
First of all I wish to thank Prof. Dr. Ute Hentschel Humeida and Prof. Dr. Markus Riederer for the opportunity to work on this project and to open the door to many different and exciting topics.
I am very thankful to my thesis committee, consisting of Prof. Dr. Ute Hentschel Humeida, Prof. Dr. Markus Riederer, Dr. Alexander Keller and Dr. Mitja–Remus Emsermann. I appre- ciate their mentoring and they provided me advice, support, guidance, patience, ethusiasm, and constructive criticism.
Sincere thanks to my peers from the Department of Botany II, in particular Kristina, Usama, Beate, Martin, Lucas, Cheng, Lucia and Tine, Anni, Eli, Anton, Katja, Jana, Moni, Wilma, Andrea, Jutta, Ulrich, Markus and Michael. Thanks for helpful discussions, support in the lab, manuscript writing, administrative purposes, and amicable atmosphere! Special thanks to Usama who introduced me to many projects and guided me through the writing process of my PhD thesis.
Many thanks to my new colleages at the GEOMAR, Jutta, Tanja, Bettina, Alvaro, Ignacio and Prof. Dr. J. Imhoff, who gave us a warm welcome to Kiel and helped us to arrive in good spirits in our new environment.
I appreciate the help of all my collaboration partners, notably the people from Alexander Keller’s Group, Wiebke Sickel and Markus Ankenbrand (and Alexander himself, of course!).
Thanks to Dr. Stefanie Gläser and Prof. Dr. P. Kämpfer from the University of Gießen, Dr. Michael Richter from the MPI Bremen as well as Dr. Rodrigo Costa and Elham Karimi from the University of Algarve, and to the people of the Department of Electron Microscopy, Daniela Bunsen and Prof. Dr. G. Krohne. Special thanks to Frank Förster for his all–time support and organizing funny Kässpätzles–Events.
Coming to an end, I am being grateful to my friends for all your support and distractions, but also your understanding when there was limited time from my side.
Lastly, I want to express my gratitude to my family for your encouragement, your belief in me, never–ending support, and love.
Contents
Summary vii
Zusammenfassung ix
I General introduction 1
The road to –omics 3
Historical background . . . 3
Development and impact of sequencing technologies . . . 4
Omics . . . 6
A (meta–)genomic workflow . . . 10
A microbial world 13 Microbial life in the phyllosphere . . . 14
Microbial life within sponges . . . 16
Scope and structure 20 II Material and methods 21 Material 23 Samples and sequencing data . . . 23
Samples for genomic sequencing . . . 23
Samples and sequencing for metagneomic sequencing . . . 23
Hardware ressources . . . 24
Databases . . . 25
Methods 26 General data processing . . . 26
Bioinformatics . . . 26
Processing of Sanger–sequenced data . . . 26
Processing of Illumina–sequenced data . . . 28
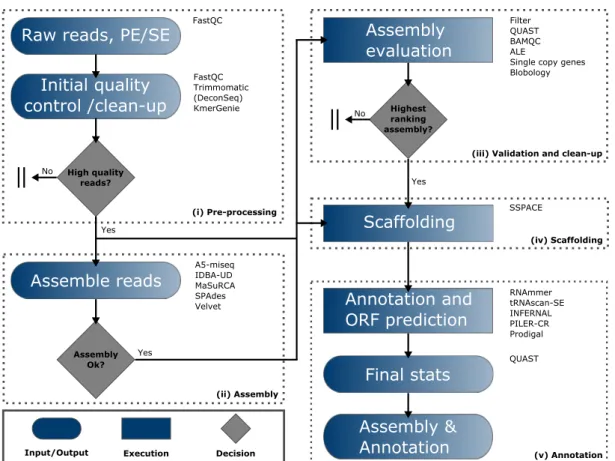
III Results 33 1 De novo assembly protocol for Illumina–sequenced bacterial genomes 35 2 Draft genome sequence of Williamsia sp. ARP1, a phyllosphere bacterium 47 3 Mining Genomes of Three Marine Sponge-Associated Actinobacterial Isolates
for Secondary metabolism 59
4 Draft genome sequences of three chemically rich actinomycetes isolated from
Mediterranean sponges 63
5 An enrichment of CRISPR and other defense–related features in marine
sponge–associated microbial metagenomes 67
IV General discussion 83
Bioinformatic considerations 85
Construction of a draft genome for the phyllosphere bacteriumWilliamsiasp. ARP1 88
Abundance, diversity and sources . . . 88
Phylogeny and assignment . . . 89
Genomic functions and adaptations to the phyllosphere . . . 90
Genomic mining of sponge-associated bacterial isolates 92 Metagenomic mining of sponge-associated bacterial consortia 94 Screening for secondary metabolites . . . 95
Secondary metabolite genes . . . 96
Type I PKS phylogenetic tree . . . 97
Defense systems . . . 97
V Conclusion and perspectives 101
VI Bibliography 105
VII Appendix 127
Abbreviations 129
List of figures 131
List of tables 132
Statement of author contributions 133
Publications and presentations 137
Curriculum vitae 139
Affidavit/Eidesstattliche Erklärung 140
Summary
Host–microbe interactions are the key to understand why and how microbes inhabit specific environments. With the scientific fields of microbial genomics and metagenomics, evolving on an unprecedented scale, one is able to gain insights in these interactions on a molecular and ecological level. The goal of this PhD thesis was to make (meta–)genomic data accessible, integrate it in a comparative manner and to gain comprehensive taxonomic and functional insights into bacterial strains and communities derived from two different environments: the phyllosphere of Arabidopsis thaliana and the mesohyl interior of marine sponges.
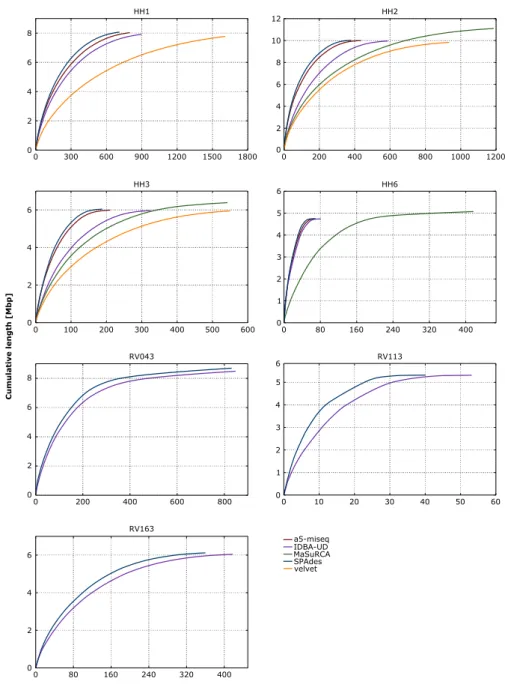
This thesis focused first on thede novo assembly of bacterial genomes. A 5–step protocol was developed, each step including a quality control. The examination of different assembly software in a comparative way identified SPAdes as most suitable. The protocol enables the user to chose the best tailored assembly. Contamination issues were solved by an initial filtering of the data and methods normally used for the binning of metagenomic datasets.
This step is missed in many published assembly pipelines. The described protocol offers assemblies of high quality ready for downstream analysis.
Subsequently, assemblies generated with the developed protocol were annotated and explored in terms of their function. In a first study, the genome of a phyllosphere bacterium, Williamsiasp. ARP1, was analyzed, offering many adaptions to the leaf habitat: it can deal with temperature shifts, react to oxygen species, produces mycosporins as protection against UV–light, and is able to uptake photosynthates. Further, its taxonomic position within theActinomycetales was infered from 16S rRNA and comparative genomics showing the close relation between the generaWilliamsia and Gordonia.
In a second study, six sponge–derived actinomycete genomes were investigated for secondary metabolism. By use of state–of–the–art software, these strains exhibited numerous gene clusters, mostly linked to polykethide synthases, non–ribosomal peptide synthesis, terpenes, fatty acids and saccharides. Subsequent predictions on these clusters offered a great variety of possible produced compounds with antibiotic, antifungal or anti–cancer activity. These analysis highlight the potential for the synthesis of natural products and the use of genomic data as screening toolkit.
In a last study, three sponge–derived and one seawater metagenomes were functionally compared. Different signatures regarding the microbial composition and GC–distribution were observed between the two environments. With a focus on bacerial defense systems,
the data indicates a pronounced repertoire of sponge associated bacteria for bacterial defense systems, in particular, Clustered Regularly Interspaced Short Palindromic Repeats, restriction modification system, DNA phosphorothioation and phage growth limitation. In addition, characterizing genes for secondary metabolite cluster differed between sponge and seawater microbiomes. Moreover, a variety of Type I polyketide synthases were only found within the sponge microbiomes. With that, metagenomics are shown to be a useful tool for the screening of secondary metabolite genes. Furthermore, enriched defense systems are highlighted as feature of sponge-associated microbes and marks them as a selective trait.
Zusammenfassung
Mikroben–Wirt Interaktionen sind der Schlüssel, um zu verstehen “Wie?” und “Warum?”
Mikroben in bestimmten Umgebungen vorkommen. Mithilfe von Genomik und Metagenomik lassen sich Einblicke auf dem molekularen sowie ökolgischen Level gewinnen. Ziel dieser Arbeit war es, diese Daten zugänglich zu machen und zu vergleichen, um Erkenntnisse auf taxonomischer und funktionaler Ebene in bakterielle Isolate und bakterielle Konsortien zu erhalten. Dabei wurden Daten aus zwei verschiedenen Umgebungen erhoben: der Phyllosphäre von Arabidopsis thaliana und aus der Mesohyl–Matrix mariner Schwämme.
Das Ziel war zunächst, bakterieller Genome de novo zu assemblieren. Dazu wurde ein Protokoll, bestehend aus 5 Schritten, entwickelt. Durch Verwendung verschiedener Soft- ware zum Assemblieren konnte SPAdes als am besten geeignet für die gegebenen Daten herausgearbeitet werden. Durch anfängliches Filtern der Daten konnte erste Kontamina- tion entfernt werden. Durch das Anwenden weiterer Methoden, welche ursprünglich für metagenomische Datensätze entwickelt wurden, konnten weitere Kontaminationen erkannt und von den “echten” Daten getrennt werden. Ein Schritt, welcher in den meisten pub- lizierten Assembly–Pipelines fehlt. Das Protokoll ermöglicht das Erstellen hochqualitativer Assemblies, welche zur weiteren Analyse nicht weiter aufbereitet werden müssen.
Nachfolgend wurden die generierten Assemblies annotiert. Das Genom von William- siasp. ARP1 wurde untersucht und durch dessen Interpretation konnten viele Anpassungen an die Existenz in der Phyllosphäre gezeigt werden: Anpassung an Termperaturveränderun- gen, Produktion von Mycosporinen als Schutz vor UV–Strahlung und die Möglichkeit, von der Pflanze durch Photosynthese hergestellte Substanzen aufzunehmen. Seine taxonomische Position wurde aufgrund von 16S rRNA sowie vergleichende Genomik bestimmt. Dadurch konnte eine nahe Verwandtschaft zwischen den GattungenWilliamsia undGordonia gezeigt werden.
In einer weiteren Studie wurden sechs Actinomyceten–Genome, isoliert aus Schwämmen, hinsichtlich ihres Sekundärmetabolismus untersucht. Mihilfe moderner Software konnten in zahlreiche Gen–Cluster identifiziert werden. Zumeist zeigten diese eine Zugehörigkeit zu Polyketidsynthasen, Nichtribosomalen Peptidsynthasen, Terpenen, Fettsäuren oder Sac- chariden. Durch eine tiefere Analyse konnten die Cluster mit chemischen Verbindungen assoziiert werden, welche antibakterielle oder fungizide Eigenschaften besitzen.
In der letzten Untersuchung wurden Metagenome von drei Schwämmen sowie Meerwasser auf funktioneller Ebene verglichen. Beobachtet wurden Unterschiede in deren mikrobiellen
Konsortien und GC–Gehalt. Schwamm–assoziierte Bakterien zeigten ein ausgeprägtes Inventar an Verteidigungsmechanismen gegenüber deren Vertretern aus dem Meerwasser.
Dies beinhaltete vor allem: Clustered Regularly Interspaced Short Palindromic Repeats, das Restriktions-Modifikationssystem, DNA Phosphorothioation, oder Gene, welche das Wachstum von Phagen hemmen können. Gene für Sekundärmetabolite waren zwischen Schwamm– und Meerwasser–Metagenomen unterschiedlich stark ausgeprägt. So konnten Typ I Polyketidsynthasen ausschließlich in den Schwamm–Metagenomen gefunden werden.
Dies zeigt, dass metagenomische Daten ebenso wie genomische Daten zur Untersuchung des Sekundärmetabolismus genutzt werden können. Des Weiteren zeigt die Anhäufung an Verteidigungsmechanismen eine Anpassung von Schwamm–assoziierten Mikroben an ihre Umgebung und ist ein Hinweis auf deren mögliche selektive Eigenschaft.
General introduction
The road to –omics
Historical background
“The order of nucleic acids in polynucleotide chains ultimately contains the information for the hereditary and biochemical properties of terrestrial life. Therefore the ability to measure or infer such sequences is imperative to biological research.” (Heather and Chain 2016)
One could consider the year 1869 as the birth of sequencing, when Friedrich Miescher discovered and isolated “nuclein”, a phosphate–rich substance residing within the cell nuclei, better known today as desoxyribonucleic acid (DNA). For many years, proteins were believed to be the inheritable genetic molecules, as they varied more in a physical and chemical way compared to DNA. Surprisingly, in 1944, Oswald T. Avery, Colin MacLeod and Maclyn McCarty demonstrated, that DNA, serves as genetic carrier:
“If the results of the present study of the transforming principle are confirmed, then nucleic acids must be regarded as possessing biological specificity ...” (Avery et al.
1944)
Based on the results obtained by Avery and his colleagues, Alfred Hershey and Martha Chase conducted experiments on bacteriophages infecting bacterial cells in 1952. Upon this process, they recognized only DNA entering the cell, whereas proteins did not, confirming DNA to carry genetic information and thus as responsible for inheratibility:
“This protein probably has no function in the growth of intracellular phage. The DNA has some function ...” (Hershey and Chase1952)
Only one year later, James Watson and Francis Crick were able to solve the three- dimensional structure of DNA supported through the crystallographic data of Rosalind Franklin and Maurice Wilkins (Watson and Crick 1953; Zallen 2003). They proposed a double–helical structure consisting of two chains running in opposite directions (i.e.
complementary) with the sugar–phosphate backbones on the outside and the four (nucleo–
) bases — adenine (A), cytosine (C), guanine (G) and thymine (T) — on the inside. Pairwise bonds between the nucleotides (i.e. nucleobase + sugar + phosphate) are formed to stabilize the helical structure: A with T, C with G (Watson and Crick1953). Within the next decade, reading or even sequencing DNA was impossible, due to its length and double-stranded appearance (Heather and Chain 2016). However, sequencing of the first transfer RNA
(tRNA) fromSaccharomyces cerevisiae in 1965 (Holley et al.1965), the coat protein of the ribonucleic acid (RNA) bacteriophage MS2 and subsequent its complete RNA sequence (Fiers et al. 1976; Jou et al. 1972) were published. Even the measurement of nucleotide composition became possible in 1961 (Holley et al.1961) — but not the order of nucleotides.
Development and impact of sequencing technologies
Only in 1968, Ray Wu and colleagues employed DNA polymerase to sequence the “sticky ends” of phage (Wu and Kaiser1968). With this, they were the first to publish a nucleotide sequence, consisting of 12 basepairs (Wu and Taylor1971).
First–generation sequencing commenced in 1975, with the chemical cleavage technique of Allan Maxam and Walter Gilbert (Heather and Chain2016). Independently, Frederick Sanger and Alan Coulson invented theirplus and minus system and revolutionized the way of DNA sequencing presenting the famousdideoxy orchain–termination method (Sanger and Coulson1975; Sanger et al.1977a). Soon after, the 5.3 kbp genome of the bacteriophage X174 was released (Sanger et al. 1977b). Technical improvements towards automation, capillary systems and fluorometric based detection of nucleotides (Heather and Chain2016), the use of shotgun sequencing — i.e. DNA is randomly fragmented, cloned and these fragments/reads are sequenced — andsuitable computer programs (Staden 1979) to stitch obtained reads together (= assembly) led to the first fully sequenced bacterial genome in 1995,Haemophils influenza, with a size of 1.8 Mbp (Fleischmann et al.1995) and changed the science of bacteria dramatically (Land et al.2015). A milestone in sequencing was set in 2001, when the sequence of the human genome with a length of 3 Gbp was presented (Lander et al.2001; Venter et al.2001) a few years ahead of schedule.
2001 2002 2003 2004 2005 2006 2007 2008 2009 2010 2011 2012 2013 2014 2015 0.1
1 10 100 1000 10,000
1 10 100 100 1,000 10,000 100,000 1,000,000
Cost per raw Mb of sequenced DNA [$] Deposited data in Genbank [Mb]
Cost per raw Mb of sequenced DNA [$] Deposited data in GenBank [Mb]
Figure 1. – Development of DNA sequencing costs according to the National Human Genome Research Institute (NHGRI) (Wetterstrand 2016) for one megabase- pair and the amount of deposited sequencing data in GenBank (GenBank 2016)
Concurrent with further advances in large–scaledideoxy sequencing methods, a wave of next–generation sequencing (NGS) platforms were released (Heather and Chain 2016). In 2005, the first commercially sequencer, the GS20 by 454 Life Sciences became available.
It heralded the era of NGS (Shendure and Ji 2008) as the mass of sequences produced in parallel within one run was considered a paradigm shift (Margulies et al. 2005). Since its release, a massive drop in sequencing costs concurrent with increasing throughput took place (Figure 1). In particular, Illumina has lowered sequencing costs drastically, allowing the human genome to be sequenced with 1 000 $ (Illumina 2016), which had costs of 1 000 000 $ back in 2001 and have brought the company to near monopoly (Greenleaf and Sidow 2014). Among the two described NGS technologies, others appeared (and disappeared) with variable impact, namely Sequencing by Oligonucleotide Ligation and Detection (SOLiD) (Applied Biosystems) and Ion Torrent (Life Technologies) in 2006 and 2010, respectively. More recently, the third generation of sequencing technologies emerged.
That is, single molecule sequencing (SMS) in real–time without the need for amplification (Heather and Chain 2016; Liu et al. 2012a). Considered to be the most wideley used third–generation sequencing platform to date is PacBio (Pacific Biosciences) (Dijk et al.
2014) over nanopore sequencing (Oxford Nanopore Technologies).
Sequencing technologies have changed massively within the last three decades. The overall throughput has increased from 0.1 Mbp using Sanger–seqencing to over 1 000 Gbp with Illumina platforms. Further, there were trends towards smaller read–lenghts using NGS platforms compared to Sanger–sequencing, but this has changed again to lengths exceeding 1 000 bp using the Third–Generation sequencing technologies (Figure 2).
0.001
0.0001 0.01 0.1 1 10
log Throughput per run [Gbp]
100 1,000
log read length [bp]
10 100 1,000 10,000
PacBio RS
GS Junior GS FLX MiSeq HiSeq2500 HiSeq X/4000 HiSeq 2000
'Sanger' GAIIxNextSeq 500
SOLiD
Proton
PGM MinION/
GridION/
PromethION
1st generation sequencing next-generation sequencing
3rd generation sequencing
'Sanger' Solexa /Illumina Inc.
Applied Biosystems / Life Technologies Life Technologies
Oxford Nanopore Technologies Pacific Biosciences
454 Life Sciences / Roche
Figure 2. – Development in NGS with regards to throughput and read length. Adapted from Nederbragt (2015)
As a result of the technological improvements, it was possible to reduce the price for sequencing projects dramatically. Especially Illumina led to a massive drop to 0.1 $ per megabase (Glenn2011) (Sanger 400 $ per megabase (Thomas et al. 2012)), and the availability of benchtop sequencers (e.g. Illumina MiSeq, Roche 454 Junior, Ion Torrent PGM), has made the sequencing of bacterial genomes (and others) affordable to many laboratories, but also dropped the impact of a bacterial genome projects from Journals asScience (Impact factor: 31.477) in 1995 to journals as Standards in Genomic Sciences (Impact factor: 3.167) nowadays. Whatsoever, the era of NGS and the vast data produced allows new questions to be asked. It is now possible to sequence multiple species at a time or even the complete DNA inventory of microbial communities. These endeavours and developments paved the way for a new scientific field: –omics.
Omics
In molecular biology, the term –omics refers to the suffix –ome to form nouns, which adresses to the objects of study (e.g. genome — genomics). According to the Oxford English Dictionary, –omics describing “[a]ll constituents considered collectively” (Oxford English Dictionary2016), meaning in science the use of “[l]arge-scale data/information to understand life summed up in omes” (Yadav2007) .
Different –omics data types help to understand the inherent relationship between biological regimes, which can be described by the central dogma of molecular biology (Buescher and Driggers2016; Crick1970; Crick1958): From DNA, i.e. the blueprint of an organism which is carried by RNA, describing what actually happens within an organism, to proteins, the functional products (Buescher and Driggers 2016) (Figure 3).
DNA RNA Protein
T C G C T A T A G C G A
A U G U C T V L Y I
(Meta-)
Genomics (Meta-)
Transcriptomics (Meta-) Proteomics
Transcription Translation
Figure 3. – The central dogma of molecular biology according to F. Crick (Crick1970;
Crick 1958) and the connection to –omics
Below, a brief overview of microbial genomics and metagenomics is given, as these are the main research fields used within this thesis. Further, approaches and challenges using that kind of data are described.
Genomics – the word was proposed by the geneticist Thomas H. Roderick in early 1986 as the name of the yet–to–be-published journalGenomics (Kuska1998). Genomics refers to a field in genetics and concerns the analyis of an organisms genome within its cells (Lockhart
and Winzeler 2000). In particular, it describes the determination of DNA sequences, and subsequent functional analysis. Two decades earlier, this was an extensive process requiring a lot of time and money, but became — at least for bacterial genomes — a standard procedure (Land et al.2015) by use of NGS technologies. The ease of producing genomics data today is also reflected within the public databases such as The Genomes OnLine Database (GOLD) (Reddy et al. 2015) or GenBank. The number of registered genome projects increased dramatically since 2001, in particular for bacterial genomes, but also increased for eukaryotic ones within the last 5 years (Figure 4). Also GenBank has grown massively since its invention 1982 (Land et al. 2015) and now harbours amounts of 4 000 eukaryotic, 6 000 viral, and more than 80 000 available bacterial genomes comprising over 50 bacterial phyla (NCBI 2014). This is also due to the drop in sequencing costs (Figure 1) and initiatives like the 100K Pathogen Genome Project or the Genomic Encyclopedia of Bacteria and Archaea (GEBA) (Kyrpides et al. 2014) among others. However, the last decades have not only been about generating sequencing data, but also illuminated functionalities of genomic data and their coherence to the environment. Indeed, there have been many projects on eukaryotes like the human genome in 2001 (Lander et al. 2001; Venter et al.
2001), the nematode Caenorhabditis elegans 1998 (Sequencing Consortium1998) or the first flowering plant Arabidopsis thaliana in 2000 (Initiative2000). The next paragraph will focus on insights and knowledge gained through bacterial genome sequencing.
2001 2002 2003 2004 2005 2006 2007 2008 2009 2010 2011 2012 2013 2014 2015 10,000
20,000 30,000 40,000 50,000
Project totals in GOLD [#]
Bacteria Archaea Eukaroyte Virus Metagenome
Figure 4. – Development of registered DNA sequencing projects in the Genomes Online Database (GOLD) since 2001 (Genomes Online Database2016)
The sequencing of the first bacterial genomes in 1995 —H. influenza (Fleischmann et al.
1995) and Mycoplasma genitalium (Fraser et al. 1995) — were non–pathogenic strains. But, it started a race (Loman and Pallen 2015) to sequence genomes from pathogens as the white plague Mycobacterium tuberculosis (Cole et al. 1998), model organisms as Bacil-
lus subtilis andEscherichia coli K–12 (Blattner 1997; Kunst et al.1997) and extremophiles asDeinococcus radiodurans (White1999) or Tropheryma whipplei. Though many of these strains were hard to study in vitro, it allowed the design of a growth medium for e.g.
T. whipplei through metabolic reconstruction and its subsequent cultivation (Renesto et al.
2003). The availability of genomes from the same genus or species opened the door for new scientific fields: comparative and evolutionary genomics. It involves the comparison of genomic features — i.e. DNA sequences and, genes and their order, regulatory elements or even Single nucleotide polymorphisms (SNPs) — of different organisms (Xia2013). This information can be used to define genomic inventories identical/different across genomes, thus defining homologs/paralogs or origins of genes and species (Nature 2014). With that background, it was possible to define pan– (an entire gene set) and core–genomes (genes present in all strains of a taxononomic group) and classify strains using their whole genomic repertoire (Land et al.2015) or nucleotide composition infered through average nucleotide identity (ANI) (Richter and Rosselló-Móra 2009) instead of single marker genes (e.g. 16S rRNA for bacteria). Using these toolkits, high strain diversity and horizontal gene transfer (HGT) within E. coli was detected (Welch et al.2002). This knowledge of gene transfer and recombination changed the way of understanding genome evolution for microbes and tree–like structures were found to be inappropriate (Spratt and Maiden1999) to show their phylogeny as bacterial cells were designated as individuals. Focussing on human pathogens and symbionts, a process called genome reduction was observed. Due to sexual isolation and adaptions to restricted niches as found inRickettsia (Kurland et al. 1998) or Mycobacterium (Cole et al. 2001) strains, non–functional genes were created and lost as they were no longer needed (Darby et al.2007) when inhabiting a host organism, e.g. genes responsible for flagellar motility (Maurelli2007). In addition, within–host genome evolution was detected when analyzing host–microbe interactions, e.g. insertions and deletions within noncoding areas of differentBurkholderia strains (Romero et al.2006). This also opened the “eco–evo perspective” (ecology–evolution). In this context, microbes were recognized in combination with their lifestyle. They were shown to have the ability to shift from pathogenic to commensal states and vice versa (Loman and Pallen2015) as non–pathogenic strains were found to encode virulence factors, e.g. antimicrobial peptide violacein in the free–livingChromobacterium violaceumATCC 12472 (Holden et al.2004). Beside, the usage of comparative genomics led to one of the very recent scientific breakthroughs: the detection of Clustered Regularly Interspaced Short Palindromic Repeats (CRISPR) as a prokaryotic immune system detected in many bacterial genomes (Makarova et al. 2006) and its usage for genome engineering (Pennisi2013).
Beside functional and evolutionary genomics, the field can be divided into other research areas. Functional genomics involves not only genomic data, but also transcriptomics (that is, the sequencing complete RNA), to describe gene functions, expression and is focussed on dynamic processes such as transcription, translation, regulation of genes, and their interactions. Following, forward–engineering of metabolic pathways led to the rerouting of biosynthetic pathways and production of biodiesel (Steen et al.2010), gasoline (Choi and Lee 2013), or even the antimalarial drug artemisinin in 2013 (Paddon et al. 2013). A
new and emerging field is single cell genomics, using isolated DNA from individual cells for genomic sequencing (e.g. Kamke et al. 2014; Siegl et al. 2011). It is a promising tool as it can be used on (bacterial) cells, which can not be cultured. However, it is technically challenging as cells need to kept viable during enzymatic/mechanical isolation.
Due to whole genome amplifications, artifacts as genome loss, mutations and chimeras may be introduced (Gawad et al. 2016). But, this approach filled the phylogenetic tree with reference genomes previously unculutivated and only known by barcodes or even unknown phyla as TM7 from human mouth or soil (Marcy et al.2007; Podar et al.2007), or phyla as Poribacteria (Siegl et al.2011), or Tectomicrobia from sponges with high potential for the synthesis of secondary metabolites (Wilson et al.2014) as source for novel drugs. To sum up, genomics can provide insights into genetic mark–ups, functional and metabolic capabilities, evolution of organisms on a molecular level, resolve phylogenetic patterns, and can be used for bioprospecting approaches.
The termmetagenomics was first coined by Jo Handelsman in 1998 and defined as “[cloning]
and functional analysis of collective microbial genomes” (Handelsman et al. 1998). It is also refered to as environmental genomics, community genomics or population genomics (Handelsman 2004). Until today its defintion has modified as the direct sequencing — i.e.
circumvents unculturability — of microbial genomes within an environmental sample.
Classical microbial genome sequencing, except single cell genomics, has the drawback to rely on culturing the organism of interest. As observed by microscopy, environments contain millions of microbial cells of different species, but only few of them grow on petri plates (Amann 1911). The number of culturable microorganisms was estimated 1 % (Hugenholtz2002). This phenomenon was called the great plate count anomaly (Staley and Konopka 1985). First attempts by Norman R. Pace focused on the amplification without
“[i]solation of the 16S rRNA or cloning of its gene” (Lane et al. 1985). This lead to the idea of cloning DNA directly from the environment (Pace et al. 1985). Thanks to the efforts of Pace and colleagues, extraction of phylogenetic marker genes from environmental samples became possible (Giovannoni et al. 1990) and opened a world far more complex than was seen based on morphological features. First limited to non–protein coding genes, subsequent studies by DeLong and Healy also reported the direct isolation of functional genes (Healy et al. 1995; Stein et al. 1996). These concepts are in use today to explore microbial communites through massive parallel sequencing of 16S ribosomal RNA (rRNA) marker genes (= amplicon sequencing) and might be considered as targeted metagenomics (Knief 2014). It can also be applied to explore the diversity of functional genes such as polyketide synthases (PKSs) using distinct primers (Della Sala et al. 2014) and subsequent identification of the underlying product.
In 2002, whole metagenome shotgun sequencing was invented. In short, DNA is extracted from all cells in a community sample. Instead of targeting genomic features for amplification, DNA is sheared into small fragments that are sequenced independently. These DNA sequences occur from different genomic locations for the various genomes present in the sample, which includes also non–microbial DNA. Some fragments relate to taxonomically
informative loci (e.g. 16S rRNA), and others to coding sequences (Sharpton2014). Hence, with shotgun metagenomics, one is able to not only answer the question “Who is there?”, but also “What are they doing?” (Handelsman2004) as metagenomics give access to the functional repertoire of microbial communities (Thomas et al.2012). Functional comparative metagenomics enabling the reconstruction of metabolic pathways (Escobar-Zepeda et al.
2015), or may be as simple as comparisons of GC–content (Foerstner et al.2005) or genome sizes. Moreover, functions of microbial communities can be linked to geographic locations or explain interactions and adaptions between hosts and microbes. In addition, it is possible to reconstruct single genomes from metagenomic samples (Albertsen et al. 2013), which might reveal conditions of yet unculturable strains (Burgsdorf et al.2015). Metagenomics is able to connect function to phylogenetic, chemical or other biological traits to characterize the environment (Thomas et al.2012). This can be considered an advantage over genomics, to the expense, generated data is more complex and at higher costs.
Since the first well–analyzed shotgun metagenomic studies as the Acid Mine Drainage microbial biofilm (Tyson et al.2004), the Sargasso Sea surface water (Venter et al.2004), or the Whale Fall (whale bone) and Minnesota farm soil metagenomes (Tringe et al.2005), the number of registered metagenomic projects in GOLD has increased to more than 10 000 by the end of 2015 (Figure 4). Moreover, consortia for the sequencing of metagenomes have been launched as the TerraGenome project (Vogel et al.2009) for soil or the Human Microbiome Project (HMP) (Human Microbiome Project Consortium 2012). Endeavours in generating huge amounts of metagenomic data shows its importance to biological sciences, but also leads to challenges due to their dimensions, sequence diversity and their fragmentation.
With regards to other –omics, both genomics and metagenomics are limited to the description of functional potential within one or more organisms. To adress questions as “What genes are expressed?”, “What are the microbes doing at the moment?” or
“Which functions are up– or down–regulated during a specific event?”, techniques as (meta–
)transcriptomics (that is the total set of mRNA sequenced) or (meta–)proteomics (that is, detecting all proteins in given cells) are necessary. Despite its limitations, metagenomics is considered one of the “[m]ost remarkable events in the field of microbial ecology” (Thomas et al.2012), as it offers functional insights into microbial communities remaining unknown by culture–depdendent methods based on the blueprint of life — DNA.
A (meta–)genomic workflow
Current genome and metagenome projects sequenced on NGS platforms produce high throughput with usually short reads. Data generation is estimated to be doubled every 7 months (Stephens et al.2015). According to Moore’s Law, this can no longer be compensated by computer power, which doubles every 18 months. Consequently, the amount of data poses bioinformatic challenges when it comes to sequence quality assessments, alignment, assembly, storage and release (Shendure and Ji 2008) or integration and interpretation.
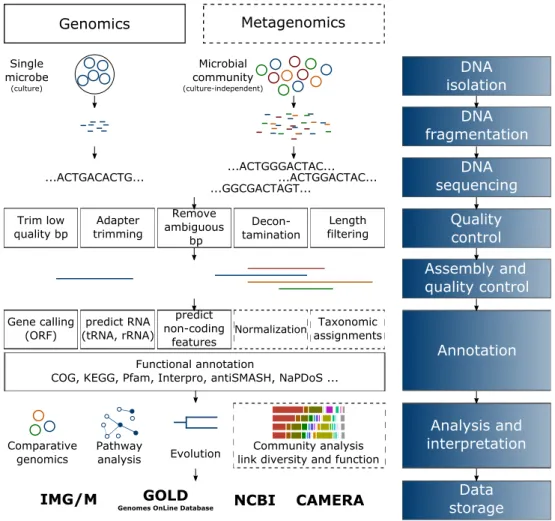
Below described are the steps towards genomic and metagenomic data. A workflow from sampling to data storage is illustrated in Figure 5.
The adequate sampling and its procession is a first and most crucial step to assure high quality. Especially in the field of metagenomics the sample has to be representative for all cells (Thomas et al.2012). For DNA extraction, suitable treatments, e.g. lysis, fractionation or disruption may be applied to the sample (Figure 5, DNA isolation and fragmentation).
The obtained DNA can then be sequenced on an appropiate platform (see Figure 5 DNA sequencing). Next steps conduct an extensive quality control (Figure 5 Quality control).
Whereas the quality (PHRED score, length, ambiguous basepairs, throughput) of sequenced reads can be measured with ease, i.e. using FastQC (Andrews 2016), the quality of a sequencing project becomes available not until initial processing. For example, within 202 metagenome studies, 145 were found with human contamination of up to 64 % (Schmieder and Edwards 2011), but also genomic studies are not free of contamination (Merchant et al.
2014). This is a serious concern often overlooked and may lead to erroneous downstream analysis (Schmieder and Edwards 2011). It also affects the assembly of genomes, i.e. put
DNA isolation
DNA fragmentation
DNA sequencing
Quality control Assembly and quality control
Annotation
Analysis and interpretation
Data storage Genomics Metagenomics
...ACTGACACTG... ...ACTGGGACTAC...
...ACTGGACTAC...
...GGCGACTAGT...
Single microbe
(culture)
Microbial community
(culture-independent)
Trim low quality bp
Remove ambiguous
bp Adapter
trimming Decon-
tamination
Length filtering
Gene calling (ORF)
predict non-coding
features predict RNA
(tRNA, rRNA) Normalization Taxonomic assignments Functional annotation
COG, KEGG, Pfam, Interpro, antiSMASH, NaPDoS ...
Comparative
genomics Pathway Evolution analysis
Community analysis link diversity and function
IMG/M GOLD
Genomes OnLine Database NCBI CAMERA
Figure 5. – Simplified flowchart of genomic (left) and metagenomic (right) projects from sampling to storage. Dashed lines indicate steps only conducted for metage- nomics.
together reads of DNA into longer fragments, so called contigs (Figure 5 Assembly and qualtiy control). This is considered one of the most complex computational tasks in biology (Baker 2012), and is even more complicated for metagenomes (Sharpton 2014) due to chimeric sequences, uneven coverage, and the large amount of different species. For analysis of long genetic elements or genes in genomic proximity as secondary metabolite gene clusters or CRISPR, it is inevitable to work on assembled sequences rather than separated reads (Thomas et al. 2012). The assembly process is followed by the prediction of open reading frames (ORFs) and their functional annotation with available databases such as Clusters of Orthologous Groups (COG) (Galperin et al.2015), TIGRFAM (Haft et al. 2013), or Protein Families (PFAM) (Finn et al.2016). Several web servers are specialized ressources and merge the information of several databases for functional annotation and comparison of genomic and/or metagenomic datasets. Among these prominent ones are RAST and MG–RAST servers, IMG/M or EDGAR (Aziz et al.2008; Blom et al.2016; Markowitz et al.
2012; Meyer et al. 2008). If one is interested in more specialized analysis, e.g. secondary metabolism, web servers as antiSMASH (Weber et al.2015) may be conducted. Also, the use of locally installed and manually set up databases for Basic Local Alignment and Search Tool (BLAST) or hidden–markov model (HMM) searches may be necessary for a more specific annotation, but requires great computational ressources (Figure 5 Annotation).
Noteworthy, only around 50 % of all sequences may be successfully annotated (Thomas et al.2012) as this process is limited to known genes in databases. Interpretation of the created data hardly depends on the project behind (Figure 5 Analysis and interpretation).
For single genomes, one may conduct analysis on evolutionary genomics by searching for orthologous or paralogous genes. Also, the creation of core– or pan–genomes is a way to learn about evolution when looking for absent or present features between close bacterial strains. Using metagenomic approaches, it is possible to get an overview of a whole bacterial community and its diversity which can than be associated to their functional composition (Tringe 2005). Platforms such as NCBI, IMG, RAST/MG–RAST or CAMERA provide an integrated environment for the analysis, storage, management and allow sharing and visualization of genomic and metagenomic data (Figure 5 Data storage) (Pavlopoulos et al.
2015).
As biology has become a big data science, the challenges are multilayered, starting with sampling and data generation generation, over quality control and assembly, analysis, final interpretation, and finding appropriate software in the plethora of available ones.
A microbial world
With an estimated number of1029prokayrotic cells around the world (Lougheed2012) exceed other lifeforms by orders of magnitudes. They can be found in the harshest environments (e.g.
Huber et al.2000; Tyson et al.2004) probably due to their metabolic diversity (Kostadinov 2011). First observations by Robert Koch revealed connections between microbes and diseases in various hosts as humans, plants or other animals (De Kruif 2002) and launched a generation of “microbe hunters” (Choffnes et al.2013) sytematically searching for pathogenic microbes. Around the same time, the question arose, if microorganisms do not only harm, but also support their respective host (Choffnes et al.2013), and given rise to the concept of symbiosis. This can be separated in three relationships between hosts and microorganisms, which form a continuum: parasitic (=interaction, in which one partner benefits at the expense of the other) , commensal (=beneficial interaction for one partner without affecting the other) and mutualistic (=beneficial interaction for both partner) (Little et al. 2008).
However these relationships can not be separated clearly, the definition by Anton de Bary is used here: “the living together of unlike organisms” (Bary 1878). Microbes were found to be essential for all life on earth. They produce important compounds as oxygen for the earths atmosphere through photosynthesis (Pedrós-Alió2006), are responsible for catalyzing carbon (Falkowski et al. 1998), nitrogen, oxygen or phosphorus into accessible forms and make nutrients available to their hosts (Handelsman et al. 2007) — to only name a few examples among thousands. With that our view on microbies has changed within the last decades.
We are aware of their real impact, but understanding microbes and the combined activities within microbial communities is still in its infancy. Modern biology relies not only on microscopy and the description of microbial phenotypes. These techniques and culturing of microbes will still be important (Handelsman et al. 2007), but are limited to the visibility of features. With the discovery of DNA (Watson and Crick 1953), the door was opened for molecular biology and the research of intrinsic, genotypic features. Tradititional methods, have in the last few decades, supplemented by the sequencing of DNA, helping to understand the functional and metabolic repertoire of microbes and determine interactions between microorganisms and the environment or their hosts.
Below, examples of microbes and their impact — in particular bacteria — are provided for two different environments: the plant surface and within marine sponges as these were the main research fields in this thesis. Each starting with an overview of environmental variables, the microbial community inhabiting the habitat and insights from modern sequencing approaches.
Microbial life in the phyllosphere
The phyllosphere is known as the aerial surfaces of plants (Kembel et al. 2014) and is dominated by the leaves (Vorholt2012). It is estimated, that the phyllosphere spans an area up to 6.4*108km2. The leaf surface is far from sterile and is considered as a hostile and short–lived environment for microbes, due to temperature shifts, UV–radiation, fluctuating humidity and desiccation, limited nutrients (oligotrophic) and their uneven distribution among leaves (Remus-Emsermann et al.2011; Remus-Emsermann and Leveau2010), and their heterogenity at the micro– and macroscale (Lindow and Brandl2003; Vorholt2012).
Also surrounding conditions as the atmosphere, wind and gas exchange have been shown on lettuce leaves to have an effect on epiphytic bacterial communities (Medina-Martinez et al.
2015) as they might induce stomata closure and reduce nutrient availability (Leveau and Lindow 2001; Miller et al.2001). On the one hand, inhabitants encounter antimicrobial compounds either produced by other microbes or the plant itself (Vorholt2012) (Figure 6 A and B). On the other hand, phyllosphere microbes, such asPseudomonas sp, were also shown to protect the plant against pathogen invasion (e.g. fungi) by producing plant hormones (Ritpitakphong et al.2016) or even support their host plant through drought tolerance (Lau and Lennon2012) and disease resistance (Santhanam et al. 2015). Interactions between plants and their microbiome seem to be mutualistic, thus it is not surprising, that the planetary population of bacteria – by far the most abundant inhabitants — is as large as 1026 cells in the phyllosphere (Lindow and Brandl 2003) and is assumed to be as high as 106 – 107 cells/cm2 (Lindow and Brandl 2003). Maybe explained, as phyllosphere–bacteria represent an ancient symbiosis (Partida-Martinez and Heil 2011) in which the bacteria extend the host phenotype (Wagner et al. 2016).
Photosynthate uptake (e.g. fructose, sucrose)
Pigments Quorum sensing
molecules Osmo- protectants (e.g. betaine) Antibiotics
Efflux pump
Auxin
Flagellum DNA repair/
stress response proteins UV radiation/
Dessiccation Humidity
NN
NN NN
N N N
A A
AA AA
A
NNutrients
Interaction (antibiosis, competition)
AAntimicrobial compounds
A B
Figure 6. – (A) Microbe–microbe and plant–microbe interactions which may occur in the phyllosphere due to competition through antibiosis for nutrients and best environmental conditions. (B) Traits which allow and support microbes to establish and colonize the phyllosphere comprising the production of osmopro- tectants, auxin, antibiotics or the uptake of photosynthates. Adapted from Vorholt (2012)
Insights into microbial phyllosphere communities have been obtained mostly through amplification and pyrosequencing of 16S rRNA marker genes (Vorholt 2012). Overall, the species richness was found to be lower compared to soil, the rhizosphere, costal seawater, or the human gut (Delmotte et al. 2009; Knief et al. 2012b). Identified dominant bacterial phyla on different plants are Proteobacteria, Firmicutes, andActinobacteria (Williams and Marco 2014), but their proportions vary depending on several traits: Knief et al. (2010) have shown, that geographic location of a plant has more impact than the plant species, but only shown forMethylobacterium communites. Redford et al. (2010) concludes communities do not become more distinct with increasing geographic distance. Instead, they found
“[i]nterspecies variability exceeds intraspecies variability” for 56 tree species. In another study, the wax composition of A. thaliana leaves was shown to have an effect on bacterial community composition (Reisberg et al.2013). Further variations in microbial communities were linked to season: Firmicutes were dominant in planting of lettuce in june, in august and october it were Proteobacteria (Williams et al. 2013). Also the genotype of the plant seems to be an determining factor for communities (Hunter et al. 2010; Knief et al.2010;
Redford et al. 2010).
Genomic investigations revealed functional adaptions to the phyllospheric habitat as repair of UV–damaged DNA, uptake of photosynthates (sucrose, fructose) or production of osmoprotectants such as trehalose or betaine (Horn et al. 2016a; Remus-Emsermann et al. 2013) (Figure 6 B). Deeper insights in plant–microbe interactions on a functional scale and using cultivation–independet techniques are scarce (Berlec 2012). However, metaproteogenomic approaches to investigate bacteria on soya bean, A. thaliana, clover (Delmotte et al. 2009) and rice (Knief et al. 2012b) are outstanding examples. They were able to identify more than 4 600 proteins, a methanol–based methylotrophy within the genus Methylobacterium and specific functions as response to reactive oxygen species the invasion–associated locus B when compared to the rhizosphere. Atamna-Ismaeel et al. (2012) identified rhodopsins in the microbiome of theTamarix,A. thaliana and rice phyllosphere and subsequent light sensing genes in Tamarix as adaption to the leaf habitat using a metagenomic approach (Finkel et al. 2016). In a recent resarch on 400 draft genomes from the phyllosphere and rhizosphere of A. thaliana, not only a huge phylogenetic overlap was detected, but also a large overlap of functionalities was found. An enriched function in phyllosphere bacteria was carbohydrate metabolism, possibly due to the fact, carbon is easier accessible in roots htan from the leaves (Bais et al. 2006). Vice versa, root microbial genomes are enriched in genes to process aromatic compounds. Overally, it was hypothesized, that functional and phylogenetic diversification is driven by taxonomic affiliation rather than ecological effects (Bai et al.2015). Taxonomic identity as a major driver in microbial community structure have also been found before (Kembel et al. 2014; Redford et al. 2010).
With the use of genome—wide association studys (GWASs), genetic loci varying in plants were identified leading to different bacterial communities. Based on 196 accessions of A. thaliana, gene loci responsible for cell wall integritiy and defense were suggested to alter the bacterial community. Further, genetic variation linked to morphogenesis and trichome
branching was shown to shape the richness of the inhabiting community (Horton et al.
2014). Comprising, it is assumed that there is more than one single factor playing the key role in the process of microbial community assembly in the phyllosphere (Finkel et al.2012;
Hunter et al.2010; Knief et al.2010; Redford et al. 2010).
Microbial life within sponges
Sponges (phylum Poriferea) represent one of the oldest metazoans of the extant animal lineages (Li et al.1998; Love et al.2009) with a record dating back 600 million years (Erwin et al. 2011) reflecting their evolutionary success. Around 15 000 species are estimated to exist, belonging to three major classes (Hexactinellida, Calcarea, and Demospongiae).
Sponges are widespread among aquatic habitats such as freshwater lakes, the deep sea, tropical and subtropical oceans as well as polar regions (Hooper and Van Soest2002). They are sessile animals with a simple but optimized body–plan towards filter–feeding (Leys and Hill2012) which enables them to pump 24 000 liters per day (Vogel 1977) to sequester nutrients. Due to their pumping performance, they contribute much to the function of benthic communities, e.g. through carbon or nitrogen cycling (Bell2008).
Their immobile lifesytle resulted in a well adapted and complex innate immune system (Müller and Müller2003) to defend against pathogens and invading parasites. Thus sur-
prising, organisms of all domains of life,Bacteria, Archaea, Eukarya reside within sponges (Taylor et al.2007; Wiens et al.2007). Hence, recognition upon symbiotic or non–symbiotic microbes is evident (Hentschel et al.2012). Even more interesting is the high abundance of microbes, which can make up to 35 % of the sponge biomass (Vacelet1975) and may exceed 109 cells per sponge tissue (Webster and Hill2001). Based on these numbers, sponges can be classified as either low microbial abundance (LMA) or high microbial abundance (HMA) sponges (Bayer et al.2014; Gloeckner et al.2014; Hentschel et al. 2003).
Initially, the diversity of sponge–associated microbes was observed based on microscopy (Vacelet1975), but has changed from denaturating gradient gel electrophoresis (DGGE) and flueorescence in situ hybridization (FISH) to 16S rRNA clone libraries (Hentschel et al.
2006) and direct sequencing of 16S rRNA from environmental samples. Studies recovered 32 different bacterial phyla (Schmitt et al.2012) in sponges with the most abundant ones appertaining to theProteobacteria,Chloroflexi,Actinobacteria,Nitrospirae and the candi- date phylumPoribacteria (Hentschel et al.2012). Further phylogenetic analysis showed, that bacterial phyla fall into sponge–specific clusters, (Hentschel et al. 2002) but with low abundances in other environements such as sediment or seawater (Taylor et al.2013;
Webster et al.2010). Species–specific microbes of sponges have been found to be stable across geographic distances (Taylor et al.2005), over different time periods (Friedrich et al.
2001) starvation, antibiotic treatment and transplantation (Friedrich et al. 2001; Thoms et al. 2003). Latest studies revealed varying richness of sponge microbes ranging from 50 to 3 820 distinct symbionts but with a low variablity between the hosts of the same species. Further, 41 different phyla were identified with at least 13 of them residing in all 81
investigated sponge species (Thomas et al. 2016). Thus, sponges show a distinct community with low abundance in other environments, which is stable within the same host species.
Within the last years, not only the community composition, but also their functional reper- toire attributing to commensal interactions with the host was investigated. Heterotrophic microorganisms have been reported many times to be associated with sponges (Hentschel et al.2012; Taylor et al.2007), not surprising as sponges provide a high amount of nutrients, and thus represeent an ideal environment. Organic carbon assimilation was found to be mediated by different sponge species and their microbial symbionts (Goeij et al.2008; Yahel et al.2003). The degradation of carbohydrates is performed by the sponge–specific candidate phylum Poribacteria, and may thus be considered as relevant for symbiosis (Kamke et al.
2013). One carbon metabolism has been reported for methanotrophic bacteria associated to deep–sea sponges (Vacelet et al. 1995) and Arenosclera brasiliensis (Trindade-Silva et al.
2012). Further examples are the photosynthetic carbon fixation through cynobacteria, which provide up to 50 % of energy for their respective host (Cheshire and Wilkinson1991;
Steindler et al. 2002; Wilkinson1983) or methylotrophy for Gammaproteobacteria revealed through metatranscriptomics (Moitinho-Silva et al.2014).
Apart from carbon, nitrogen cycling has been well–investigated, as it is the base for the synthesis of amino acids and proteins (Taylor et al. 2007). Especially in oligotrophic environments, such as coral reefs, symbiotic microbes may contribute to the nitrogen level of sponges through fixation of atmospheric nitrogen (Wilkinson et al. 1999). Moreover, archaea and bacteria were found to be involved in nitrification processes and relevant functional genes, such as amoA, (Bayer et al. 2008; Radax et al. 2012) were detected using several meta–omic approaches (Fan et al. 2012; Liu et al.2012b; Radax et al.2012;
Thomas et al.2010). Specific transport functions between symbionts and their sponge host were revealed (Liu et al.2012b), suggesting a close link for this relationship. Notably, not only the symbionts benefit from the sponge–excreted waste, but also sponges digest their symbionts (Vacelet et al. 1996) to gain energy and nutrients. Aside these major cycles, symbionts were shown to be able to degrade halogenates using a metageneomic approach in Aplysina aerophoba (Bayer et al.2013), synthesizing vitamins and cofactors (Fan et al.2012;
Hentschel et al. 2012; Thomas et al.2010) or protect the sponge and help to respond to variable environmental conditions by expressing stress protection proteins (Fan et al. 2012;
Liu et al. 2012b). The high abundance of CRISPR in symbionts compared to seawater microbes (Fan et al. 2012) may further protect the host from phages.
Sponges are a well–known source for diverse secondary metabolites, which are considered a chemical defense system (Proksch 1994) helping them to defend against harmful microbes (Taylor et al. 2007) and regulate their numbers. The diverse organic compounds include terpenoids, peptides, alkaloids (Lejon et al. 2011), PKS, nonribosomal peptide synthetase (NRPS), showing anti–microbial, anti–fungal or even anti–cancer activity (Abdelmohsen et al.2012,2014c; Blunt et al.2016). Many of the bioactive compounds have been identified to be produced by their symbionts rather than the sponge (Piel 2009). In particular, actinomycetes have been found to be a rich source of secondary metabolites among sponge–
associated bacteria (Abdelmohsen et al.2014c; Cheng et al.2015). As much as 50 % of all bioactive compounds can be traced back to actinomycetes (Abdelmohsen et al.2014a).
This has drawn much attention to these symbionts. Among the plethora of secondary metabolites, polyketides are often in focus “[f]rom a drug discovery perspective” (Della Sala et al.2014) and due to their diversity and various pharmacological activities. Polyketides are catalyzed by PKS in a modular fashion. PKS were isolated from metagenomes or via PCR–approaches from symbionts of different marine sponges (Theonella swinhoei, Plakortis simplex,A. aerophoba) and shown to produce the antitumor polyketides psymberin (Fisch et al. 2009), onnamide (Piel et al. 2004) and swinholide A (Bewley et al. 1996).
Among the different PKS classes (cis–AT, trans–AT, FAS–like), two were found to be sponge exclusive: sup–PKS (symbiont ubiquitous type I PKS) (Fieseler et al.2007) andSwf (Della Sala et al.2014). Both represent mono–modular PKS, and the sup–PKS is predicted to produce mid-chain-branched fatty acids (Fieseler et al. 2007). Further, the sup–PKS cluster may be linked toPoribacteria (Hochmuth et al.2010; Siegl and Hentschel2010).
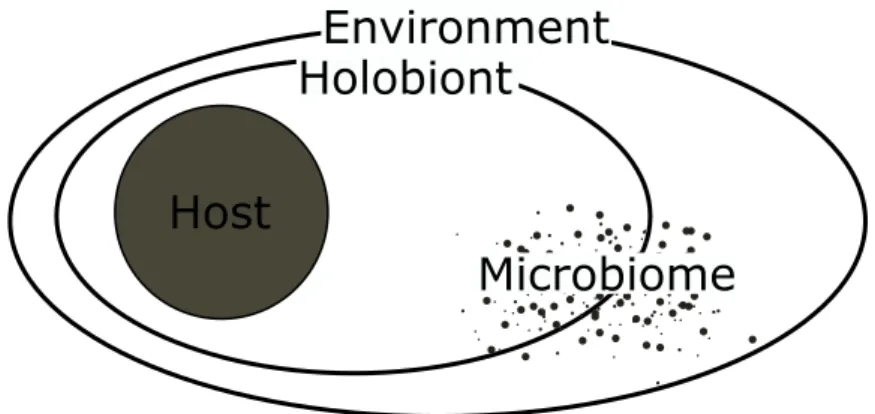
The microbial ecology, specifically community structure and function has received much recent attention. This is driven by the recognition of the holobiont concept – describing
“[a] network of interactions between a host and its symbiotic microbial consortia” (Webster and Thomas2016) within an environment (Figure 7). Patterns are independent whether the host is a plant, an animal or human. This concept allows for overarching questions to be addressed to understand the function of this kind of association as a whole (Bosch and Miller2016). With latest sequencing technologies, insights into functional aspects are
Host
Microbiome Environment
Holobiont
Figure 7. – The holobiont concept describing the asociation between a host and its micro- biome in a defined environment.
now possible. Despite the shown efforts and findings, important questions as “How stable are microbial communities?”, “What are effects on the host?” or “What are functional drivers of community structure?” remain unanswered. Future directions head towards the
use of synthetic communities (e.g. (Bodenhausen et al. 2014)) to link observations with genomic information (Vorholt 2012) and the further integration of meta–omic studies in a combination with cultivation techniques (Müller and Ruppel 2014) to further clarify the functional capabilites of the microorganisms. These will help to understand the complex relationship between hosts and their associated microbes.
Scope and structure
The overall goal of this thesis was to explore bacterial genomic and metagenomic data of microbes and microbial comunities associated with different hosts – the leaf surface of A. thaliana and microbial communities within marine sponges. As metagenomic data is complex due to its dimensions and amounts of data, this states a challenge. The first task was to make that data accessible for downstream analysis. In particular, I analyzed functions contributing to host–microbe interactions, adaptions to the host/environment, and defense mechanisms. Further, genomes and metagenomes were screened for secondary metabolite genes. This thesis has four major goals and is structured as follows:
Part I, an overall introduction to sequencing, arised –omics and their terminology and applications are described accompanied by examples from previous studies on microbes the phyllsophere and sponge environments. Part II comprises material and methods used in this thesis. Part III describes the results as follows:
Chapter 1 Investigate, develop and compare methods for bacterial genome as- sembly. The main focus was on the decontamination and clean–up processes to generate high–quality draft genomes ready for downstream analysis.
Chapter 2 Generate a draft genome and study the phyllosphere bacterium, Williamsiasp. ARP1. The genomic sequence was analyzed in terms of adaptions to the phyllosphere environment. Further, the taxonomic relationship of the generaWilliamsia andGordonia was explored based on a taxonomic marker and on the genomic level.
Chapters 3–4 Investigate bacterial isolates from sponges for presence of sec- ondary metabolite genes. The genomes of six bacterial isolates were analyzed in terms of secondary metabolism (=bioprospecting) and possible natural products using state–of–
the–art software.
Chapter 5 Explore four microbial metagenomes from sponges and seawater to- wards bacterial defense systems. Metagenomes – originating from three mediterranean sponges and from seawater – were compared and differences regarding defense systems comprising CRISPR and restriction modification system (RMS). In addition, the genomic composition and features as the GC distribution were exposed.
Within Part IV the obtained results are discussed including the limits and potential of –omics data, and compared to similar studies. In Part V, the results are concluded and an
outlook for future projects is given.
Material and methods
Material
Samples and sequencing data
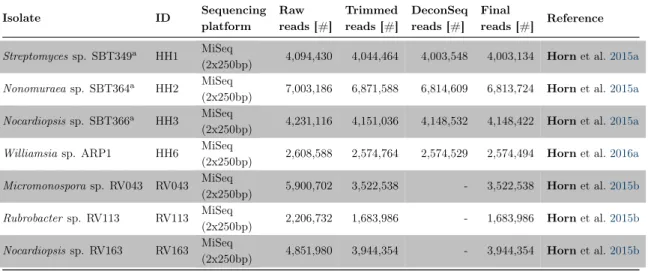
All samples were obtained from studies carried out and/or supervised by colleagues of the Department of Botany II, University of Würzburg, Germany. Described below are the sampling sites and necessary steps to obtain sequencing data, associated people and companies.
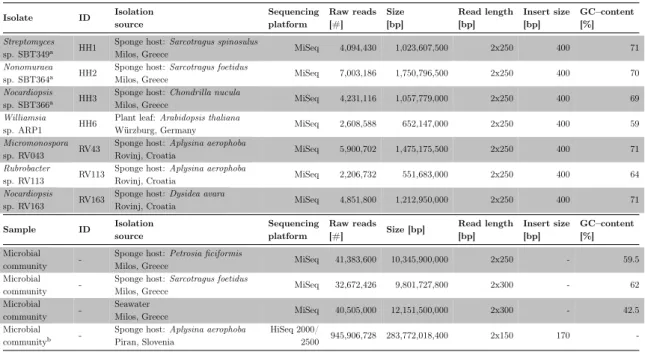
Samples for genomic sequencing
Bacterial strains were isolated from the phyllosphere of Arabidopsis thaliana in June 2012 in the Botanical Garden of the University of Würzburg, Germany (N 49.765°, E 9.932°) or from sponges derived from the Mediterranean Sea in Milos, Greece (N 36.767°, E 24.514°), Rovinj, Croatia (N 27.794°, E 34.215°) in May, 2013. Growth of the strains on substrate was carried out by Cheng Cheng, Usama Abdelmohsen (Department of Botany II, University of Würzburg, Germany) or by myself. Christine Gernert did the DNA extraction and PCR amplification of 16S rRNA for all strains in which I participated.
Library preparation and DNA sequencing on a MiSeq platform (Illumina, Inc, Department of Human Genetics, University of Würzburg, Germany) was carried out by Wiebke Sickel and Alexander Keller (both Department of Zoology III, University of Würzburg, Germany) with a 250 bp paired–end library design and targeted insert size of 400 bp. If necessary, two libraries were sequenced to reach enough throughput and coverage (Table 1).
Samples for metagenomic sequencing
Sponge samples ofPetrosia ficiformis,Sarcotragus foetidus and one seawater sample were collected on May, 25th 2013 via SCUBA diving in Milos, Greece at a depth of 5–7 m (N 36.767°, E 24.514°). DNA extraction was carried out by Lucas Moitinho–Silva ands Kristina Bayer (both Department of Botany II, University of Würzburg, Germany). Library construction as well as DNA sequencing of associated microbes was performed at an external company (GATC Biotech AG, Konstanz, Germany). Libraries were designed using a paired–end configuration with 250 bp or 300 bp.
The samples for the spongeAplysina aerophoba were collected on May, 7th 2013 via SCUBA diving from the Adriatic Sea (northernmost arm of the Mediterranean Sea) in the Gulf of Piran, Slovenia at a depth of 5 m (approx. N 45.530°, E 13.566°) . DNA extraction was carried out by Beate Slaby (Department of Botany II, University of Würzburg, Germany), library design by Tanja Woyke (JGI, Walnut Creek, CA, USA), library construction and