SeaFlow data v1, high-resolution abundance, size and biomass of small phytoplankton in the North Pacific
François Ribalet
1*, Chris Berthiaume
1, Annette Hynes
1, Jarred Swalwell
1, Michael Carlson
2, Sophie Clayton
3, Gwenn Hennon
4, Camille Poirier
5,6, Eric Shimabukuro
7, Angelicque White
7& E. Virginia Armbrust
1SeaFlow is an underway flow cytometer that provides continuous shipboard observations of the abundance and optical properties of small phytoplankton (<5 μm in equivalent spherical diameter, ESD). Here we present data sets consisting of SeaFlow-based cell abundance, forward light scatter, and pigment fluorescence of individual cells, as well as derived estimates of ESD and cellular carbon content of picophytoplankton, which includes the cyanobacteria Prochlorococcus, Synechococcus and small-sized Crocosphaera (<5 μm ESD), and picophytoplankton and nanophytoplankton (2–5 μm ESD). Data were collected in surface waters (≈5 m depth) from 27 oceanographic cruises carried out in the Northeast Pacific Ocean between 2010 and 2018. Thirteen cruises provide high spatial resolution (≈1 km) measurements across 32,500 km of the Northeast Pacific Ocean and 14 near-monthly cruises beginning in 2015 provide seasonal distributions at the long-term sampling site (Station ALOHA) of the Hawaii Ocean Time-Series. These data sets expand our knowledge of the current spatial and temporal distributions of picophytoplankton in the surface ocean.
Background & Summary
Marine phytoplankton are responsible for about half of the planet’s annual production of oxygen and organic carbon, and thus play a significant role in mediating global biogeochemical cycles1. Quantitative information on the temporal and spatial distributions of phytoplankton populations in the ocean is critical for understanding how these organisms interact with their environments. Individual phytoplankton species range in diameter from
≈0.6 μm to over a millimeter2, with a predominance of the smaller phytoplankton (less than a few micrometers in size) in open ocean environments. In oligotrophic subtropical gyres, phytoplankton communities are numerically dominated by the cyanobacteria of the genus Prochlorococcus (<1 μm in diameter), which are well-adapted to low nutrient conditions3. The nitrogen gas-fixing cyanobacteria Crocosphaera (2–5 μm in diameter) are also sporad- ically observed in nitrogen-limited subtropical gyres; a portion of the nitrogen fixed by these organisms is made available to other phytoplankton4. In colder, more productive subpolar gyres, the cyanobacteria Synechococcus (1–2 μm in diameter) and picophytoplankton and nanophytoplankton (2–5 μm in diameter) numerically domi- nate phytoplankton communities5,6.
The abundance and distribution of different groups of phytoplankton reflect a combination of prevailing envi- ronmental conditions and resulting food-web dynamics. Flow cytometry is well-suited to mapping the distribu- tion of the small phytoplankton (<5 μm in diameter) because of their relatively high abundance and the innate fluorescence of their pigments; for example, all phytoplankton possess chlorophyll a and a subset additionally
1School of Oceanography, University of Washington, Seattle, WA, 98195, USA. 2faculty of Biology, technion – Israel Institute of Technology, Haifa, 3200003, Israel. 3Department of Ocean, earth and Atmospheric Sciences, Old Dominion University, Norfolk, VA, 23529, USA. 4college of fisheries and Ocean Sciences, University of Alaska Fairbanks, Fairbanks, AK, 99775, USA. 5Monterey Bay Research Institute, 7700 Sandholdt Rd, Moss Landing, CA, USA. 6Ocean ecoSystems Biology Unit, GeOMAR Helmholtz centre for Ocean Research Kiel, Dusternbrookerweg 20, Kiel, Germany. 7Department of Oceanography, Daniel K. inouye center for Microbial Oceanography: Research and Education (C-MORE), University of Hawai’i at Manoa, Honolulu, HI, 96822, USA. *email: ribalet@uw.edu
DATA DESCRiPTOR
OPEN
possess phycoerythrin (e.g., Synechococcus and Crocosphaera). Models based on compilations of flow cytom- etry measurements from 1987–2011 predict that the distributions of cyanobacteria, picophytoplankton and nanophytoplankton may change significantly in future oceans5,6 as the surface waters warm and nutrient sup- ply is reduced3. However, because the dim cellular chlorophyll fluorescence of Prochlorococcus in oligotrophic surface waters is near the detection limit of most commercially-available flow cytometers7, information on the broad-scale distribution of Prochlorococcus in surface waters remains limited.
SeaFlow is a custom-built shipboard flow cytometer developed for high-resolution observations of picophyto- plankton in surface waters, including Prochlorococcus8. SeaFlow eliminates the traditional need for a sheath fluid by employing a unique optical system that relies on three photodetectors, including two position-sensitive detec- tors, to create a virtual core in the sample stream within which the properties of particles are accurately measured.
20 40 60
−160 −140 −120
Longitude (E)
Latitude (N)
1 100 10000 datafiles
Fig. 1 Distribution of the number of data files. Location and number of data files aggregated into 1 degree bins of latitude and longitude. Red outlined square indicates the location of Station ALOHA.
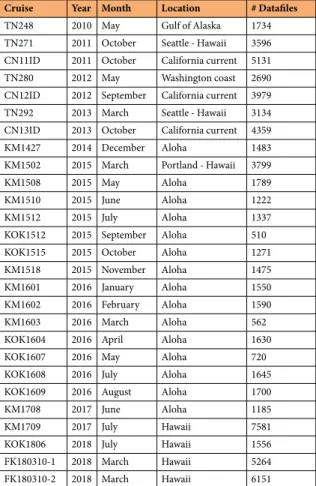
Cruise Year Month Location # Datafiles
TN248 2010 May Gulf of Alaska 1734 TN271 2011 October Seattle - Hawaii 3596 CN11ID 2011 October California current 5131 TN280 2012 May Washington coast 2690 CN12ID 2012 September California current 3979 TN292 2013 March Seattle - Hawaii 3134 CN13ID 2013 October California current 4359
KM1427 2014 December Aloha 1483
KM1502 2015 March Portland - Hawaii 3799
KM1508 2015 May Aloha 1789
KM1510 2015 June Aloha 1222
KM1512 2015 July Aloha 1337
KOK1512 2015 September Aloha 510
KOK1515 2015 October Aloha 1271
KM1518 2015 November Aloha 1475
KM1601 2016 January Aloha 1550
KM1602 2016 February Aloha 1590
KM1603 2016 March Aloha 562
KOK1604 2016 April Aloha 1630
KOK1607 2016 May Aloha 720
KOK1608 2016 July Aloha 1645
KOK1609 2016 August Aloha 1700
KM1708 2017 June Aloha 1185
KM1709 2017 July Hawaii 7581
KOK1806 2018 July Hawaii 1556
FK180310-1 2018 March Hawaii 5264 FK180310-2 2018 March Hawaii 6151
Table 1. List of datasets and associated cruise and geolocation metadata.
Here, we present SeaFlow datasets consisting of over 69,000 data files collected in surface waters in the Northeast Pacific Ocean (Fig. 1 and Table 1). From 2010–2018, SeaFlow was deployed on 27 cruises conducted across 32,500 km. Data files are aggregated over three-minute intervals to yield a spatial resolution of ≈1 km along the cruise track (for a ship cruising at 11 knots). Beginning in 2015, SeaFlow was deployed on near-monthly cruises in the North Pacific Subtropical Gyre, at or near the long-term Hawaii Ocean Time-series (Station ALOHA, 22.75 degN, 158 degW). Primary data are cell abundances of phytoplankton populations, optical meas- urements of light scatter, red and orange fluorescence associated with the pigments chlorophyll a and phycoeryth- rin, respectively. The classification of particles into cell populations was conducted uniformly across all samples using a combination of manual gating and unsupervised clustering algorithms9. The data sets were expanded to include equivalent spherical diameter (ESD) and carbon quotas derived from light scatter measurements. ESD was estimated by applying Mie light scattering theory to a combination of flow cytometry calibration beads and cultured organisms of determined size. Carbon quotas were then estimated from ESD using a volume-to-carbon conversion factor10. The estimates of cell abundance, light scatter, fluorescence emissions, ESD and carbon quotas include a measurement error based on the uncertainties in the virtual core volume and light scatter conversion.
Sample metadata includes location, time, underway sea surface temperature, salinity and photosynthetically active radiation (PAR) and were merged with the SeaFlow data sets. These data are available without restrictions at the Zenodo open access research data repository.
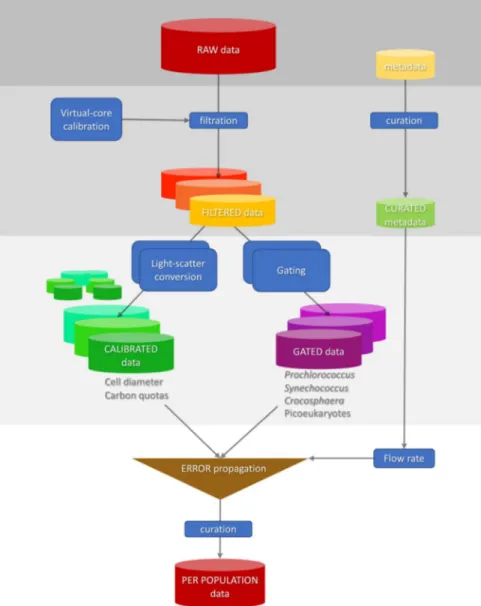
Fig. 2 Representation of the workflow starting from the raw data source to the curated per-population SeaFlow data. Classified data is the per cell forward light scatter and fluorescence for different populations and the calibrated data is the derived per equivalent spherical and cellular carbon content.
Methods
Data collection.
Each ship’s flow-through seawater system provided continuous flow of seawater collected at an assumed depth of ≈5 m (3–8 m depending on the research vessel and sea state). The water passed through a 100-μm stainless steel-mesh filter before it was sampled to prevent clogging of the 200-μm SeaFlow sampling nozzle.A real-time broadcast of position, time, temperature, salinity and light irradiance available over the ship’s net- work was recorded as-is by the SeaFlow computer. Any missing ship data were retrieved from the Rolling Deck to Repository.
Data analysis.
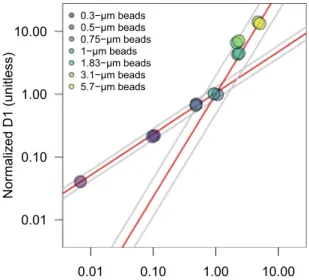
Four data processing steps are employed to transform raw SeaFlow data into processed data (Fig. 2). First, the filtration step identifies in-focus particles positioned within the SeaFlow virtual core8, a cross-sectional area within the sample stream determined by the field of view of the optical system. This field of view is a function of the magnification of the objective-tube lens system and the width of the field stop. Two position detectors (D1 and D2) determine the lateral position of a particle. Particles that scatter light equally on both detectors (aligned particles) and scatter more in the forward direction than on the two position detec- tors (in-focus particles) are considered optimally-positioned particles (OPP). The relationship between forward scatter and the two position detectors of OPP can be described by two linear regression models intersecting at the 1-μm calibration bead coordinates (Fig. 3). The uncertainties around the two slopes of the linear regression models are used to assign a confidence interval for each OPP (2.5%, 50% or 97.5% interval confidence). Each data file is linked to a unique filtration identification number that refers to the parameters used to discriminate OPP.Second, OPP are classified into cell populations by forward scatter (457/50 bandpass filter), red fluorescence (572/28 bandpass filter) and orange fluorescence (692/40 band-pass filter). Sequential manual gating is used to cluster Synechococcus, small-sized Crocosphaera and 1-μm calibration beads (Invitrogen F8823), as they each have distinguishing optical characteristics that do not overlap with other cell populations. Prochlorococcus par- ticles are clustered using a supervised clustering algorithm that emulates a sequential bivariate gating strategy based on cell density9. High forward scatter particles with high red fluorescence were classified as “picoeukaryote”
phytoplankton. Each data file is linked to a unique gating identification number that refers to the coordinates and analysis parameters used for particle classification. Cell abundance is calculated by dividing the number of particles in each population by the volume of the virtual core, which is estimated by the ratio of OPP to the total detected particles and by the volume of the sample analyzed by the instrument8. The sample volume is obtained after calibration of the water stream flow rate. Standard error of cell abundance represents the uncertainties in flow rate calibration.
Third, the equivalent spherical diameter (ESD) of individual cells is estimated from SeaFlow-based light scat- ter by the application of Mie light scatter theory to a simplified optical model. Since the optical geometry of the SeaFlow is complicated by scatter occurring within the sample stream, an optimization procedure was used to minimize differences between the measured forward scatter and the scatter intensity predicted by Mie light scat- ter of homogeneous spherical particles. The ESD of each phytoplankton cell was estimated from the optimized Mie model based on three refractive indices (1.35, 1.38 and 1.41) that cover the range applicable to marine phy- toplankton11, relative to refractive index of seawater (1.34).
Normalized forward scatter (unitless)
Normalized D1 (unitless)
0.01 0.10 1.00 10.00
0.01 0.10 1.00
10.00 0.3−µm beads 0.5−µm beads 0.75−µm beads 1−µm beads 1.83−µm beads 3.1−µm beads 5.7−µm beads
Fig. 3 Calibration of optimally-positioned particles. Optical properties of optimally-positioned calibration beads show a linear relationship between the forward scatter and the position-sensitive detectors (D1) normalized to 1-μm calibration beads, which is represented by the two linear regression models (red lines).
Grey lines represent the 95% confidence interval of the two regression models.
In the final step, carbon quotas were estimated from ESD using the equation fgC cell−1= 0.261 × Volume0.86010, assuming spherical particles.
Quality control procedure.
The stability of stream pressure and the rate of particles detected per second are used to evaluate instrument performance. Data files are identified as outliers if the stream pressure deviates by more than 5% of the mean value for a given cruise or if data acquisition exceeds 18,000 particles per second (corresponding to 200–500 particles per second in the virtual core), when coincidence of particles is likely8. The quality of estimates for ESD, carbon quotas and cell abundance was assessed by applying the Chauvenet crite- rion12, which defines outliers as data points falling outside a band around the mean corresponding to a probability of 1 − 1/(2N) (where N = total number of data points).Normalized scatter (unitless)
Diameter (µm)
0.01 0.10 1.00 10.00
0.2 0.5 1.0 2.0 5.0 10.0 20.0
50.0 0.3−µm beads 0.5−µm beads 0.75−µm beads 1−µm beads 1.83−µm beads 3.1−µm beads 5.7−µm beads Mie predictions
a
Normalized forward scatter (unitless)
0.01 0.10 1.00 10.00
Prochlorococcus (MIT9312) Prochlorococcus (MED4) Synechococcus (WH8012) Synechococcus (WH6501) Synechococcus sp.
Navicula transitans Thalassiosira pseudonana Geminifera cryophila Thalassiosira weissflogii Mie predictions
b
Normalized forward scatter (unitless) Carbon (pgC cell−1 )
0.005 0.05 0.5 5 50 500
0.01 0.10 1.00 10.00
Prochlorococcus (MED4) Prochlorococcus (1314) Prochlorococcus (AS9601) Prochlorococcus (NATL12A) Synechococcus (WH7803) Synechococcus (WH8102) Micromonas pusilla Navicula transitans
Thalassiosira pseudonana (3367) Thalassiosira pseudonana (1135) Mie predictions
c
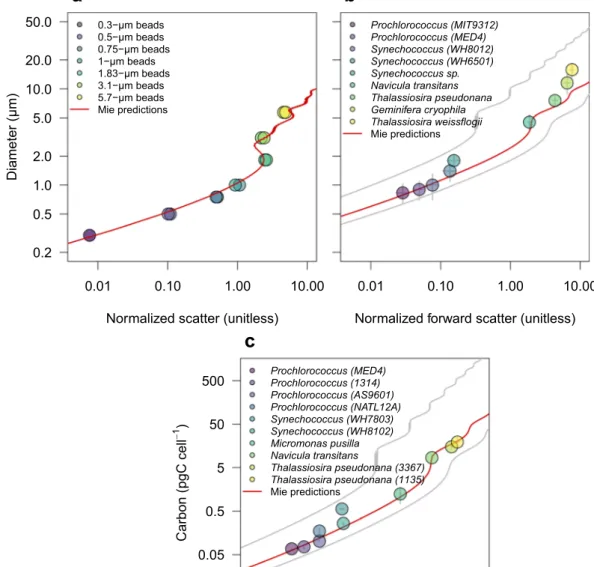
Fig. 4 Calibration of forward scatter measurements. Relationship between forward scatter normalized to 1-μm calibration beads measured by SeaFlow and (a) diameter of calibration beads, (b) equivalent spherical diameter of phytoplankton cultures and (c) carbon quotas estimated with independent methods. Diameters of calibration beads were provided by the manufacturer while diameters of phytoplankton type were from electronic particle counter measurements; carbon quotas was determined by bulk measurements of particulate carbon normalized by cell number. Red lines represent Mie-based predictions using a refractive index of 1.60 (a) or 1.38 (b,c) and 1.35 and 1.41 for grey lines, relative to the refractive index of seawater (1.34).
Data Records
The dataset is a compilation of data assembled from different research cruises conducted since 2010. Each data record represents the cell abundance, median, 25% and 75% percentile of optical properties (chlorophyll and phycoerythrin fluorescence, forward scatter), ESD and carbon quotas for each population estimated at a certain point in space and time. Each data record belongs to a cruise, with cruise identification retrieved from the Rolling Deck to Repository, and is linked to its associated metadata such as time, location, depth, sea surface temperature and salinity, and PAR. Online-only Table 1 lists the variables, their definition and units. The dataset is accessible as a.csv file through Zenodo open access research data repository13.
Technical Validation
Equivalent spherical diameter and carbon quotas.
The optimized Mie theory was applied to SeaFlow- based scattering measurements of calibration beads of known refractive index (1.60) and diameter (0.3, 0.5, 0.75, 1, 1.83, 3.1 and 5.7 μm). Mie-predicted bead diameters were in good agreement with diameters provided by the manufacturer (R2 = 0.98, p < 0.0001) (Fig. 4a).To evaluate the applicability of Mie-predicted cell diameters to phytoplankton cells, a Coulter Counter Multisizer equipped with a 15-μm and 30-μm orifice was used to measure cell diameters of axenic, exponen- tially growing cyanobacteria (Prochlorococcus MIT9312 and MED4, Synechococcus WH8012, WH6501 and sp.) and eukaryotic phytoplankton (the diatoms Navicula transitans, Thalassiosira pseudonana, Thalassiosira weiss- flogii and the crytophyte Geminifera cryophila) under non-limiting light conditions (150 μmol quanta m−2 s−1).
These independent measurements were then compared to the equivalent spherical diameter derived from the Mie-based lookup table. The Mie-predicted ESD using the mid-range refractive index for phytoplankton (1.38) was in good agreement with observations (R2= 0.96, p < 0.0001), however discrepancies were observed for the diameter of the larger phytoplankter T. weissflogii), suggesting a higher refractive index for this organism.
A second set of experiments was conducted to compare measurements of carbon quotas with those estimated from Mie-predicted ESD. Carbon per cell was determined for 6 axenic cyanobacteria cultures (Prochlorococcus MED4, MIT9312, AS9601 and NATL12A, Synechococcus WH7803 and WH8012) and 4 different eukaryotic phytoplankton cultures (Micromonas pusilla, Navicula transitans, T. pseudonana 3367 and 1135). Particulate C and N collected on pre-combusted 0.3-μm GF-75 or 0.7-μm GF/F filters were analyzed on a Carlo Erba CHNS analyzer (model NA1500) in the Oregon State University Stable Isotope Laboratory using cystine (29.99% C and 11.66% N by weight) as the primary standard. For each culture, aliquots of growth media filtered through three pre-combusted GF-75 and GF/F glass fiber filters were used as blanks to correct for background carbon concen- tration on filters before filtration and DOC adsorption onto filters. Carbon quotas were obtained by normalizing the concentrations of blank-corrected particulate carbon to cell abundance measured with a BD Influx cell sorter.
Mie-predicted ESD based on light scatter measurements from SeaFlow was converted to carbon quotas using the equation fgC cell−1= 0.261 × Volume0.86011, assuming spherical particles. We found that carbon quotas were in good agreement with our light scatter-based estimates using a refractive index for phytoplankton of 1.38 (Fig. 4c) (R2= 0.96, p < 0.0001), consistent with our ESD results (Fig. 4b).
Fig. 5 Comparison of cell counts. (a) Abundances of eukaryotic phytoplankton (picoeuk) Prochlorococcus (prochloro), Synechococcus (synecho) obtained with SeaFlow were compared with those obtained with a BD Influx flow cytometer. Samples analyzed with the Influx were collected from Niskin bottles and fixed with electron grade glutaraldehyde at a 0.25% final concentration while samples analyzed by the SeaFlow were collected from the ship’s underway system and were not fixed. The linear regression (red line, slope = 0.91), coefficient of correlation (R = 0.92), number of observations (n), and dashed line representing the 1:1 slope are shown. (b) Frequency distribution of percent discrepancy in abundance estimates between the two instruments, dashed lines representing the 25% discrepancy.
Cell abundances.
The abundance of cells within a given phytoplankton population is dependent on the ratio of OPP to the total detected particles8. While a single linear regression was previously used to discriminate OPP8, here we applied the combination of two linear regression models, which better defined the relationship between forward light scatter and the position-sensitive detectors (Fig. 3) for particles less than or greater than 1 μm in ESD. We compared the resulting SeaFlow-based cell abundances of Prochlorococcus, Synechococcus and eukaryotic phytoplankton (<5 μm in ESD) with fixed samples collected concurrently on 17 cruises (n = 201) and measured on a BD Influx Cytometer. Particle counts for the three phytoplankton groups were in good agreement between the two instruments (R = 0.92, n = 603, slope of the regression line = 0.91) (Fig. 5), with 74% of the estimates (444/603) showing less than a 2-fold difference. 3% (17/603) of the estimates showed 1–2 order of mag- nitude difference, likely reflecting natural variability rather than instrument counting error.Code availability
Raw SeaFlow data are analyzed using our custom R package available on Github at https://github.com/
armbrustlab/popcycle. The repository also includes a tutorial on the use of the software. Additional Github repositories are available for the virtual-core calibration, conversion of light scattering to cell size and conversion of light scattering to carbon quotas.
Received: 12 June 2019; Accepted: 25 October 2019;
Published: xx xx xxxx
References
1. Falkowski, P., Barber, R. & Smetacek, V. Biogeochemical Controls and Feedbacks on Ocean Primary Production. Science 281, 200–206, https://doi.org/10.1126/science.281.5374.200 (1998).
2. Finkel, Z. V. et al. Phytoplankton in a changing world: cell size and elemental stoichiometry. Journal of Plankton Research 32, 119–137, https://doi.org/10.1093/plankt/fbp098 (2010).
3. Raven, J. A. The twelfth Tansley Lecture. Small is beautiful: the picophytoplankton. Functional Ecology 12, 503–513, https://doi.
org/10.1046/j.1365-2435.1998.00233.x (1998).
4. Bonnet, S., Biegala, I. C., Dutrieux, P., Slemons, L. O. & Capone, D. G. Nitrogen fixation in the western equatorial Pacific: Rates, diazotrophic cyanobacterial size class distribution, and biogeochemical significance. Global Biogeochemical Cycles 23, 1–13, https://
doi.org/10.1029/2008GB003439 (2009).
5. Flombaum, P. et al. Present and future global distributions of the marine Cyanobacteria Prochlrococcus and Synechococcus.
Proceedings of the National Academy of Sciences 110, 9824–9829, https://doi.org/10.1073/pnas.1307701110 (2013).
6. Buitenhuis, E. T. et al. Picophytoplankton biomass distribution in the global ocean. Earth System Science Data 5, 221–242, https://
doi.org/10.5194/essd-4-37-2012 (2012).
7. Gérikas Ribeiro, C., Marie, D., L. dos Santos, A., Pereira Brandini, F. & Vaulot, D. Estimating microbial populations by flow cytometry: Comparison between instruments. Limnology and Oceanography: Methods 14, 750–758, https://doi.org/10.1002/
lom3.10135 (2016).
8. Swalwell, J., Ribalet, F. & Armbrust, E. Seaflow: A novel underway flow cytometer for continuous observations of phytoplankton in the ocean. Limnology and Oceanography: Methods 9, 466–477, https://doi.org/10.4319/lom.2011.9.466 (2011).
9. Malek, M. et al. Flow Density: reproducing manual gating of flow cytometry data by automated density-based cell population identification. Bioinformatics 31, 606–607, https://doi.org/10.1093/bioinformatics/btu677 (2015).
10. Menden-Deuer, S. & Lessard, E. J. Carbon to volume relationships for dinoflagellates, diatoms, and other protist plankton. Limnology and Oceanography 45, 569–579 (2000).
11. Lehmuskero, A., Skogen Chauton, M. & Boström, T. Light and photosynthetic microalgae: A review of cellular- and molecular-scale optical processes. Progress in Oceanography 168, 43–56, https://doi.org/10.1016/j.pocean.2018.09.002 (2018).
12. Glover, D. M., Jenkins, W. J. & Doney, S. C. Modeling methods for marine science, https://doi.org/10.1017/CBO9780511975721 (Cambridge University Press 2011).
13. Ribalet, F. et al. SeaFlow data v1: High-resolution abundance, size and biomass of small phytoplankton in the North Pacific. Zenodo, https://doi.org/10.5281/zenodo.2678021 (2019).
Acknowledgements
We thank the officers, crew and chief scientists aboard the research vessels Kaimikai O. Kanaloa, Kilo Moana, T.G. Thompson and Western Flyer for their assistance during the cruises. We thank Tara Clemente, Edward F.
Delong, David M. Karl and the SCOPE operation team for supporting SeaFlow deployment and data collection on HOT cruises, funded partially by the Simons Foundation (#329108 to E.F.D. and D.M.K.). We thank Erin Horn, John MacMillan and Rhonda Morales for processing flow cytometry samples, Megan Schatz and Camilo Perez for processing electronic particle counter samples and Katie Watkins-Brandt for processing particulate organic carbon samples. We also thank Alexandra Worden for her support of C.P. and SeaFlow deployment on cruises in the eastern California Current funded by MBARI and the Gordon and Betty Moore Foundation grant (#3788 to A.W.). S.C. was funded by a Moore/Sloan Data Science and Washington Research Foundation Innovation in Data Science postdoctoral fellowship. This work was supported by grants from the Simons Foundation (#574495 to F.R.,
#329108 to E.V.A. and A.E.W. and #426570SP and #549894 to E.V.A.), the Gordon and Betty Moore Foundation (#3776 to E.V.A.) and the National Aeronautics and Space Administration (#80NSSC17K0561 to F.R.).
Author contributions
F.R. managed the project, contributed to data collection, particle classification, quality control, light scatter calibration, carbon conversion and wrote the manuscript with contributions from all authors. C.B. contributed to the software and database design, dataset organization, OPP filtration. A.H. contributed to data collection, particle classification and quality control. J.S. coordinated instrument deployment, contributed to data collection and OPP filtration, and advised light scatter calibration. M.C. contributed by providing independent estimates of cell abundances. S.C. contributed to data collection and OPP filtration. G.H. contributed to data collection and by providing independent estimates of cell abundances. C.P. contributed by providing independent estimates of
cell abundances. E.S. contributed to data collection and by providing independent estimates of cell abundances.
A.E.W. contributed by providing independent estimates of carbon quotas. E.V.A. supervised the project.
Competing interests
The authors declare no competing interests.
Additional information
Correspondence and requests for materials should be addressed to F.R.
Reprints and permissions information is available at www.nature.com/reprints.
Publisher’s note Springer Nature remains neutral with regard to jurisdictional claims in published maps and institutional affiliations.
Open Access This article is licensed under a Creative Commons Attribution 4.0 International License, which permits use, sharing, adaptation, distribution and reproduction in any medium or format, as long as you give appropriate credit to the original author(s) and the source, provide a link to the Cre- ative Commons license, and indicate if changes were made. The images or other third party material in this article are included in the article’s Creative Commons license, unless indicated otherwise in a credit line to the material. If material is not included in the article’s Creative Commons license and your intended use is not per- mitted by statutory regulation or exceeds the permitted use, you will need to obtain permission directly from the copyright holder. To view a copy of this license, visit http://creativecommons.org/licenses/by/4.0/.
The Creative Commons Public Domain Dedication waiver http://creativecommons.org/publicdomain/zero/1.0/
applies to the metadata files associated with this article.
© The Author(s) 2019