https://doi.org/10.1007/s00300-021-02840-5 ORIGINAL PAPER
Pelagic deep‑sea fauna observed on video transects in the southern Norwegian Sea
Philipp Neitzel1 · Aino Hosia2 · Uwe Piatkowski1 · Henk‑Jan Hoving1
Received: 15 June 2020 / Revised: 24 February 2021 / Accepted: 2 March 2021 / Published online: 22 March 2021
© The Author(s) 2021
Abstract
Observations of the diversity, distribution and abundance of pelagic fauna are absent for many ocean regions in the Atlan- tic, but baseline data are required to detect changes in communities as a result of climate change. Gelatinous fauna are increasingly recognized as vital players in oceanic food webs, but sampling these delicate organisms in nets is challenging.
Underwater (in situ) observations have provided unprecedented insights into mesopelagic communities in particular for abundance and distribution of gelatinous fauna. In September 2018, we performed horizontal video transects (50–1200 m) using the pelagic in situ observation system during a research cruise in the southern Norwegian Sea. Annotation of the video recordings resulted in 12 abundant and 7 rare taxa. Chaetognaths, the trachymedusa Aglantha digitale and appendicularians were the three most abundant taxa. The high numbers of fishes and crustaceans in the upper 100 m was likely the result of vertical migration. Gelatinous zooplankton included ctenophores (lobate ctenophores, Beroe spp., Euplokamis sp., and an undescribed cydippid) as well as calycophoran and physonect siphonophores. We discuss the distributions of these fauna, some of which represent the first record for the Norwegian Sea.
Keywords Norwegian Sea · Zooplankton · Micronekton · Macroplankton · In situ observations · Vertical migration · Aglantha
Introduction
The pelagic ocean is the largest habitat on the planet and houses a high diversity, abundance and biomass of organ- isms. Up to 25% of the pelagic biomass can consist of gelat- inous zooplankton (Robison 2004). Gelatinous organisms mainly consisting of the pelagic Cnidaria, Ctenophora and Tunicata have a variety of different body morphologies and feeding strategies, allowing them to occupy different niches in the oceanic foodweb (Haddock 2004). Pelagic tunicates (thaliaceans and appendicularians) are filter feeders (Holland 2016), while medusae, siphonophores and ctenophores are predators feeding on a wide spectrum of zooplankton includ- ing gelatinous organisms and micronekton (Pagès et al.
2006). Another prominent and widely distributed phylum in the oceanic water column are Chaetognatha, semi-gelati- nous predators that can be among the numerically dominant plankton members of ocean communities (Bone et al. 1991).
Despite their low protein content, gelatinous zooplank- ton are common prey of many marine taxa including fishes, crustaceans, turtles and even some cephalopods (Heeger et al. 1992; Cardona et al. 2012; Hoving and Haddock 2017). The complex trophic interconnections of gelatinous zooplankton in the pelagic foodweb mark their central role within the pelagic ecosystem and their potential importance in the biological carbon pump (Alldredge 2004; Lebrato et al. 2012; Henschke et al. 2013; Sweetman and Chapman 2015). Gelatinous organisms have several traits that may give them an advantage in warmer, deoxygenated waters (Thuesen et al. 2005; Ekau et al. 2010). Although blooms of gelatinous organisms have been occurring for millennia, recent observations have drawn scientific and public inter- est to the question of whether or not the frequency of such blooming events is increasing, e.g. as a result of climate change (Lynam et al. 2011; Brotz et al. 2012; Condon et al.
2012, 2013). Confirming such potential increases requires a
* Henk-Jan Hoving hhoving@geomar.de
1 GEOMAR, Helmholtz Centre for Ocean Research Kiel, Düsternbrooker Weg 20, 24105 Kiel, Germany
2 Department of Natural History, University Museum of Bergen, University of Bergen, P.O. Box 7800, 5020 Bergen, Norway
baseline of species diversity, distribution and abundance of gelatinous organisms.
Fragile gelatinous zooplankton is often damaged or destroyed when sampled with nets, which has led to a sys- tematic underestimation of its abundance and diversity in the ocean, in particular in the deep pelagic. The use of in situ observations (with optical sampling systems) has changed our perspective substantially (Haddock 2004;
Robison 2004). Manned submersibles and remotely oper- ated vehicles (ROVs) allow the observation of fragile gelati- nous zooplankton in their natural habitat. Midwater ocean exploration with these vehicles has led to the discovery of new gelatinous species and records (e.g. Matsumoto and Robison 1992; Hoving et al. 2018), the documentation of their behaviour (Robison et al. 2017) and the provision of novel information on the trophic interactions in the deep- sea ‘jelly web’ (Robison 2004; Choy et al. 2017; Hoving and Haddock 2017). Although submersibles and ROVs can provide detailed images and video material of large deep pelagic fauna and allow faunal collections (Robison 2004), they are also challenging and costly to operate. To allow cost-effective pelagic video transects comparable to ROV video transects, the pelagic in situ observation sys- tem (PELAGIOS) was developed (Hoving et al. 2019). The PELAGIOS is a camera platform that collects concomitant environmental data while towed horizontally at desired depths. The annotation of the high definition video results in diversity, distribution and abundance data of slow-swim- ming pelagic fauna larger than 1 cm. To establish a baseline of pelagic fauna distribution and abundance, and to iden- tify potential important contributors (e.g. medusae, squids, larvaceans) to the biological carbon pump, we performed
deep-sea pelagic video transects with PELAGIOS in the southern Norwegian Sea.
Material and methods
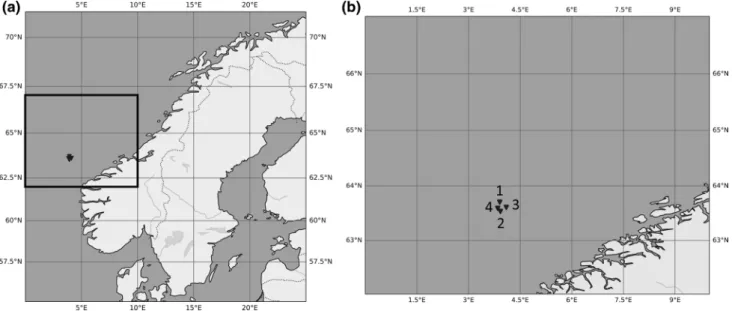
During a research cruise on R/V Heincke in September 2018 in the southern Norwegian Sea, we deployed the pelagic in situ observation system (PELAGIOS) four times to per- form horizontal pelagic video transects (Fig. 1; Table 1).
The PELAGIOS is a battery powered towed camera plat- form with a high definition camera (type 1Cam Alpha, SubC Imaging), forward LED illumination, a CTD (SBE 19 Sea- CAT, Sea-Bird Scientific) and a telemetry (DST-6, Sea and Sun Technology; Linke et al. 2015) that transmits data and video preview via the CTD conducting cable to the deck unit (Hoving et al. 2019). The PELAGIOS was towed over the side of the ship on the CTD conducting cable at approxi- mately 1 knot (0.51 m/s) speed over ground. The desired towing depth for the pelagic video transect was reached by paying out CTD wire while monitoring the depth from the CTD. The duration of one complete PELAGIOS deployment was between 3 h 11 min and 3 h 28 min, and at each depth we towed for approximately 6.5–23.3 min (Tables 1 and 2).
Horizontal video transects were performed at specific depths between 50 and 1200 m (Table 2) and from 16:00 to 20:00 UTC (Table 1). We started with the deepest transect and ended shallow on Station_1. At all other stations we started shallow and ended with the deepest transect (Table 2).
Hydrography of the water column was reconstructed by per- forming a vertical cast with an onboard SBE CTD (Fig. 2).
Fig. 1 a The study area in the Norwegian Sea and b the four locations where PELAGIOS deployments were performed during HE518 indicated by black triangles
The HD video was annotated using the Video Annotation and Reference System (VARS) developed by the Monterey Bay Aquarium Research Institute (MBARI) (Schlining and Jacobsen Stout 2006). Recorded organisms larger than 1 cm in diameter were annotated and identified to the lowest pos- sible taxonomic classification. Organisms observed while PELAGIOS was ascending or descending between tran- sects were annotated but not considered in our data analy- sis. After the analysis of the video material the observation data were matched with the depth data and classified with the corresponding transects. This resulted in 15 abundant taxa (Table 3) and additional rare taxa, as well as groupings of unidentifiable organisms due to poor image conditions (Table 4).
To calculate abundances, we divided the absolute number of counts of each taxon per transect by the
corresponding transect duration to obtain the relative abundance of taxa in individuals per time unit. To calcu- late the number of individuals per unit volume, we used faunal observations from simultaneous deployments of the PELAGIOS and a Underwater Vision Profiler (UVP5) together (Hoving et al. 2019). The UVP5 samples a fixed volume enabling a back calculation of the sampled volume of PELAGIOS during the same transect. This resulted in a conversion factor of 6. This factor is based on pelagic worms of the genus Poeobius (0.8–1.5 cm), which are poor swimmers and were observed clearly by both UVP5 and PELAGIOS (Christiansen et al. 2018; Hoving et al. 2019).
The conversion factor may change when considering larger animals that can be seen from further away (Reisenbichler
Table 1 Stations with
PELAGIOS deployments during the cruise HE518 in September 2018
The HE518_number refers to the cruise station list
Station Date Latitude (N) Longitude (E) Start (UTC) Stop (UTC) Sunset (UTC + Daylight Saving Time) Sation_1
HE518_5-1 2018-09-09 63.7059 3.90709 16:07:00 19:46:00 19:31:00 Station_2
HE518_11-1 2018-09-10 63.5343 3.92559 16:28:00 19:50:00 19:31:00 Station_3
HE518_17_1 2018-09-11 63.6097 4.09736 16:37:00 19:55:00 19:23:00 Station_4
HE518_28-1 2018-09-14 63.59188 3.84858 16:19:00 19:30:00 19:14:00
Table 2 Overview of the transect depths targeted at each station by PELAGIOS
The ‘/’ marks absence of a pelagic video transect Depth [m] Transect length [min:sec]
Station_1 Station_2 Station_3 Station_4
50 11:20 15:47 / /
75 9:43 / / /
100 / 11:54 10:35 /
200 / 12:44 13:49 11:39
300 / 12:52 9:41 10:01
400 / 13:19 16:20 10:24
500 6:35 10:47 17:05 10:31
600 7:46 19:27 14:44 20:29
700 20:34 18:25 18:00 20:17
800 20:10 17:52 15:02 20:10
850 / / / 14:29
900 16:59 / 15:12 6:51
1000 15:23 / / 23:20
1100 18:42 / / /
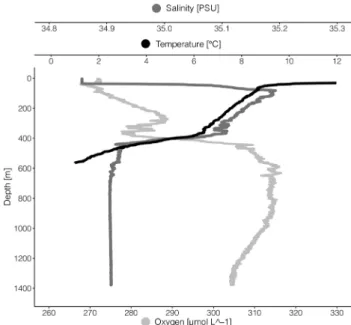
1200 17:59 / / / Fig. 2 Vertical profiles of temperature, salinity, dissolved oxygen and density from the surface to 1350 m depth. The CTD-cast was per- formed at the 15th of September 2018 at 06:58 UTC at 63°35′24 N and 3°57′26 E. Temperature data below 580 m was not available
et al. 2016) or due to the consistency and transparency of the organisms affecting their visibility.
All graphs besides the map were produced in R version 3.6.1. The map was made with python and the packages matplotlib and cartopy.
Differences between stations were analyzed by calculat- ing the weighted mean depth for each station as well as an overall weighted mean for each of the 15 most abundant taxa (Latasa et al. 2017).
Results
HydrographyThe hydrography was typical for the studied region (Blind- heim and Rey 2004). The upper < 50 m were influenced by the Norwegian Coastal Current (NCC), with a salinity well below 34.9 and temperatures > 12 °C (Fig. 2). Below
Table 3 Weighted mean depth (m) of the 12 most abundant taxa and 3 rare taxa (Beroe, Bolinopsis and white Cydippida) encountered by PELAGIOS, at each station and the overall weighted mean with standard deviation (SD)
Observation Station Mean ± SD
1 2 3 4
Actinopteri 80.9 122.5 239.4 320 190.7 ± 94.6
Euphausiacea 112.7 290.5 509.1 597.2 377.4 ± 189.3
Decapoda & Mysida 989.2 665.9 797.7 840.8 823.4 ± 115.4
Chaetognatha 757 555.4 668.8 689.3 667.6 ± 72.6
Appendicularia 896.5 657.5 643.7 800 749.4 ± 104.6
Clione 69.8 50 Absent 600 239.9 ± 254.7
Aglantha 765.9 582.6 754.9 770.5 718.5 ± 78.6
Diphyidae 75 99.9 108.7 200 120.9 ± 47.3
Other Calycophorae 598.2 391.8 516.2 496.6 500.7 ± 73.5
Physonect Deep-type 1036.4 777.5 900 908.1 905.5 ± 91.6
Other Physonectae 90.8 241.4 284.1 337 238.3 ± 91.7
Beroe 913 406.1 603.3 600 630.6 ± 181.5
Bolinopsis 800 412.3 610 650.2 618.1 ± 138.3
Euplokamis 187.2 360.4 448.6 485.6 370.5 ± 115.1
White Cydippida 1120.1 750.8 645 1000 879 ± 189.7
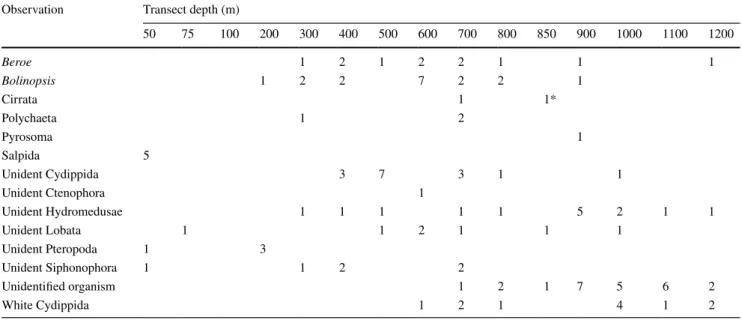
Table 4 Pooled counts per transect depths of the rare taxa Cirrata, Polychaeta, Pyrosomatida and Salpida
Unidentified Hydromedusae other than Aglantha digitale, as well as Ctenophora and Siphonophora not identifiable to a lower taxon 1*The observation of this cirrate octopod was not made during a transect, but during a descend phase in between a 800 and a 900 m transect Observation Transect depth (m)
50 75 100 200 300 400 500 600 700 800 850 900 1000 1100 1200
Beroe 1 2 1 2 2 1 1 1
Bolinopsis 1 2 2 7 2 2 1
Cirrata 1 1*
Polychaeta 1 2
Pyrosoma 1
Salpida 5
Unident Cydippida 3 7 3 1 1
Unident Ctenophora 1
Unident Hydromedusae 1 1 1 1 1 5 2 1 1
Unident Lobata 1 1 2 1 1 1
Unident Pteropoda 1 3
Unident Siphonophora 1 1 2 2
Unidentified organism 1 2 1 7 5 6 2
White Cydippida 1 2 1 4 1 2
the NCC, the salinity increased to > 35, indicating a layer of Atlantic Water (AW) extending down to ~ 400 m. At around 400 m, the salinity rapidly dropped to ~ 34.92 with a minor salinity minimum close to 450 m, and there was a simultaneous increase in oxygen concentration mov- ing from AW to intermediate water. Temperature stead- ily declined from 5 to 0 °C between ~ 400 and 600 m.
We expect that below the intermediate water masses and deeper than ~ 600 m Norwegian Sea Deep Water (NSDW) was found. This water mass is characterized by tempera- tures below 0 °C and a salinity of ~ 34.91. Unfortunately, temperature data below 580 m were corrupted.
Fauna
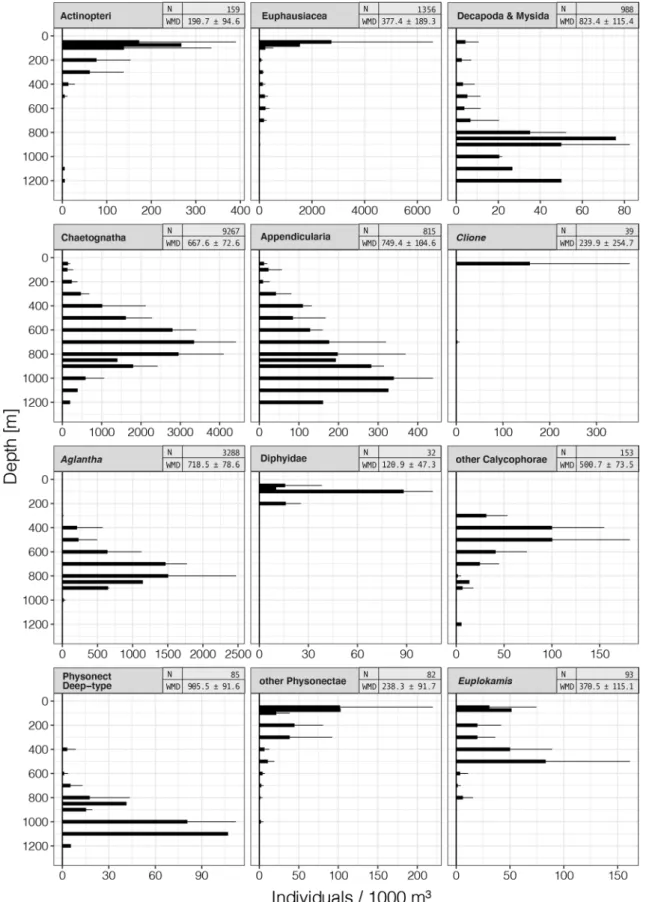
The video transects revealed 26 different taxa; fifteen abun- dant taxa (Table 3) and seven rare and seven unidentified taxa (Table 4). At all four sampling sites, the transects at 500, 600, 700 and 800 m depth had the highest animal abundances. Chaetognatha, which showed their highest abundances in these depths, dominated all transects with 68.8, 67.0, 63.0, and 64.6% of all annotations (Station_1 to Station_4, respectively) (Fig. 3). The small trachymedusa Aglantha digitale had its distribution peak between 500 and 800 m (Figs. 3 and 4) and accounted for 25.2, 22.4, 27.6 and 24.7% of all annotations (Station_1 to Station_4, respec- tively) and was the second most abundant taxon encountered in all transects. Appendicularians, crustaceans, ctenophores and siphonophores combined contributed about 10% of the observations between 500 and 800 m at Stations 2, 3 and 4, and less than 6% of the observations at Station_1.
The 12 most abundant taxa differed in their vertical dis- tribution patterns (Fig. 3). Non-gelatinous taxonomic groups included Actinopteri (ray-finned fishes), Decapoda and Mysida (jointly called shrimps, because distinction between the taxa was not possible on the videos), Euphausiacea (krill) and the semi-gelatinous Chaetognatha (arrow worms).
Highest Actinopteri abundances were observed in the upper 100 m with a maximum of 267.6 ind 1000 m−3 at 75 m at Station_1, and abundances decreased with depth. Shrimps were observed at all stations and throughout the entire sam- pling depth range, but increased in numbers below 700 m, with a maximum of 76 ind 1000 m−3 at the single tran- sect at 850 m depth at Station_4. A secondary abundance peak was observed at the deepest transect of 1200 m with 50.1 ind 1000 m−3 at Station_1. Euphausiacea were also observed at all stations and at every sampled depth, except at 1200 m. Their highest abundances were observed at 50 m depth at Station_1 with 5461.8 ind 1000 m−3. Below 100 m, the abundance of Euphausiacea decreased by approximately one order of magnitude, and below 800 m depth by another order of magnitude.
Appendicularians were present throughout the sam- pled depth range with the exception of the 75 m tran- sect at Station_1. Their numbers showed a continuous increase with depth, and peaked at 1000 m depth with 339.8 ind 1000 m−3 (mean, sd = 98.7). Chaetognaths were dominant between 200 and 1000 m. They were observed throughout the whole depth range (Fig. 3), and their ver- tical distribution pattern showed a normal distribution around an abundance peak at 700 m depth with 3350.5 ind 1000 m−3 (mean, sd = 1063.3). The highest numbers of pteropods of the genus Clione (157.6 ind 1000 m−3
; mean, sd = 213.9) occurred at 50 m depth, but these mollusks were also present at 600 and 700 m. The tra- chymedusa Aglantha digitale was present between 50 and 1000 m depth but absent from the 75, 100 and 200 m transects (Figs. 3 and 4). Their highest abundance was observed at 800 m depth with 1507 ind 1000 m−3 (mean, sd = 963.5), and below 850 m depth the abun- dance decreased sharply. After chaetognaths, A. digitale was the second most abundant taxon. Small, unidenti- fied calycophoran siphonophores were grouped together as ‘other Calycophorae’ and occurred between 300 and 1200 m depth. They were more abundant in the upper half of their distributional range and their peak abundance was 100.5 ind 1000 m−3 (mean, sd = 81.1) at 500 m depth.
Calycophoran siphonophores of the family Diphyidae were restricted in their vertical distribution to the upper 200 m. They had their highest abundance at 100 m depth with 88.2 ind 1000 m−3 (mean, sd = 17.9). A group of physonect siphonophores with a similar morphology, but which could not be identified to species, were grouped as ‘Physonect Deep-type’ (Fig. 3). These siphonophores occurred from 400 to 1200 m depth, but the major- ity of specimens were observed at 1100 m depth with 107 ind 1000 m−3 at Station_1. Physonect siphonophores other than the ‘Physonect Deep-type’ were observed from 50 to 800 m as well as at 1000 m. Their abun- dance decreased with depth after a peak at 75 m (102.9 ind 1000 m−3) at Station_1. Beroe spp. ctenophores were observed in low numbers from 300 to 1200 m depth.
The maximum abundance was 6.6 ind 1000 m−3 (mean, sd = 6.2) at 400 m depth. Some of the observed Beroe spp.
could be clearly identified as B. abyssicola based on the conspicuous red coloration of the stomodaeum (Fig. 4).
The habitus of the others points towards the unresolved species complex Beroe cf. cucumis (Bayha et al. 2004;
Mills and Haddock 2007; Johansson et al. 2018), suggest- ing the presence of at least two species of Beroe in the study area. The lobate ctenophore Bolinopsis (Bolinopsis sp. or Bolinopsis infundibulum) was observed from 200 to 900 m depth. The maximum abundance of Bolinopsis was at 600 m with 10.1 ind 1000 m−3 (mean, sd = 8.3).
The cydippid ctenophore Euplokamis sp. was observed
Fig. 3 Vertical distribution profiles of the 15 observed major taxa, with the extrapolated number of specimens per 1000 m3 on the hori- zontal axes and the water depth on the vertical axes. Columns show the mean abundances across all 4 sampling sites, with the standard
deviation (sd) as error bars. The header of the single plots gives the taxon, the weighted mean depth (WMD) and the total number of counts for each taxon (N). The shallowest transect was conducted at 50 m depth, the deepest at 1200 m depth
at 50, 75 and from 200 to 800 m depth (Figs. 3 and 4).
Their maximum abundance was 83.2 ind 1000 m−3 (mean, sd = 78.2) at 500 m depth. An undescribed white cydip- pid (Hosia and Båmstedt 2007) was observed from 600 to 800 m and from 1000 to1200 m depth (Figs. 3 and 4). Their highest abundance of 11.1 ind 1000 m−3 was observed during the deepest transect at 1200 m depth.
Fourteen groups of organisms were observed in low numbers, including unidentifiable ctenophores, siphono- phores, and hydromedusae, pelagic tunicates, polychaetes and cirrate octopods (Fig. 4; Table 4).
Discussion
Our observations included 12 abundant, seven rare, and seven unidentified pelagic taxa. The numerically domi- nant group were chaetognaths, followed by the small trachymedusa Aglantha digitale, both predators on other zooplankton. Filter feeding appendicularians were the third most abundant group. Crustaceans, which we divided into krill (Euphausiacea) and shrimps (Decapoda and Mysida), occurred at high densities at specific depth
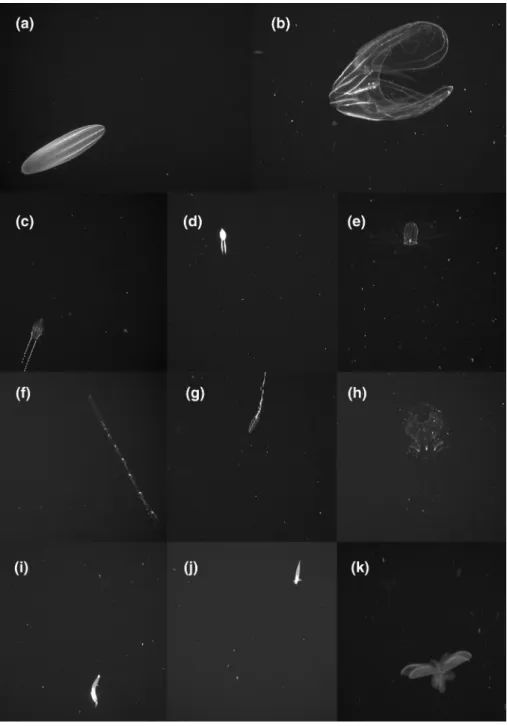
Fig. 4 Frame-grabs of Norwe- gian pelagic fauna from videos recorded with PELAGIOS.
From top left to bottom right the rows show the following taxa:
a Beroe abyssicola. ~ 40 mm (Johansson et al. 2018); b lobate ctenophore Bolinopsis sp. 40 mm (Nagabhushanam 1959); c cydippid ctenophore Euplokamis sp. ~ 10 mm (Granhag et al. 2012); d undescribed white cydippid;
e Aglantha digitale ~ 10 mm (Hosia and Båmstedt 2007);
f Physonect siphonophore;
g Physonect Deep-type; h Appendicularian; i Chaetogna- tha ~ 40 mm (Falkenhaug 1991);
j Clione sp. ~ 20 mm (Satterlie et al. 1985); k cirrate octopod
layers. Omnivorous krill were the dominant organisms in the uppermost 50, 75 and 100 m transects, whereas larger shrimps were most abundant much deeper, between 800 and 900 m depth.
The major faunal components consisting of ray-finned fishes, euphausiids, shrimps, hydrozoans, ctenophores, chaetognaths and appendicularians, as well as the overall pelagic diversity and abundance, are in line with previous observations in the North Atlantic, where optical sampling was performed using ROV and UVP (Vinogradov 2005;
Stemmann et al. 2008).
Our in situ video observations are generally limited to organisms that are > ~ 1 cm in size, and often do not show sufficient taxonomic characteristics required for identifica- tion to species level. Pelagic net surveys provide a higher taxonomic resolution for crustaceans and ray-finned fishes (Piatkowski et al. 1994), as well as for the hydrozoan gelati- nous fauna (Hosia et al. 2008, 2017), but catch efficiency may be low. On the other hand, optical sampling like per- formed in our study does reveal fauna poorly sampled by nets, ctenophores and appendicularians in particular, and provides unique data on the detailed vertical and horizontal distribution of fragile organisms (Hosia et al. 2017). The diversity of gelatinous fauna in the Norwegian Sea remains poorly studied, and more detailed faunistic studies would probably reveal new records of hydrozoans and ctenophores for Norwegian waters. In this study, significant numbers of the cydippid ctenophore Euplokamis sp. (n = 93) were documented for the first time in the southern Norwegian Sea. These ctenophores were readily identified to genus due to the characteristically coiled tentilla, resembling droplets along the tentacles (Fig. 2). There are few published records of Euplokamis sp. from Norwegian waters, but it is reported to occur in western Norwegian fjords (Granhag et al. 2012), and has been observed in the Norwegian /Icelandic Sea (Licandro et al. 2015), and near Svalbard (Majaneva and Majaneva 2013). First records of Euplokamis sp. in Swed- ish waters were reported for the Gullmar Fjord on the west coast (Granhag et al. 2012). Euplokamis may thus be pre- sent throughout the Norwegian shelf from the Skagerrak to Svalbard.
The other, yet undescribed, white cydippid ctenophore, similar to an undescribed horned cydippid with highly exten- sile tentacles (Hosia and Båmstedt 2007), was only observed below 600 m depth, with highest densities at the 1200 m transect at Station_1. This suggests that the vertical distribu- tion was not completely sampled, and that the undescribed cydippid is a lower meso- and bathypelagic species with a distribution extending below our sampling range.
Several taxa appeared to be associated with specific water masses. Shrimps were primarily found in NSDW below 600 m. The undescribed white cydippid and the siphono- phore that we referred to as the ‘Physonect Deep-type’ also
appeared mostly restricted to these deeper waters. Of the numerically dominant groups, both chaetognaths and Aglan- tha digitale had their peak abundances below 600 m depth, in the NSDW. A. digitale was virtually absent from AW, while chaetognaths also extended their distribution to the upper 400 m, perhaps due to this taxon including several species of varying affinity to the different water masses.
Euphausiacea, Clione and diphyid siphonophores were pri- marily observed in the upper AW. Other calycophorans and Euplokamis sp. were particularly abundant in the intermedi- ate waters, but also occurred, to a lesser extent, in the water masses above and below.
Appendicularians were a common group, increasing in abundance with depth throughout the mesopelagic zone.
Abundant appendicularians in mesopelagic waters are also reported from other oceanic regions, but are relatively poorly studied (Stemmann et al. 2008). The role of appendicular- ians in mesopelagic food webs and in vertical flux is never- theless of high interest. Not only are appendicularians able to feed on particles down to bacterial size range, thus short circuiting the “normal” pelagic food chain (Robinson et al.
2010), but their discarded houses are a major contributor of marine snow particles and vertical flux of carbon (Robison et al. 2005; De La Rocha and Passow 2007).
For some of the observed taxa, potential diel vertical migration (DVM) must also be considered. While relatively detailed, our vertical distribution data only provide a tempo- ral snapshot. Ray-finned fishes, krill, shrimps and physonect siphonophores are known daily vertical migrators (Barham 1966; Piatkowski et al. 1994; Frank and Widder 2002), and their observed distributions in the upper layers may have been indicative of these taxa migrating towards the surface as sunset was approaching. While our data do not provide information on diel changes in the vertical distribution of the observed taxa, deployments were more or less consist- ent in their timing with respect to the sunset and, thus, the expected stage of DVM. As DVM of many taxa is likely controlled by the ambient light environment (e.g. Norheim et al. 2016), between-day variation may nevertheless have be caused by differences in cloud cover. However, the signifi- cant differences found in the distribution of ray-finned fishes were likely caused by the fact that we started the transects in deep waters during the first station, while we started the later stations in shallow waters.
When considering the observed depth distributions and extrapolated abundances, the total number of observations should be taken into account. These data are much more uncertain for the less frequent taxa. Also, the deepest layers at 1000 m or below only had 1–2 transects per depth, pre- venting comparisons between sites and general conclusions.
Due to the relatively coarse taxonomic resolution of the data, many of the taxa are also likely to contain several spe- cies, with potentially different environmental preferences,
ecological niches and behaviour. For example, three spe- cies of krill are common and abundant in the Norwegian Sea: Meganyctiphanes norvegica, Thysanoessa inermis and Thysanoessa longicaudata (Melle et al. 2004). In our data, these and other similar organisms were lumped.
Comparing abundance estimates obtained by different studies is challenging, as they may be affected by a variety of factors including e.g. the sampling methods, interannual and geographical variation, as well as diurnal and/or sea- sonal changes in abundance and distribution of the target taxa. With these caveats in mind, we can make some com- parisons to published data for our most abundant groups.
Vertical distributions of chaetognaths in the Norwegian and Greenland Seas have been studied in November 1995 using a Multinet, a multiple plankton net (Dale et al. 1999). The results are surprisingly similar to ours, with maximum den- sities of 3–4 chaetognaths m−3 observed between 400 and 800 m depth. For Aglantha digitale, ROV vertical profiles—
a method comparable to ours in that it is limited to observ- ing organisms larger than 1 cm in size—from Norwegian fjords in October and May 2004–2005 show peaks of up to ~ 3 adult individuals m−3 at around 300 m depth (Hosia and Båmstedt 2007). These results are also of the same order of magnitude as ours, although the exact depth of the peak abundance differs, perhaps due to local hydrography. The abundance estimates of chaetognaths and A. digitale may be realistic because the size of these organisms is similar to the Poeobius polychaete that was used for estimating sam- pling volume of PELAGIOS (Hoving et al. 2019). Estimat- ing abundance of larger fauna requires further calibration efforts of PELAGIOS as larger fauna may be detected when they are further away from the camera compared to smaller organisms (Reisenbichler et al. 2016).
Our results may to a degree be influenced by attraction or avoidance responses elicited by the PELAGIOS. Such responses could result from the hydrodynamic disturbance caused by the gear, as well as the light. It is known that certain taxa such as ray-finned fishes, krill and decapods, respond to underwater instruments (Stoner et al. 2008).
Underestimation of observations may influence our esti- mates of myctophid and other mesopelagic fishes as they are known to avoid lights and trawls (Kaartvedt et al. 2012). On the other hand, overestimation of abundance may be caused by organisms being attracted towards lights or the instrument itself, as has been reported for other organisms including krill and some ray-finned fishes (e.g. Wiebe et al. 2004; Ray- mond and Widder 2007; Utne-Palm et al. 2018). However, we did not observe highly reactive responses to the lights.
We have noticed the absence of larger nekton. This particularly is relevant to the oegopsid squid Gonatus fabricii, which is widely distributed in the North Atlan- tic and adjacent Arctic seas and is the dominant cephalo- pod in terms of biomass, and a pivotal component in the
food web (Kristensen 1984; Wiborg et al. 1984). Gonatus fabricii is consumed by a variety of apex predators such as various cetaceans and deep-sea fishes (Lick and Piat- kowski 1998; Santos et al. 1999; Bergstad et al. 2010).
It is estimated that sperm whale populations in the north east Atlantic alone consume as much as 1.5 million tons of G. fabricii each year (Bjørke 2001). Our sampling site was chosen because previous studies reported mature and spent females of G. fabricii in the area (Arkhipkin and Bjørke 1999; Bjørke 2001). The absence of G. fabricii could be caused by an avoidance of PELAGIOS result- ing in an escape response before specimens are within the view-field of the camera. It is also possible that the sam- pling volume of the PELAGIOS system and the transects were not sufficient to document the species. However, it should be noted that Gonatus steenstrupi was recorded by ROVs during dives at the northern mid-Atlantic ridge (Vecchione et al. 2010). We furthermore did not observe the coronate medusa Periphylla periphylla, which occurs at high densities in several Norwegian fjord systems (e.g.
Båmstedt et al. 2003), and which is also common in the Norwegian Sea in depths below 200 m (Dalpadado et al.
1998). The absence of P. periphylla could be the result of patchy distribution or by avoidance behaviour.
Our results provide a first overview of the vertical com- position, distribution and abundance of macroplankton in the Norwegian Sea. We show that predatory and, to a lesser degree, filter feeding non-crustacean zooplankton dominate the mesopelagic macroplankton community of the study area. The resultant vertical abundance distribu- tions may be useful for modelling trophic pathways and vertical flux in the mesopelagic. More detailed, net- or ROV-based studies are necessary in order to describe the currently poorly known species level diversity of gelati- nous zooplankton in this region. Additionally, the absence of observations of the abundant squid G. fabricii asks for a more intense sampling program to better understand the biology of this important species.
Acknowledgements We thank the captain and crew of RV HEINCKE for their professional support which allowed the collection of the data presented here. Dr. Steven Haddock and an anonymous referee are thanked for reviewing the manuscript, which improved the quality. HJH is funded by the German Research Foundation (DFG) under grant HO 5569/2-1 (Emmy Noether Junior Research Group).
Author contributions HJH designed the research, HJH and UP applied for funding and organized fieldwork, HJH, UP, AH performed field- work, PN, HJH, AH analyzed video transects, PN analyzed and visual- ized the data, PN, HJH, AH and UP contributed to writing the paper.
Funding Open Access funding enabled and organized by Projekt DEAL. HJH is funded by the DFG under grant HO 5569/2-1 (Emmy Noether Junior Research Group). Shiptime was provided by the DFG.
Data availability https:// doi. org/ 10. 1594/ PANGA EA. 927705.
Declarations
Conflict of interest The authors declare that they have no conflict of interest to disclose.
Open Access This article is licensed under a Creative Commons Attri- bution 4.0 International License, which permits use, sharing, adapta- tion, distribution and reproduction in any medium or format, as long as you give appropriate credit to the original author(s) and the source, provide a link to the Creative Commons licence, and indicate if changes were made. The images or other third party material in this article are included in the article’s Creative Commons licence, unless indicated otherwise in a credit line to the material. If material is not included in the article’s Creative Commons licence and your intended use is not permitted by statutory regulation or exceeds the permitted use, you will need to obtain permission directly from the copyright holder. To view a copy of this licence, visit http:// creat iveco mmons. org/ licen ses/ by/4. 0/.
References
Alldredge A (2004) The contribution of discarded appendicularian houses to the flux of particulate organic carbon from oceanic surface waters. In: Gorsky G, Youngbluth MJ, Deibel D (eds) Response of marine ecosystems to global change: Ecological impact of appendicularians. Éditions des Archives Contempo- raines, Paris, pp 309–326
Arkhipkin AI, Bjørke H (1999) Ontogenetic changes in morphometric and reproductive indices of the squid Gonatus fabricii (Oegop- sida, Gonatidae) in the Norwegian Sea. Polar Biol 22:357–365.
https:// doi. org/ 10. 1007/ s0030 00050 429
Båmstedt U, Kaartvedt S, Youngbluth M (2003) An evaluation of acoustic and video methods to estimate the abundance and verti- cal distribution of jellyfish. J Plankton Res 25:1307–1318. https://
doi. org/ 10. 1093/ plankt/ fbg084
Barham EG (1966) Deep scattering layer migration and composi- tion: observations from a diving saucer. Science 151:1399–1403.
https:// doi. org/ 10. 1126/ scien ce. 151. 3716. 1399
Bayha KM, Harbison GR, Mcdonald JH, Gaffney PM (2004) Prelimi- nary investigation on the molecular systematics of the invasive ctenophore Beroe ovata. Aquatic invasions in the Black, Caspian, and Mediterranean Seas. Dumont H. Kluwer Academic Publish- ers, Dordrecht, pp 167–175
Bergstad OA, Gjelsvik G, Schander C, Høines ÅS (2010) Feeding ecology of Coryphaenoides rupestris from the mid-atlantic ridge.
PLoS ONE 5:1–10. https:// doi. org/ 10. 1371/ journ al. pone. 00104 53 Bjørke H (2001) Predators of the squid Gonatus fabricii (Lichtenstein)
in the Norwegian Sea. Fish Res 52:113–120. https:// doi. org/ 10.
1016/ S0165- 7836(01) 00235-1
Blindheim J, Rey F (2004) Water-mass formation and distribution in the Nordic Seas during the 1990s. ICES J Mar Sci 61:846–863.
https:// doi. org/ 10. 1016/j. icesj ms. 2004. 05. 003
Bone Q, Kapp H, Perrot-Bults AC (eds) (1991) The biology of chae- tognaths. Oxford University Press, Oxford
Brotz L, Cheung WWL, Kleisner K et al (2012) Increasing jellyfish populations: trends in large marine ecosystems. Hydrobiologia 690:3–20. https:// doi. org/ 10. 1007/ s10750- 012- 1039-7
Cardona L, de Quevedo IÁ, Borrell A, Aguilar A (2012) Massive con- sumption of Gelatinous Plankton by Mediterranean Apex Preda- tors. PLoS ONE 7:1–14. https:// doi. org/ 10. 1371/ journ al. pone.
00313 29
Choy CA, Haddock SHD, Robison BH (2017) Deep pelagic food web structure as revealed by in situ feeding observations. Proc R Soc B Biol Sci 284:1–10. https:// doi. org/ 10. 1098/ rspb. 2017. 2116 Christiansen S, Hoving HJT, Schütte F et al (2018) Particulate matter
flux interception in oceanic mesoscale eddies by the polychaete Poeobius sp. Limnol Oceanogr 63:2093–2109. https:// doi. org/ 10.
1002/ lno. 10926
Condon RH, Graham WM, Duarte CM et al (2012) Questioning the Rise of Gelatinous Zooplankton in the World’s Oceans. Biosci- ence 62:160–169. https:// doi. org/ 10. 1525/ bio. 2012. 62.2.9 Condon RH, Duarte CM, Pitt KA et al (2013) Recurrent jellyfish
blooms are a consequence of global oscillations. Proc Natl Acad Sci USA 110:1000–1005. https:// doi. org/ 10. 1073/ pnas. 12109 20110
Dale T, Bagøien E, Melle W, Kaartvedt S (1999) Can predator avoid- ance explain varying overwintering depth of Calanus in different oceanic water masses? Mar Ecol Prog Ser 179:113–121. https://
doi. org/ 10. 3354/ meps1 79113
Dalpadado P, Ellertsen B, Melle W, Skjoldal HR (1998) Summer dis- tribution patterns and biomass estimates of macrozooplankton and micronekton in the nordic seas. Sarsia 83:103–116. https://
doi. org/ 10. 1080/ 00364 827. 1998. 10413 676
De La Rocha CL, Passow U (2007) Factors influencing the sinking of POC and the efficiency of the biological carbon pump. Deep Res II 54:639–658. https:// doi. org/ 10. 1016/j. dsr2. 2007. 01. 004 Ekau W, Auel H, Pörtner H-O, Gilbert D (2010) Impacts of hypoxia
on the structure and processes in pelagic communities (zoo- plankton, macro-invertebrates and fish). Biogeosciences 7:1669–1699. https:// doi. org/ 10. 5194/ bg-7- 1669- 2010 Falkenhaug T (1991) Prey composition and feeding rate of Sagitta
elegans var. arctica (chaetognatha) in the Barents Sea in early summer. Polar Res 10:487–506. https:// doi. org/ 10. 3402/ polar.
v10i2. 6761
Frank TM, Widder EA (2002) Effects of a decrease in downwelling irradiance on the daytime vertical distribution patterns of zoo- plankton and micronekton. Mar Biol 140:1181–1193. https://
doi. org/ 10. 1007/ s00227- 002- 0788-7
Granhag L, Majaneva S, Friis Møller L (2012) First recording of the ctenophore Euplokamis sp. (Ctenophora, Cydippida) in Swedish coastal waters and molecular identification of this genus. Aquat Invasions 7:455–463. https:// doi. org/ 10. 3391/ ai. 2012.7. 4. 002 Haddock SHD (2004) A golden age of gelata: past and future
research on planktonic ctenophores and cnidarians. Hydrobio- logia 530:549–556. https:// doi. org/ 10. 1007/ s10750- 004- 2653-9 Heeger T, Piatkowski U, Möller H (1992) Predation on jellyfish by
the cephalopod Argonauta argo. Mar Ecol Prog Ser 88:293–
296. https:// doi. org/ 10. 3354/ meps0 88293
Henschke N, Bowden DA, Everett JD et al (2013) Salp-falls in the Tasman Sea: a major food input to deep-sea benthos. Mar Ecol Prog Ser 491:165–175. https:// doi. org/ 10. 3354/ meps1 0450 Holland LZ (2016) Tunicates. Curr Biol Mag 26:146–152. https://
doi. org/ 10. 1016/j. cub. 2015. 12. 024
Hosia A, Båmstedt U (2007) Seasonal changes in the gelatinous zoo- plankton community and hydromedusa abundances in Korsfjord and Fanafjord, western Norway. Mar Ecol Prog Ser 351:113–
127. https:// doi. org/ 10. 3354/ meps0 7148
Hosia A, Stemmann L, Youngbluth M (2008) Distribution of net- collected planktonic cnidarians along the northern Mid-Atlantic Ridge and their associations with the main water masses. Deep Res Part II 55:106–118. https:// doi. org/ 10. 1016/j. dsr2. 2007. 09.
Hosia A, Falkenhaug T, Baxter EJ, Pagès F (2017) Abundance, dis-007 tribution and diversity of gelatinous predators along the north- ern Mid-Atlantic Ridge: a comparison of different sampling methodologies. PLoS ONE 12:1–18. https:// doi. org/ 10. 1371/
journ al. pone. 01874 91
Hoving HJT, Haddock SHD (2017) The giant deep-sea octopus Haliphron atlanticus forages on gelatinous fauna. Sci Rep 7:1–
4. https:// doi. org/ 10. 1038/ srep4 4952
Hoving HJT, Neitzel P, Robison B (2018) In situ observations lead to the discovery of the large ctenophore Kiyohimea usagi (Lobata:
Eurhamphaeidae) in the eastern tropical Atlantic. Zootaxa 4526:232–238. https:// doi. org/ 10. 11646/ zoota xa. 4526.2.8 Hoving HJT, Christiansen S, Fabrizius E et al (2019) The Pelagic
In situ Observation System (PELAGIOS) to reveal biodiver- sity, behavior, and ecology of elusive oceanic fauna. Ocean Sci 15:1327–1340. https:// doi. org/ 10. 5194/ os- 15- 1327- 2019 Johansson ML, Shiganova TA, Ringvold H et al (2018) Molecular
Insights Into the Ctenophore Genus Beroe in Europe: new spe- cies, spreading invaders. J Hered 109:520–529. https:// doi. org/
10. 1093/ jhered/ esy026
Kaartvedt S, Staby A, Aksnes DL (2012) Efficient trawl avoidance by mesopelagic fishes causes large underestimation of their biomass. Mar Ecol Prog Ser 456:1–6. https:// doi. org/ 10. 3354/
meps0 9785
Kristensen TK (1984) Biology of the Squid Gonatus fabricii (Lichten- stein, 1818) from West Greenland Waters. Meddelelser om Gron- land. Biosci 13:2–20
Latasa M, Cabello AM, Morán XAG et al (2017) Distribution of phy- toplankton groups within the deep chlorophyll maximum. Limnol Oceanogr 62:665–685. https:// doi. org/ 10. 1002/ lno. 10452 Lebrato M, Pitt KA, Sweetman AK et al (2012) Jelly-falls historic
and recent observations: a review to drive future research direc- tions. Hydrobiologia 690:227–245. https:// doi. org/ 10. 1007/
s10750- 012- 1046-8
Licandro P, Blackett M, Fischer A et al (2015) Biogeography of jel- lyfish in the North Atlantic, by traditional and genomic meth- ods. Earth Syst Sci Data 7:173–191. https:// doi. org/ 10. 5194/
essd-7- 173- 2015
Lick R, Piatkowski U (1998) Stomach contents of a Norther Bottelnose Whale (Hyperoodon ampullatus) Stranded at Hiddensee, Baltic Sea. J Mar Biol Assoc UK 78:643–650. https:// doi. org/ 10. 1017/
S0025 31540 00416 79
Linke P, Schmidt M, Rohleder M et al (2015) Novel online digital video and high-speed data broadcasting via standard coaxial cable onboard marine operating vessels. Mar Technol Soc J 49:7–18.
https:// doi. org/ 10. 4031/ MTSJ. 49.1.2
Lynam CP, Lilley MKS, Bastian T et al (2011) Have jellyfish in the Irish Sea benefited from climate change and overfishing? Glob Chang Biol 17:767–782. https:// doi. org/ 10. 1111/j. 1365- 2486.
2010. 02352.x
Majaneva S, Majaneva M (2013) Cydippid ctenophores in the coastal waters of Svalbard: is it only Mertensia ovum. Polar Biol 36:1681–
1686. https:// doi. org/ 10. 1007/ s00300- 013- 1377-6
Matsumoto GI, Robison BH (1992) Kiyohimea usagi, a new species of lobate ctenophore from the Monterey Submarine Canyon. Bull Mar Sci 51:19–29
Melle W, Ellertsen B, Skjoldal HR (2004) Zooplankton: the link to higher trophic levels. In: Skjoldal HR, Saetre R (eds) The Nor- wegian Sea Ecosystem. Tapir Academic Press, Trondheim, pp 137–202
Mills CE, Haddock SHD (2007) Intertidal invertebrates of the Central California Coast. In: Carlton JT (ed) The light and smith manual.
University of California Press, Berkeley
Nagabhushanam AK (1959) Feeding of a Ctenophore, Bolinopsis Infundibulum (O. F. Müller). Nature 184:829. https:// doi. org/ 10.
1038/ 18482 9a0
Norheim E, Klevjer TA, Aksnes DL (2016) Evidence for light-con- trolled migration amplitude of a sound scattering layer in the Norwegian Sea. Mar Ecol Prog Ser 551:45–52. https:// doi. org/
10. 3354/ meps1 1731
Pagès F, Flood P, Youngbluth M (2006) Gelatinous zooplankton net- collected in the Gulf of Maine and adjacent submarine canyons:
new species, new family (Jeanbouilloniidae), taxonomic remarks and some parasites. Sci Mar 70:363–379. https:// doi. org/ 10. 3989/
scimar. 2006. 70n33 63
Piatkowski U, Rodhouse PG, White MG et al (1994) Nekton commu- nity of the Scotia Sea as sampled by the RMT 25 during austral summer. Mar Ecol Prog Ser 112:13–28. https:// doi. org/ 10. 3354/
meps1 12013
Raymond EH, Widder EA (2007) Behavioral responses of two deep- sea fish species to red, far-red, and white light. Mar Ecol Prog Ser 350:291–298. https:// doi. org/ 10. 3354/ meps0 7196
Reisenbichler KR, Chaffey MR, Cazenave F et al (2016) Automat- ing MBARI ’s midwater time-series video surveys: the transition from ROV to AUV. OCEANS 2016 MTS/IEEE Monterey. IEEE, Monterey, pp 1–9
Robinson C, Steinberg DK, Anderson TR et al (2010) Mesopelagic zone ecology and biogeochemistry—a synthesis. Deep Res Part II 57:1504–1518. https:// doi. org/ 10. 1016/j. dsr2. 2010. 02. 018 Robison BH (2004) Deep pelagic biology. J Exp Mar Bio Ecol
300:253–272. https:// doi. org/ 10. 1016/j. jembe. 2004. 01. 012 Robison BH, Reisenbichler KR, Sherlock RE (2005) Giant Larva-
cean houses: rapid carbon transport to the deep sea floor. Science 308:1609–1611. https:// doi. org/ 10. 1126/ scien ce. 11091 04 Robison BH, Reisenbichler KR, Sherlock RE (2017) The coevolution
of midwater research and ROV technology at MBARI. Oceanog- raphy 30:26–37. https:// doi. org/ 10. 5670/ ocean og. 2017. 421 Santos MB, Pierce GJ, Boyle PR et al (1999) Stomach contents of
sperm whales Physeter macrocephalus stranded in the North Sea 1990–1996. Mar Ecol Prog Ser 183:281–294. https:// doi. org/ 10.
3354/ meps1 83281
Satterlie RA, LaBarbera M, Spencer AN (1985) Swimming in the Pteropod Mollusc, Clione Limacina. J Exp Biol 116:189–205 Schlining BM, Jacobsen Stout N (2006) MBARI’s video annotation and
reference system. OCEANS 2006. IEEE, Boston, pp 1–5 Stemmann L, Hosia A, Youngbluth MJ et al (2008) Vertical distribu-
tion (0–1000 m) of macrozooplankton, estimated using the Under- water Video Profiler, in different hydrographic regimes along the northern portion of the Mid-Atlantic Ridge. Deep Res Part II 55:94–105. https:// doi. org/ 10. 1016/j. dsr2. 2007. 09. 019
Stoner AW, Ryer CH, Parker SJ et al (2008) Evaluating the role of fish behavior in surveys conducted with underwater vehicles. Can J Fish Aquat Sci 65:1230–1243. https:// doi. org/ 10. 1139/ F08- 032 Sweetman AK, Chapman A (2015) First assessment of flux rates of
jellyfish carcasses (jelly-falls) to the benthos reveals the impor- tance of gelatinous material for biological C-cycling in jellyfish- dominated ecosystems. Front Mar Sci 2:1–7. https:// doi. org/ 10.
3389/ fmars. 2015. 00047
Thuesen EV, Rutherford LD, Brommer PL et al (2005) Intragel oxy- gen promotes hypoxia tolerance of scyphomedusae. J Exp Biol 208:2475–2482. https:// doi. org/ 10. 1242/ jeb. 01655
Utne-Palm AC, Breen M, Løkkeborg S, Humborstad O-B (2018) Behavioural responses of krill and cod to artificial light in labo- ratory experiments. PLoS ONE 13:1–17. https:// doi. org/ 10. 1371/
journ al. pone. 01909 18Jan uary
Vecchione M, Young RE, Piatkowski U (2010) Cephalopods of the northern Mid-Atlantic Ridge. Mar Biol Res 6:25–52. https:// doi.
org/ 10. 1080/ 17451 00090 28107 51
Vinogradov GM (2005) Vertical distribution of macroplankton at the Charlie-Gibbs Fracture Zone (North Atlantic), as observed from the manned submersible “Mir-1.” Mar Biol 146:325–331. https://
doi. org/ 10. 1007/ s00227- 004- 1436-1
Wiborg KF, Gjøsæter J, Beck IM (1984) The Squid Gonatus fabricii (Lichtenstein) Investigations the Norwegian Sea and Western Bar- ents Sea 1982–1983. ICES C Doc. pp 1–14
Wiebe PH, Ashjian CJ, Gallager SM et al (2004) Using a high-pow- ered strobe light to increase the catch of Antarctic krill. Mar Biol 144:493–502. https:// doi. org/ 10. 1007/ s00227- 003- 1228-z Publisher’s Note Springer Nature remains neutral with regard to jurisdictional claims in published maps and institutional affiliations.