Leanne C. Powers1, Norbert Hertkorn2, Natasha McDonald3,4, Philippe Schmitt‐Kopplin2,5, Rossana Del Vecchio6, Neil V. Blough7, and Michael Gonsior1
1University of Maryland Center for Environmental Science, Chesapeake Biological Laboratory, Solomons, MD, USA,
2Helmholtz Zentrum Muenchen–German Research Center for Environmental Health, Research Unit Analytical BioGeoChemistry, Neuherberg, Germany,3Bermuda Institute of Ocean Sciences, St. George's, Bermuda,4GEOMAR Helmholtz Centre for Ocean Research, Kiel, Germany,5Chair of Analytical Food Chemistry, Technische Universität München, Weihenstephan, Germany,6Earth System Science Interdisciplinary Center, University of Maryland, College Park, MD, USA,7Department of Chemistry and Biochemistry, University of Maryland, College Park, MD, USA
Abstract
Dissolved organic carbon (DOC) plays critical roles in marine carbon cycling, but its sources and sinks remain uncertain. In this study, we monitored DOC exudation rates ofSargassum natansunder visible light (λ> 390 nm) and solar radiation. DOC release rates ranged from 7 to 10μg C g−1biomasshr−1(wet weight) under visible light, but increased to 23 to 41μg C g−1biomasshr−1when exposed to natural sunlight. Results indicate that DOC released bySargassumcould amount to 0.3 to 1.2 Tg C/year, potentially contributing significantly to the marine DOC pool in the Gulf of Mexico and Western North Atlantic. We employed the Folin‐Ciocalteu phenolic content method, nuclear magnetic resonance (NMR) spectroscopy, and ultrahigh resolution Fourier transform ion cyclotron resonance mass spectrometry (FT‐ICR MS) to characterize the diverse pool of organic compounds exuded fromSargassum.
Results from these complementary methods showed thatSargassumrelease large quantities of phlorotannins, a class of polyphenols that have very similar properties to terrestrial DOC. These phlorotannins and their oxygenated phenolic derivatives exhibit a high hydrogen deficiency and functionalization (i.e., 4 to 6 oxygen atoms per aromatic ring), representing 5 to 18% of the released DOC isolated by solid phase extraction. Thus,Sargassumis the largest biological source of open ocean polyphenols recorded to date. The amount of polyphenolic DOC released bySargassumchallenges previous beliefs that all polyphenols found within the oceans are remnants of terrestrial organic matter, although the stability of phlorotannins and their derivatives needs to be further evaluated.
Plain Language Summary
Macrobrown algae contribute dissolved organic carbon (DOC) to the coastal and open ocean, potentially influencing carbon cycles and redox chemistry. They also contain a very specific class of polyphenols known as phlorotannins; however, brown algae have not been considered a sizable source of marine polyphenols or DOC. Here we present evidence that pelagicSargassumspecies release DOC with a high phenolic content (~5–18% of solid phase extracted DOC). Based on estimated literature values of annualSargassumbiomass and without accounting for possible sinks,Sargassumcould potentially contribute approximately 0.3 to 1.2 Tg C/year as DOC and 30 to 200 Gg C/year as polyphenols to the Gulf of Mexico and western North Atlantic.1. Introduction
Marine dissolved organic carbon (DOC) is one of Earth's major dynamic carbon reservoirs, yet its sources and reactivity remain poorly quantified. A recent synopsis evaluated the role of macroalgae in global carbon sequestration, and estimated that 0.36 Pg C/year is exported from macroalgal beds as DOC, on the same scale as annual riverine DOC inputs into the ocean (Krause‐Jensen & Duarte, 2016). While such estimates may have large error margins they nevertheless suggest a substantial contribution. Rivers constitute the largest allochthonous source of DOC to the ocean, delivering an estimated ~0.2 to 0.4 Pg C/year (Raymond &
Spencer, 2015). Terrestrial DOC exported by rivers contains a relatively large component that originates pri- marily from the degradation products of lignin polyphenols (Boyle et al., 2009; Hernes, 2003; Hernes et al., 2008; Spencer et al., 2008, 2009; Stenson et al., 2003; Stubbins et al., 2010) and tannins (Maie et al., 2008;
Sleighter & Hatcher, 2008). It has been suggested that terrestrial DOC is largely remineralized in coastal
©2019. American Geophysical Union.
All Rights Reserved.
Key Points:
• When exposed to natural sunlight, pelagicSargassumspecies released large amounts of dissolved organic carbon (DOC)
• SargassumDOC has a high phenolic content (~5–18% of solid phase extracted DOC)
• While phlorotannin stability should be evaluated, results highlight that Sargassumcould be a substantive marine source of polyphenols Supporting Information:
•Supporting Information S1
Correspondence to:
L. C. Powers and M. Gonsior, lpowers@umces.edu;
gonsior@umces.edu
Citation:
Powers, L. C., Hertkorn, N., McDonald, N., Schmitt‐Kopplin, P., Del Vecchio, R., Blough, N. V., & Gonsior, M. (2019).
Sargassumsp. act as a large regional source of marine dissolved organic carbon and polyphenols.Global Biogeochemical Cycles,33, 1423–1439.
https://doi.org/10.1029/2019GB006225 Received 14 MAR 2019
Accepted 16 SEP 2019
Accepted article online 11 OCT 2019 Published online 25 NOV 2019 Leanne C. Powers and Norbert Hertkorn are co‐first authors contri- buting equally to this work.
zones, and this assumption is based on stable isotope compositions that suggest that marine DOC contains very little terrestrial character (Bauer, 2002; Beaupré, 2015) and because lignin biomarkers have very low abundance in the open ocean (Opsahl & Benner, 1997). However, the ultimate fate of terrestrially derived DOC in the ocean is still under debate. Nevertheless, various fractions of terrigenous DOC are susceptible to rapid biodegradation, such as amino acids, and photodegradation, such as lignin phenols (Benner &
Kaiser, 2011; Hernes, 2003; Spencer et al., 2008). Recent studies have challenged earlier carbon isotope work by analyzing fractions of marine DOC (Follett et al., 2014; Zigah et al., 2017), by characterizing molecular structures within DOC with NMR spectroscopy (Cao et al., 2018), or by detailed analysis of optical properties (Andrew et al., 2013; Cartisano et al., 2018), thereby painting a much more complex picture of sources that are likely constituents of the marine DOC pool.
Macrobrown algae or Phaeophyceae contain a class of marine polyphenols known as phlorotannins, which are exclusively formed by the polymerization of phloroglucinol (1,3,5‐trihydroxybenzene; Swanson &
Druehl, 2002). Moreover, extracts of brown and green algae analyzed by Curie‐point pyrolysis‐gas chroma- tography contained alkylphenols, likely from alkylated phlorotannin‐like compounds (Van Heemst et al., 1996). These alkylphenol pyrolysis products appear to result from refractory components of marine DOC, as the relative abundance of these compounds increased with depth in the water column (Van Heemst et al., 1996). As yet, the importance of macrobrown algae to supply DOC and complex polyphenolic com- pounds to the oceans is unknown. Macrobrown algae are distributed widely and are predominantly found in temperate and colder waters. An exception is the genusSargassum, with approximately 250 species that are distributed throughout the temperate and tropical oceans. While benthic species can become pelagic after being removed from the seafloor, only two species,Sargassum natansandSargassumfluitans, have been found to be truly holopelagic (referred to asSargassumhereafter). These species live in the epipelagic zone of the Gulf of Mexico, Western Atlantic, and Sargasso Sea, where they can form extensive mats that are large enough to be observed by satellites and have a biomass that may exceed 2 Tg/year (Gower & King, 2011). While other biomass estimates vary between 4 and 11 Tg annually (Butler & Stoner, 1984; Parr, 1939), satellite data have revealed an increasing trend inSargassumabundance between 2000 and 2015 (Wang & Hu, 2016), and therefore, annualSargassumbiomass may very well be even higher than previous estimates have indicated. A recent study estimated the biomass ofSargassumthat has sedimented to the sea- floor to be comparable to the biomass observed at the surface (Baker et al., 2017), which would require a quantitative annual removal ofSargassumand transport into the abyssal ocean, which is also supported by recent modeling work (Brooks et al., 2018).
Previous work has estimated thatSargassumfix 181 to 1,234 (328 on average)μg C g−1biomasshr−1(dry weight), with 0 to 76% (25% on average) released as DOC (Hanson, 1977). DOC release is highly dependent on the brown alga species, with reported values ranging from under 1% to as much as 40% of net assimilation (Brylinsky, 1977; Hanson, 1977). Brylinsky (1977) measured exudation rates of DOC from holopelagic Sargassumranging from 3 to 6μg C g−1biomasshr−1(dry weight), but these incubations were performed in glass containers and therefore may not reflect rates of DOC release under natural sunlight (i.e., including ultraviolet (UV) radiation). DOC exuded from two kelp species,Macrocystis pyriferafound in California coastal waters andLaminaria hyperboreanfound in Norwegian coastal waters, amounted to 14 to 26% of fixed carbon released as DOC, respectively, but this was variable on monthly time scales (Abdullah &
Fredriksen, 2004; Reed et al., 2015). Abdullah and Fredriksen (2004) also quantified carbohydrate and phe- nol concentrations in kelp exudates, and while most of the DOC released was saccharides, the contribution of polyphenols varied between 6 and 19% of the DOC, determined using the Folin‐Ciocalteu reagent and gal- lic acid standards. Although the proportion of phenolic compounds in DOC released bySargassumis not currently known, these prior results suggest that polyphenolic compounds could be a major constituent (Abdullah & Fredriksen, 2004).
In this study, we monitored the increases in DOC concentration during controlled exudation experiments under natural sunlight (Bermuda, late September) and under artificial (visible light) irradiation in the laboratory. The Folin‐Ciocalteu colorimetric test was employed to estimate phenolic content in the released DOC following isolation from seawater using solid phase extraction (SPE). Nuclear magnetic resonance (NMR) along with ultrahigh‐resolution Fourier transform ion cyclotron resonance mass spectrometry (FT‐ICR MS) were further employed to characterize the compounds exuded from Sargassum. These
techniques were used to evaluate the role ofSargassumas a marine source of polyphenols and other classes of organic compounds in the Gulf of Mexico and Northern Atlantic Ocean.
2. Materials and Methods
2.1. Sampling
Sargassumsamples were collected along the ship side using a hand‐held net aboard the R/VSharpin the Sargasso Sea during July 2016 for controlled laboratory exudation experiments.Sargassumwas housed onboard in a tank (less than three days) with continuouslyflowing seawater and transported back to the laboratory immediately upon return to another tank withfiltered ambient bay water (adjusted to salinity
= 35) that was circulated through a UV treatment system(Neotech Aqua Solutions, Inc.) to keep back- ground DOC levels low.Sargassumsamples were also collected aboard the R/VHenry Stommel9 km off the coast of Bermuda in late September 2016 and were transferred to outdoor tanks housed at the Bermuda Institute of Ocean Sciences, with continuouslyflowing seawater within 2 hr of collection to mimic
“natural”conditions.
2.2. Exudation Experiments
Three types of exudation experiments were conducted during this study. One set of experiments was con- ducted in the laboratory (listed as“indoors”in Table 1). For these experiments,Sargassumsubsamples (approximately 100 g wet weight) were rinsed with 24 hr UV‐treated artificial seawater (Instant Ocean) and transferred to small tanks containing 7 L 24 hr UV‐treated artificial seawater. Each tank was equipped with a Radion LED lamp (Eco Tech Marine, spectral output in Figure S1 in the supporting information). To mimic summertime conditions, lamps were set for a 14 hr day/10 hr night cycle and tanks were maintained at 29 °C with Eheim Jager TruTemp Quantum heaters. One tank containing noSargassumserved as a blank Table 1
Release Rates of Dissolved Organic Carbon (DOC) From Sargassum Biomass/volume
(g/L)
DOC (μg C g−1biomasshr−1) (entire experiment) (r2)
DOC (μg C g−1biomasshr−1) 1100 to 1900 (r2) Nonstress conditions
Indoor 28 hr 16 9.5 ± 0.4 (0.98) 11 ± 2 (0.93)
Indoor 36 hr 13 8.1 ± 0.6 (0.96) 9.6 ± 2.4 (0.88)
Indoor 36 hr 15 6.6 ± 0.4 (0.97) 4.7 ± 2.2 (0.69)
Indoor 36 hr 14 7.4 ± 0.4 (0.98) 5.8 ± 2.5 (0.73)
Outdoor Plexiglas 47 hr 16 6.7 ± 0.5 (0.95) 11 ± 1 (0.98)
Outdoor Plexiglas 22 hr 15 5.0 ± 1.0 (0.80) 10 ± 3 (0.81)
Pooled (without full solar exposure) 7±0.3(0.93) 7±2(0.35)
Outdoor no cover 47 hr 20 11.8 ± 1.8 (0.79) 41 ± 12 (0.78)
Outdoor no cover 28 hra 16 11.0 ± 1.5 (0.88) 36 ± 3 (0.99)
Outdoor no cover 27 hra 43 9.9 ± 1.2 (0.93) 24 ± 2 (0.99)
Outdoor no cover 30 hra 32 14 ± 0.6 (0.99) 14 ± 0.4 (0.99)
Pooled (with full solar exposure) 12±1(0.85) 23±8(0.40)
Stress conditions
Indoor 20 °C 30 35 ± 5 (0.94) 52 ± 7 (0.98)
Outdoors 26 to 39 °C 10 65 ± 17 (0.84) 50 ± 5 (0.99)
Outdoors (shade) 25 °C 35 50 ± 21 (0.64) 9.3 ± 5 (0.75)
Outdoors 26 to 43 °C 29 930 ± 160 (0.92) 1400 ± 310 (0.95)
Outdoors 26 to 49 °C 6.2 1700 ± 350 (0.89) 2900 ± 530 (0.97)
Note. Rates were determined by a linear regression of DOC concentration versus time during exudation experiments for individual tanks using various light con- ditions, wet weights, and tank volumes as described in section 2.2. DOC concentrations (mg/L) were normalized toSargassumbiomass in wet weight (gbiomass) and tank volume (L). Rates (μg C g−1biomasshr−1± 1 SD) were either determined over the entire experiment (28 to 47 hr) or between the hours of 1100 and 1900 local time; correspondingr2values are listed in parentheses. For nonstress condition experiments, tanks were maintained at 26 to 29 °C and for stress condition experiments, temperature ranged from 20 to 49 °C. Nonstress experiments with full solar exposure (n= 4) and without full solar exposure (n= 6) were pooled and average rates were determined by linear regression of these pooled nonstress condition experiments (pvalue <0.001,F= 24.6, determined by analysis of covariance in Matlab®). All indoor experiments were forSargassumsamples collected in July 2016 and all outdoor experiments were forSargassum samples collected in September/October 2016, as described in section 2.
aSolid phase extracts from these samples were analyzed by1H nuclear magnetic resonance spectroscopy (NMR) with the following sample identification noted in the supporting information: outdoor 28 hr is sample 394, outdoor 27 hr is sample 395, and outdoor 30 hr is sample 396. These extracts were consolidated to pro- vide sufficient material for both1H‐based 2‐D and13C NMR spectroscopy.
and was sampled for DOC concentrations as described in section 2.3. To minimize any stress from transfer, the water was drained and replaced before monitoring dissolved organic carbon (DOC) exudation from the Sargassumsamples.
Another set of exudation experiments was conducted in outdoor tanks at the Bermuda Institute of Ocean Sciences (listed as“outdoors”in Table 2). For outdoor incubations,Sargassumwas placed in small tanks con- taining open ocean seawater within a large tank of continuouslyflowing seawater. Temperature (°C) and solar intensity (Lux) in the tanks were periodically monitored with HOBO® pendant temperature/light data loggers. For these experiments, temperatures ranged between 26 and 27.5 °C. To better understand the impacts of UV radiation on DOC exudation rates, tanks were either left uncovered and exposed to full solar irradiation or tanks were covered with a Plexiglas cover that had irradiation cut off at 345 nm and UVA (320 to 400 nm) transmission reduced to 65%. Incubation volumes andSargassumbiomass for these experiments are listed in Table 1.
The third set of experiments was performed to investigate the impacts of stress and senescent conditions on the release of DOC bySargassum(listed as“stress conditions”in Table 1). Although some of the incubation temperatures are unrealistic for the open ocean (e.g., temperatures reached up to 49 °C), the goal of these experiments was to understand the maximum potential forSargassumDOC exudation, especially in light of the annualSargassuminundation events that occur in coastal environments. It has been noted that 24 to 30 °C is the optimal temperature range for pelagicSargassumsp. (Hanisak & Samuel, 1987), so one tank was kept indoors and left at 20 °C. Four experiments were conducted outdoors. One tank contained midse- nescentSargassum(based on visual inspection) and was kept under low light (no direct sunlight) where the temperature did not change from 25 °C over the course of 12 hr. The other tanks contained healthy Sargassumbut were left outdoors for 12 hr in direct sunlight with no temperature control. In these tanks the temperature ranged from 25 °C at the start of the experiment up to 49 °C after 12 hr (Table 1).
2.3. Dissolved Organic Carbon and Solid Phase Extraction
For all exudation experiments, subsamples of tank water at various time points were 0.2 μm filtered (Whatman 25‐mm GD/X syringefilters) into clean combusted (500 °C) 40‐mL amber glass vials. Samples were acidified to pH 2 using concentrated HCl (Sigma‐Aldrich 32 %, pura) and analyzed for DOC concentra- tions using a Shidmadzu TOC‐V. Samples were either analyzed immediately or stored at 4 °C until analysis (typically within 1 to 10 days of collection). DOC concentrations at these time points were used to determine DOC release rates over the day or entire exudation experiment (Table 1). At the end of all incubation experi- ments (Table 1), typically lasting 24 to 48 hr, tank water housingSargassumwasfiltered through precom- busted Whatman 0.7‐μm GF/F glassfiberfilters, acidified to pH 2 using concentrated HCl and solid‐phase extracted using Agilent Bond Elut PPL (5 g) cartridges. This solid‐phase extraction (SPE) technique was pre- viously described in detail elsewhere (Dittmar et al., 2008). For our first extractions (i.e., indoor experiments), ~6 L offiltered tank water was passed through the cartridge ensuring that no more than 50 Table 2
Estimated Phenolic Content (Units Listed in Table) in Sargassum SPE‐DOM From Samples Exposed to Full Sunlight Using Various Methods Techniques used to estimate relative phenol content in
Sargassum natansSPE‐DOM Estimated relative phenolic content inSargassum natansSPE‐DOM (%)
Folin‐Ciocalteu Colorimetric method 7.0% (100 × (phenol content)μM/(DOC)μM)
1H NMRδ(1H) = 7.2−5.8 ppm 5.3% total integral
13C NMRδ(13C) = 160−90 ppm 18% total integral
13CH DEPT NMRδ(13C) = 160−90 ppm 8.4% total integral
13C NMR quatd: quaternary carbon only;δ(13C) = 160−90 ppm
44% of the quaternary carbon is associated with phlorotannins.
The average substitution within phlorotannins ranges near 5.5 per aromatic ring;
that is, only 0.5 protons are attached to phlorotannin aromatic rings on average, suggesting high oxygenation (hydroxylation and carboxylation) pH titration experiments 10 milli‐equivalents g−1C or 38% of titratable groups (100 × (phenol content)/
(phenol content + carboxyl content))
For1H NMR spectra 100% corresponds to total integral, with recognition of cross peak distribution in1H,13C HSQC NMR spectra. See Tables S2–S4 for addi- tional details.
mg of DOC was loaded per 5‐g cartridge. After extraction, cartridges were rinsed with 30 mL Milli‐Q water followed by 30 mL 0.1% formic acid water (Optima™LC/MS grade, Fisher) to remove salts. Cartridges were dried in a hood using a vacuum manifold and were eluted with 30 mL methanol (Otima™LC/MS grade, Fisher). Extraction efficiencies were determined by measuring DOC concentrations on SPE samples that were generated by completely drying methanolic extracts under a stream of N2and re‐dissolving them in water. For these samples, extraction efficiencies were low (~30%), perhaps due to overloading the cartridge.
For remaining experiments, 10‐g cartridges were custom‐packed and only 1 to 2 L offiltered tank water was extracted, improving extraction efficiency to ~40–60%, which is typical for marine dissolved organic matter (DOM; Dittmar et al., 2008). However, extraction efficiency was always low for extractions of DOM from Sargassumincubated with no temperature control. The decreased extraction efficiency of the DOM could be due to the loss of highly polar monosaccharides and small organic acids, which are not efficiently retained by this solid‐phase extraction method.
2.4. Phenolic Content
Phenolic content in SPE‐DOM was determined following minor modifications of the Folin‐Ciocalteu method for the determination of phenolic content in solid‐phase extracted marine DOM (Takeda et al., 2013). Briefly, SPE‐DOM samples were created with 0.2 mL of each MeOH extract that dried completely under N2and re‐dissolved in 20 mL Milli‐Q water, sonicated for 5 min, and 0.2μmfiltered (Whatman 25‐ mm GD/X syringefilters). The 3.6 mL of each sample were transferred to a combusted borosilicate vial con- taining 0.4 mL 1 M NaOH (J.T. Baker) and 0.2 mL Folin‐Ciocalteu phenol reagent (Sigma‐Aldrich), and reacted for 30 min at room temperature. Subsequently, 4 mL 2 M Na2CO3(Fisher) and 1.8 mL Milli‐Q water were added to the reaction mixture, the color was developed for 1 hr in an oven at 40 °C and the mixture's absorbance was monitored in a 1‐cm quartz spectrophotometric cell at 720 nm using a Horiba Aqualog.
Phenolic content was determined by a calibration curve of phloroglucinol (Aldrich) solutions ranging from 0 to 50μM that were reacted in the same way as the samples. Thus, phenolic content reported here is reported as phloroglucinol equivalents. The unreacted SPE‐DOM sample was analyzed for DOC concentra- tion, as above. Phenolic content was simply determined by dividing the phenol content (asμM phlorogluci- nol equivalents) by the SPE‐DOC concentration (μM) and reported as %phenolic content (100 × (phenol content)μM/(DOC)μM) or as mol/kg C ((phenol content)μM/(DOC)mgC/L). For select samples (SRNOM and SargassumSPE‐DOM), phenolic content was estimated by pH titration as in Ritchie and Perdue (2003), using an Orion 8220 BNWP microelectrode,μL additions of 0.1 N HCl and 0.1 N NaOH, and assuming that half the phenolic groups were titrated between a pH of 8 and 10.
2.5. FT‐ICR MS Analysis
Mass spectrometric analyses were undertaken at the Helmholtz Zentrum, Munich, Germany using a Bruker Solarix 12 Tesla Fourier transform ion cyclotron resonance mass spectrometer (FT‐ICR MS) using both negative and positive electrospray ionization at 3,600 V. Theflow rate was 120μL/hr, 500 spectra were aver- aged, and the resolution (>500,000 atm/z400) and the mass error (<0.2 ppm) were sufficiently high to com- pute exact molecular formulae (Herzsprung et al., 2014; Koch et al., 2007). Calibration was performed with arginine clusters and spectra were postcalibrated using known DOMm/zions across them/zrange of 200–
700 (Gonsior et al., 2009; Timko et al., 2015). The following chemical elements were used to compute exact molecular formulae:12C1‐∞,1H1‐∞,16O1‐∞,14N0‐5and32S0‐2, and79/81Br0‐2. Detailed descriptions how to accurately assign molecular formulae have been previously described (Herzsprung et al., 2014; Koch et al., 2007), and the calibration of mass spectrometric data in this study was also previously explained in detail (Timko et al., 2015). Van Krevelen diagrams are effective in visualizing the chemical space of the assigned molecular formulae (van Krevelen, 1950) according to their hydrogen to carbon (H/C) and oxygen to carbon (O/C) ratios and were used throughout this study. Known phlorotannins (Isaza Martínez & Torres Castañeda, 2013) were plotted in Van Krevelen space to better visualize how these compounds compare to the entire SPE‐DOM pool that can characterized by FT‐ICR MS. Likewise, nominal additions indicating oxygenation (±O), hydration (±H2O), and carboxylations (±CO2) to known phlorotannins were also included in Van Krevelen space to help visualize theoretical transformations of exuded phlorotannins.
The Kendrick mass defect (KMD) and the z* values are independent parameters to unambiguously identify CH2‐based homologues (Stenson et al., 2003).
KM¼Massmeasuredð14:0000=14:01565Þ (1)
KMD¼nominal mass NMð Þ–KM (2)
z*¼modulus NMð =14Þ–14 (3)
In this study we used a modified Kendrick plot, where the ratio of KMD/z* is plotted against the exact mass, which was previously introduced (Shakeri Yekta et al., 2012). This diagram can be used to visualize series of H2‐(Δm = 2.1057 Da) and CH2‐based (Δm = 14.0156 Da) homologous series spacing and the spacing created by the nominal exchange of 1 C and 4 H versus oxygen (Δm = 36.39 Da). Additionally, double‐bond equiva- lents (DBE) were computed as follows (Koch & Dittmar, 2006)
DBE¼1þð2C–HþN–BrÞ=2 (4)
Two additional parameters, the aromaticity index (AI) (Koch & Dittmar, 2016, 2006) and the aromaticity equivalent (XC) (Yassine et al., 2014), were also computed for all assigned molecular formulas containing carbon, hydrogen, and oxygen as follows
AI¼ð1þC–mO–§HÞ=ðC–mOÞ (5)
XC¼1þð2C–H–2mOÞ=DBE–mOÞ (6)
For equations (5) and (6),mis the number of oxygen atoms in double bonds and is therefore 1 for aldehydes and ketones and 0.5 for carboxylic acids and esters (Yassine et al., 2014). When the value of 0.5 is selected for AI this parameter is known as the modified aromaticity index (AImod) and assumes that half of the oxygen atoms are located in double bonds (Koch & Dittmar, 2016, 2006).
2.6. Nuclear Magnetic Resonance Spectroscopy
Bruker Avance III spectrometers housed at the Helmholtz Center, Munich, Germany, and TopSpin 3.2/PL6 software were used to acquire 1H and 13C nuclear magnetic resonance (NMR) spectra of re‐dissolved SargassumSPE‐DOM (0.4–1.5 mg solid SPE‐DOM in typically 50–75μL CD3OD (99.95 %2H), Aldrich, Steinheim, Germany; the consolidated SPE‐DOM sample used for acquisition of13C and 2‐D NMR spectra was ~4 mg). Briefly, the re‐dissolved sample were transferred to 2.0‐mm Bruker Match tubes and sealed. A cryogenic inverse geometry 5‐mm z‐gradient1H/13C/15N/31P QCI probe (B0= 18.8 T) was used for 1‐D1H detected 1D and 2D NMR spectra. The 1‐D1H was run on individual samples, but pooling of the three sam- ples (labeled 394–396; Table 1) was necessary to obtain high‐quality 2‐D and13C NMR spectra (Figure S11).
We computed the relative proportions of protonated carbon CH123by comparison of13C DEPT‐45 (show all CH123),13C DEPT‐135 (show CH13with positive and CH2with negative amplitude), and13C DEPT‐90 NMR (show CH only) spectra; a uniform coupling constant1JCHof 150 Hz was used for magnetization transfer. We corrected the13C DEPT‐90 NMR spectrum by subtracting a certain amount (commonly ~2–3%) of the13C DEPT‐45 NMR spectrum to attenuate leakage of CH3and CH2into the13C DEPT‐90 NMR spectrum which arises from the unavoidable variance in1JCHof SPE‐DOM. We used (acquisition‐time adjusted) linear com- binations of the13C DEPT‐45,‐135, and‐90 NMR spectra to compute the individual traces of CH (13C DEPT NMR spectrum), CH2(13C DEPT‐45 minus13C DEPT‐135), and CH3([13C DEPT‐45 plus13C DEPT‐135]
minus13C DEPT‐90). Then we determined the relative contributions of the individual spectra (CH3, CH2, CH1) to the sum CH123as observed in13C DEPT‐45 NMR spectra with recognition of the individual transfer amplitudes which were as follows (CH3= 1.06; CH2= 1.0; CH = 0.707; Sørensen & Jakobsen, 1988; Doddrell et al., 1982). We erroneously have not performed this correction in our previous publication Hertkorn et al.
(2013); overall, computed fractions of methine carbon (CH) increased by ~20–35%, those of methylene (CH2) decreased by ~ 5–12%, and methyl (CH3) by 1–15%, depending on the fractions of the individual types of car- bon (CH0123) present in SPE‐DOM. This implies that recognition of the individual transfer amplitudes in13C DEPT‐45 NMR spectra computes higher proportions of aliphatic branching in SPE‐DOM than the previous means of computation which had assumed uniform transfer amplitudes for CH123. The increased spectral dispersion of1H,13C HSQC NMR spectra was used to constrain the relative proportions of phlorotannin‐ related methine carbon units in the“phlorotannin‐section”of one‐dimensional1H and13C NMR spectra.
This approach could resolve the relative proportions of anomeric O2CH groups and =Csp2H groups from δC: 90–107 ppm, and the relative proportions of conjugated and alkylated olefins and =Csp2H units from δH: 5.8–6.5 ppm and provided more accurate assessment of the phlorotan- nin contents inSargassumextracts (Tables S3 and S4 in the supporting information). See Table S7 for all acquisition parameters.
3. Results and Discussion
3.1. Dissolved Organic Carbon Exudation Rates
DOC release rates during controlledSargassumincubation experiments were determined from a linear regression of all DOC measurements ver- sus time for individual tanks (Table 1). DOC release monitored during controlled indoor incubation experiments (artificial LED light, no UV;
Figure S1) ranged from 6.6 to 9.5μg C g−1biomasshr−1over 28‐to 36‐hr per- iods for individual experiments (r2values = 0.96 to 0.99; Table 1). This range in DOC release rate may be due to the differences in incubation time, Sargassum biomass, tank volume, or the health of the plant.
However, with the exception of the DOC release rate of 9.5μg C g−1biomass
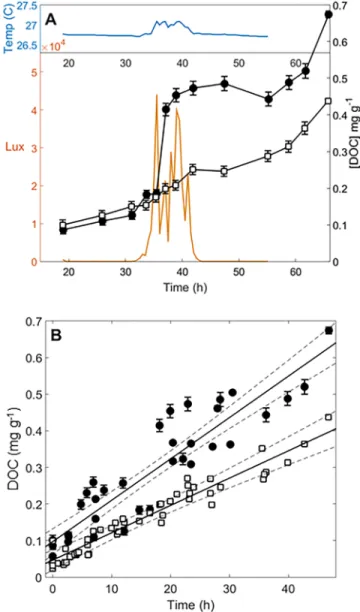
hr−1, the majority of indoor DOC exudation rates was not significantly dif- ferent from the rates of 5.0 to 6.6μg C g−1biomasshr−1determined for out- door tanks covered with Plexiglas (rates compared by analysis of covariance, ANCOVA, in Matlab®). Under these experimental conditions, DOC exudation rates likely underestimate those in situ because indoor tank incubations were carried out using artificial light with no UV expo- sure and lower measured irradiance than natural sunlight (Figure S1) and Plexiglas tank incubations were not exposed to solar radiation <345 nm and were exposed to reduced UVA radiation. To better compare the potential release in situ we also monitored the release of DOC from Sargassumin uncovered tanks during outdoor exudation rate experiments in Bermuda between 28 September and 3 October 2016. Over 28 to 48 hr, DOC exudation rates ranged between 10 and 14μg C g−1biomasshr−1for individual tanks and were more variable than to those measured indoors (r2values = 0.79 to 0.99; Table 1). This variability was likely due to the large increases in DOC concentration observed during afternoon outdoors (Figure 1a). To assess these increases, DOC release rates were calculated for all experiments between 1100 and 1900 local time. For all but one uncovered tank, rates increased significantly over this time to 24 to 41 μg C g−1biomasshr−1(pvalue <0.001, rates compared by ANCOVA in Matlab®; Table 1). For comparison, DOC release was only 4.7 to 11μg C g−1biomasshr−1for indoor and Plexiglas covered tanks between 1100 and 1900. Increases in DOC for uncovered outdoor tanks tracked well with increases in solar irradiance (Figure 1a) and likely explain the larger range in biomass normalized DOC exudation rates as compared to the indoor incubation experiments and the Plexiglas covered experiments.
To better compare all experiments, a linear regression between DOC and time for all time points acquired in uncovered tanks outdoors provided a value of 12 ± 1μg C g−1biomasshr−1 (n= 4,r2= 0.85), which was significantly higher than the value obtained from all indoor and Plexiglas incu- bations of 7.1 ± 0.3μg C g−1biomasshr−1(n= 6,r2= 0.93; Figure 1b;pvalue <0.001, ANCOVA). It should be noted that these more natural outdoor exudation rates were determined after the fall equinox, and may therefore be even higher during the summer months under maximum UV exposure. Reed et al. (2015) found that DOC release by giant kelpMacrocystis pyriferaincreased significantly with irradiation over the year and was 80% higher during the day than at night. Furthermore, one study that monitored DOC release from Figure 1.(a) Dissolved organic carbon (DOC) concentrations during
Sargassumexudation experiments. DOC (mg C/gbiomass, ± 1 SD, right axis) release over time during two outdoor incubation experiments. Black circles represent DOC from tanks exposed to full solar radiation and white squares represent DOC released in a tank with a Plexiglas cover (no UV exposure). The orange line is integrated visible solar irradiation (Lux, left axes) and the blue line is tank temperature (°C, top left axes). (b) DOC (mg/
gbiomass) versus time (hr) for four outdoor incubation experiments in full sunlight (black circles) and those for four indoor experiments with no UV exposure (white squares). Linear regressions (solid lines), plotted with 95%
confidence intervals (dashed lines), were used to determine DOC release rates regardless of start time or time of day (experiments ranging from 27 to 46 hr).
Sargassumbetween the hours of 10 and 12 found that exudation rates increased from 46μg C g−1biomasshr−1 (dry weight) in April to 287μg C g−1biomasshr−1(dry weight) in June (Hanson, 1977). During our experi- ments, even though water temperature increased by 1 °C between daytime and nighttime hours (Figure 1b), the increase in temperature cannot explain the increased exudation rates in incubations exposed to full solar radiation because a Plexiglas covered tank experienced the same temperature increase, without comparable increases in DOC concentrations (Figure 1a). However UV exposure alone does not appear to completely explain the differences in DOC exudation, because rates were still variable even when normal- ized to integrated light dose, ranging from 0.8 to 1.5 × 10‐4μg C g−1biomasshr−1Lux−1.
Hanson (1977) reported higher DOC release rates from“unhealthy”plants (up to 2,550μg C g−1biomasshr−1 dry weight for plants lacking thalli and/or overgrown with algae). To evaluate the release of DOC from Sargassumunder more stressful conditions (Table 1), plants were incubated for 12 hr both indoors and out- doors at temperatures ranging from 20 to 49 °C. At 20 °C, the DOC release was 35 ± 6μg C g−1biomasshr−1, 4.6 times higher than the nonstress temperature controlled incubations indoors, and not significantly differ- ent than nonstress outdoor incubations in full sunlight between 1100 and 1900 local time (pvalue = 0.07, ANCOVA). On the other hand, incubations that reached 43 °C and 49 °C released DOC at significantly higher rates than all other experiments, with exudation rates of 900 ± 200 and 1,700 ± 300μg C g−1biomass
hr−1, respectively (ANCOVApvalues = 0.01 and <0.01, respectively). It is possible that these high tempera- tures caused cell lysis and such a high increase in DOC concentrations. While pelagicSargassumsp. live and grow optimally between 24 and 30 °C (Hanisak & Samuel, 1987), these results suggest that DOC release by Sargassummay increase under heat stress especially when wracked in coastal areas during inundation events. Previous work indicated thatSargassumexudation rates are highest for midsenescentSargassum and lowest for severely senesced plants (Shank et al., 2010); thus, additional work is needed to better evalu- ate DOC release rates at all life stages.
3.2. Polyphenol Content inSargassumExudates
Sargassum DOM was isolated from 25 time points from our tank incubations using a SPE technique described above (Dittmar et al., 2008). DOC concentrations and phenolic content were then determined for SPE‐DOM samples using the Folin‐Ciocalteu (FC) reagent method (Takeda et al., 2013). Because concen- trations cannot be determined for all phenolic compounds in a sample containing a mixture of compounds, the FC reagent was standardized with phloroglucinol, and results are reported in molar equivalents.
Phenolic content correlated well with SPE‐DOC concentrations determined from these same SPE‐DOM (Figure S2), and average phenol concentration expressed as phloroglucinol equivalents was 5.3 ± 0.4% of the SPE‐DOC concentration, as determined by a linear regression of phenolic content versus SPE‐DOC con- centration for indoor and outdoor controlled incubation experiments (r2= 0.92; Figure S2). This percentage corresponded to an average phenolic content per unit carbon of 4.9 ± 1.5 mol/kg C. For comparison, phenol content expressed as gallic acid equivalents in SPE‐DOM riverine samples collected in the Hiroshima Prefecture, Japan ranged from 0.5 to 1.9 mol/kg C (Takeda et al., 2013). Although a different reversed‐phase SPE cartridge as well as gallic acid standards were used in this study, this difference suggests that polyphenol content is much higher forSargassumDOM than that for riverine DOM. Albeit for only a few samples, the average proportion of phenolic content inSargassumDOM when exposed to full sunlight (7%,n= 4, range = 5% to 10%) or high temperature (9%,n= 1) appears to increase, as average phenol concentrations were lower at 5% (n= 18, range = 2.6% to 6.5%) of the SPE‐DOM for all indoor incubations (pvalue <0.01, one‐way ana- lysis of variance).
Although the FC reagent has been widely used, it has been criticized owing to a number of limitations and interferences. For instance, the FC reagent is more reactive towards polyphenols with higher reduction potentials (i.e., those with more free hydroxyl groups) (Parys et al., 2007), so the measured phenolic content can vary widely based on the dominant polyphenols in a sample. Although phloroglucinol standards are a logical choice for analysis of brown algae phlorotannins, the FC reagent also reacts with monophenols to dif- ferent degrees so results will vary depending on the standard used (Singleton et al., 1998). The FC reagent can also react with nonphenolic reducing compounds (Singleton et al., 1998), thereby overestimating phenol concentrations. In more complex mixtures of polyphenols containing interfering substances such as sacchar- ides, the Folin‐Ciocalteu reagent can underestimate phenol concentrations by up to three‐fold (Lester et al.,
2012). Considering the oxygenated conditions of allSargassumincubations, partial oxidation of the phloro- tannins during release and extraction could also lower phenol yields, as measured by the FC reagent.
Phenolic content estimated by potentiometric titrations of standard and reference materials from the International Humic Substances Society (IHSS) ranged from 1.8 to 4.2 milli‐equivalents (meq) g−1 C (Ritchie & Perdue, 2003). As an additional test, we titrated a 500 mg/L solution of Suwannee River Natural Organic Matter (SRNOM, IHSS) from pH 3 to 10 and estimated a phenolic content of 4.0 meq g−1 C, in agreement with the 3.9 meq g−1C determined in this previous study (Ritchie & Perdue, 2003). The same titration repeated forSargassumSPE‐DOM resulted in phenolic contents that ranged from 3.5 to 5.4 meq g−1C for indoor incubations but was 10.2 meq g−1C forSargassumDOM collected from an outdoor incubation (Table 2), again suggesting a higher phenolic content inSargassumDOM when compared to ter- restrial DOM. Phenolic content may also be underestimated using this approach because it assumes that car- boxyl groups and no phenolic groups are titrated to pH 8 and that half the phenolic groups are titrated between pH 8 and 10 (Ritchie & Perdue, 2003). The ratio of phenolic to carboxyl content was 0.4 for the SRNOM sample determined here and previously (Ritchie & Perdue, 2003).SargassumDOM had a similar phenolic to carboxyl content ratio of 0.3 to 0.6, meaning that carboxyl groups are also abundant in SargassumDOM and phenolic content makes up 24 to 38% of titratable groups inSargassumSPE‐DOM.
3.3. Composition ofSargassumDOM Analyzed by FT‐ICR MS
We applied nontargeted ultrahigh‐resolution FT‐ICR MS in both positive and negative electrospray ioniza- tion (ESI) modes and a total of 3,462 molecular formulas were assigned tom/zions (Figure S3). The majority of assigned molecular formulas were found in all samples regardless of incubation conditions (Figure S3b) and only contained hydrogen, oxygen, and carbon (CHO, 54%), followed by CHO + nitrogen (CHNO, 39%), and CHO + sulfur (CHOS, 4%; Table S1). The remaining assignments included brominated com- pounds (CHOBr, 2%) that were identified in both positive and negative modes and nitrogen and sulfur con- taining compounds (CHNOS, 1%) that were only found in positive ESI mode. CHO formulas were most abundant in negative ESI mode (83% of assignments), and exhibited a diverse composition of molecular for- mulas when plotted in van Krevelen space (Figure 2a). The intensity‐weighted average O/C elemental ratio (O/Cwt) was 0.62 (Table S1), comparable to that determined for marine SPE‐DOM collected in the open Atlantic Ocean ranging from 0.54 in surface waters to 0.67 at 5,500 m (Hertkorn et al., 2013). However, mar- ine DOM is typically highly aliphatic with H/C ratios ranging from 1.2 to 1.7 (Hertkorn et al., 2013;
Lechtenfeld et al., 2014) whileSargassumSPE‐DOM was far more unsaturated, with an intensity‐weighted H/Cwtand a double‐bond equivalent (DBEwt) of ~0.83 and ~11, respectively (Table S1).SargassumDOM analyzed in negative ESI mode also had a relatively high intensity‐weighted average modified aromaticity index (AImod_wt) of 0.5 and aromaticity equivalent (XC_wt) of 2.6 when usingm = 0.5 in equation (6) (Table S1). AI/AImod≥0.5 andXC≥2.5 have been proposed as criteria for unequivocal identification of aro- matic compounds in samples analyzed by FT‐ICR MS (Koch & Dittmar, 2016, 2006; Yassine et al., 2014).
While these parameters are useful in comparing formula assignments between samples within a study, the resulting % aromatic compounds vary dramatically depending on the parameter selected and how sam- ples are analyzed. Using AI andXC(m= 1) results in 14% and 16% of negative ESI mode peak intensities identified as aromatic, respectively. However, using AImodand XC(m= 0.5) results in 44% (AImod) and 66% (XC) of peak intensities being identified as aromatic compounds.SargassumDOM analyzed in positive ESI mode was even more variable, with 3% of peak intensities having an AI value≥0.5, 16% having an AImod
value≥0.5, 27% having anXC(m= 1) value≥2.5, and 70% having anXC(m= 0.5) value≥2.5. Thus, use of these parameters should be interpreted with caution. Nonetheless, the high O/C ratios and low H/C ratios inSargassumDOM are indicative of a large contribution of hydrogen‐deficient and highly oxygenated com- pounds typically associated with an undefined pool of polyphenols, similar to high DOM freshwater systems such as the Rio Negro in the Amazon Basin (Gonsior et al., 2016).
Because CHO formulas occupy the largest region of van Krevelen space (Figures 2a and S4a–S4c), we grouped CHO formulas based on those common or unique between ESI negative and positive mode (Table S1 and Figure S4d). We found a high density of CHO compounds within the area of expected phlor- otannins (Figure 2a) identified in both ESI positive and negative mode as well as those unique to ESI nega- tive mode (Figure S4d). However, common formulas between both ESI modes had higher MWwt(~420m/z) than formulas unique to ESI negative mode (~350 m/z; Table S1). Assigned formulas with identical
molecular compositions in different mass spectra will probably not represent identical (single) compounds or specific ratios of more numerous compounds because very high numbers of isomers may be present for these sizable molecules (Hertkorn et al., 2007) that also will ionize differently in positive or negative ESI (Hertkorn et al., 2008). Phlorotannin molecular weights are expected to range between 126 (phloroglucinol monomer) and >100,000 Daltons (Da) (Van Altena & Steinberg, 1992); however, only phlorotannins with≤18 rings and a molecular weight of 1,117 Da have been annotated using ESI‐MS (Vissers et al., 2017). The observed mass range in our experiments coveredm/zions between 150 and 1,200 Da, but only m/z ions <700 m/z were observed within our FT‐ICR MS data set. The average molecular characteristics were similar between common CHO formulas and those only found in negative ESI mode (Table S1), but in either case their high modified aromaticity index (AImod_wt = 0.47 for common CHO formulas) and high DBEwt(11.4 for common CHO formulas) support the high abundance of phlorotannin‐related polyphenolic compounds (Table S1). The modified Kendrick plot (Shakeri Yekta et al., 2012), or the ratio of Kendrick mass defect to z* (KMD/z*) versus exact mass (Figure 2b), further underlines the presence of multiple rather extended (≥6 members) homologous CH2‐based series of CHO compounds, with Gaussian‐like intensity profiles among homologous series (Figure 2b; Gonsior et al., 2016). Phlorotannins are known strong antioxidants and hence can react rapidly with reactive oxygen species (Fujii et al., 2013; Kuda et al., 2006; Le Lann et al., 2016) to likely form new compounds containing additional oxygen (Schmitt‐Kopplin et al., 1998; Zhang & Blough, 2016) which might in particular reflect increased hydroxylation on the aromatic rings. To further investigate compositional relationships inSargassumDOM, nominal transformations were tested originating from CHO formulas Figure 2.Formula assignments for an average (four individual outdoor tanks) ultrahigh‐resolution mass spectrum of SargassumDOM analyzed in negative ESI mode. (a and c) van Krevelen diagrams (hydrogen to carbon, H/C, versus oxygen to carbon, O/C, ratios) and (b) modified Kendrick plots, KMD/z* versus exact mass (m/z) found in negative mode FT ICR‐MS data. In (a), blue dots represent formulas that contain only carbon, hydrogen, and oxygen (CHO); orange dots represent CHO + nitrogen (CHNO) formulas; green dots represent CHO + sulfur (CHOS) formulas; pink dots represent CHNOS formulas; and purple dots represent CHO + bromine (CHOBr) and black squares and white diamonds represent known CHO and CHOBr phlorotannins, respectively. Bubble size corresponds to peak intensity. The arrow in (b) highlights known phlorotannins (black squares) plotted on top of CHO series that corresponds to increasing phloro- glucinol rings in known phlorotannins. The van Krevelen diagram (c) illustrates hypothetical CHO compounds that can occur from nominal transformations of known phlorotannins plotted on top of CHO formulas (gray circles) and known phlorotannins (black squares). These transformations include additions of 1‐2 OH, 1‐2 H2O, and 1‐2 decarboxylations after ring opening and suggest that phlorotannins and their transformation products can occupy a large area within van Krevelen space.
that matched known phlorotannins. Although structures are not known, additions of OH, H2O and carbox- ylations are all conceivable (Figure 2c) given the oxygenated conditions and solar exposure during these experiments (Schmitt‐Kopplin et al., 1998; Zhang & Blough, 2016). Thus, simple oxidative transformations of phlorotannins like oxygenation (nominal insertion of oxygen in−C–H bonds) and carboxylation (nom- inal insertion of CO2in−C–H bonds) will expand the chemical space of CHO compounds towards higher O/C ratios in van Krevelen diagrams, while leaving the H/C ration unaffected (Figures 2a, and 2c, S4a, and S4d). These reactions also support an increased propensity for ionization of transformedSargassum polyphenolic compounds.
A number of aromatic brominated compounds was also confirmed in all Sargassum DOM samples (Figure 2a). CHOBr compounds (6% of ESI negative mode formula assignments) had a similarly high O/Cwtof 0.68, but lower H/C ratios (0.62) than CHO compounds given that Br often substitutes for H.
Although the abundance of CHOBr compounds was low compared to CHO compounds (Figure 2), haloge- nated phlorotannins have been described (La Barre et al., 2010) and may well be involved in the synthesis pathway of phlorotannins which remains largely unknown (Berglin et al., 2004; Meslet‐Cladiere et al., 2013; Salgado et al., 2009). Release of reactive volatile organic halogens from brown algae exposed to visible and ultraviolet radiation has also been documented (Laturnus et al., 2010). Previous work has shown that the brown algae release bromophenolic compounds, but only halogenated phloroglucinol, monomeric bro- mophenols, and specific halogenated phlorotannins were targeted (Shibata et al., 2006). CHNO (3% of nega- tive mode assignments) and CHOS (8% of ESI negative mode formula assignments) formulas both had (O/C)
wtratios that centered around 0.4, but had higher (H/C)wtfor CHOS formulas (1.6) than for CHNO formulas (1.3). Their low abundance and presumably aliphatic nature indicate that these CHOS compounds could make up a pool of labile DOM that might be rapidly utilized (Hertkorn et al., 2013). It should be noted that these compounds may arise fromSargassumitself or from associated biomass (e.g., epiphytes). Therefore, our results indicate that SPE‐SargassumDOM has a high chemodiversity with a particularly complex com- position of reduced and highly oxygenated compounds that may resemble a complex suite of phlorotannins.
Although FT‐ICR MS analysis is extremely information rich, it is at best a semiquantitative approach and does not supply structural information beside that what can be inferred from assigned molecular formulas.
Hence, quantitative estimates of the polyphenol content ofSargassumSPE‐DOM were undertaken using1H and13C NMR spectra, as described below.
3.4. Structural Characteristics ofSargassumSPE‐DOM Analyzed by1H and13C NMR Spectroscopy The1H and13C NMR spectroscopy were also used to estimate the phenolic component ofSargassumDOM, in order to independently and perhaps more accurately quantify the polyphenolic content inSargassum SPE‐DOM. As mentioned previously, phlorotannins carry an unique 1,3,5‐trioxo‐aromatic substitution, which is retained in virtually all of the ~150 known phlorotannins (Isaza Martínez & Torres Castañeda, 2013) of different size and oxygenation. Aromatic rings (Car) are either directly connected (Car‐Car; biaryl) or form arylether bonds (Car‐O‐Car) (Isaza Martínez & Torres Castañeda, 2013). Key structural motifs com- prise furans resulting from polymerization of C‐C‐bond hydroxylated aromatic compounds and 1,4‐dioxines resulting from condensation of hydroxylated aryl ethers. Because at least four aromatic positions have to be occupied by non‐hydrogen substituents (a minimum of three in terminal arylethers), all larger‐size phloro- tannins show considerable hydrogen deficiency (Figure 3b). NMR spectra show a notable distinction of non‐ exchangeable (e.g.,‐ZCH units; Z: any atom) and exchangeable (e.g.,‐XH units; X: O, S, N) hydrogen atoms in organic molecules which does not appear in common FT‐ICR mass spectra. In methanolic solution of SPE‐DOM, all exchangeable protons present combine with the residual water to produce a single rather broadened resonance atδH~4.9 ± 0.3 ppm, which is rather well attenuated in1H NMR spectra acquired with solvent suppression as used here. All non‐exchangeable protons except those which reside very close to the solvent NMR resonance will be observed in standard 1‐D and 2‐D NMR spectra. Hence, while common oxi- dative reactions (like oxygenation and carboxylation) will not change the H/C ratio of molecules in FT‐ICR mass spectra (cf., above), the count of NMR‐observable nonexchangeable protons decreases because−C–H units are being transformed into−C–O–H units. It is noteworthy that FT‐ICR mass spectrometry‐based methods exist to determine the extent and some structural attribution of exchangeable protons in organic matter (Zherebker et al., 2017); similarly, a wide range of NMR spectra readily detect abundance and chemi- cal environments of exchangeable protons in organic molecules as well. Hence, polymerization and
oxidation further decrease the abundance of non‐exchangeable protons in molecules and make detection of evolved phlorotannins by1H NMR spectroscopy eventually impractical. The combined electron‐donating resonance effects of two ortho‐ and one para‐oxygen substituents in 1,3,5‐trioxo‐phlorotannins produce NMR chemical shiftsδH/Cthat are normally attributed to either olefinic protons (=CH;δH~5.8–6.1 ppm) or anomeric positions in carbohydrates (O2CH;δC~ 90–100 ppm) but not to benzene derivatives.
Under realistic outdoor conditions comprising exposure to sunlight and oxygen,Sargassumexudates pro- duced a highly diverse mixture of biomolecules produced bySargassumitself, epiphytes and other microor- ganisms that have colonized theSargassumplants. Hence, NMR spectra showed the expected fundamental primarily aliphatic metabolite classes of lipids (abundant), peptides (discernible but not prominent) and car- bohydrates (abundant; Figures S7 and S8). The presence of these labile compounds implies thatSargassum exudates support oceanic microbial food webs with a large diversity of readily bioavailable molecules (Hanson, 1977). In addition,Sargassumextracts showed fairly well developed signals that can be attributed to carboxyl‐rich alicyclic compounds (CRAM) (Hertkorn et al., 2006), oxygenation products of carotenoids (Arakawa et al., 2017), and other oxyomethylene and oxomethine groups (Figure S8). General aromatic molecules, unsaturated natural products, and specifically phlorotannins present inSargassumextracts were altogether much more abundant than aromatic molecules in common aquatic and marine organic matter (Table S2 and Figures S5, S6, and S11; Hertkorn et al., 2013).
The1H NMR‐derived content of phlorotannins (for in‐depth analysis of NMR spectra; see supporting infor- mation) ranged from 2.3% to 6.1% for individualSargassumextracts, while the consolidated extract showed 5.3% abundance (Tables 2 and S3). Regarding the low H/C atomic ratios and paucity of aromatic C‐H (CarH) groups in oxidized phlorotannins, these1H NMR‐derived proportions are expected to underrepresent its actual abundance. Hence 13C NMR spectra were needed and provided evidence of the consolidated Sargassumextract to have ~18% phlorotannin content, with a minimum of >80% quaternary carbon atoms (i.e., carbon atoms attached directly to 4 other carbon or oxygen atoms) which resonated fromδC~130–165 Figure 3.The1H and13C nuclear magnetic resonance spectra ofSargassumDOM. (a) The1H13C HSQC NMR spectrum (800 MHz, CD3OD) of Csp2Hunits in consolidatedSargassumextract, with section of phlorotannins indicated; Cq denotes quaternary carbon atoms and shaded areas in DEPT (blue) and QUATD (brown)13C NMR spectra denote relative proportions of protonated and quaternary carbon, indicating less than 0.5 protons per aromatic ring in phlorotannins on average. The dotted box and inset shows three key substructures of phlorotannins also shown in (b) (b1–b3; for full annotation, cf. supporting information).
Additional substructures highlighted with dashed circles are explained in Figure S9. Green shaded area indicates range of chemical shift that is accessible to single aromatic rings (SPARIA: substitution patterns in aromatic rings by increment analysis; Perdue et al., 2007). (b) highlights the section of 1,3,5‐trioxoaromatic compounds (i.e., phlorotannins) with key substructures. (c) shows a few known phlorotannins, and while they may not be present in ourSargassumDOM samples, these model structures indicate ranges ofδH/Caccording to three major classes of substitution indicated by color (δH/C~5.9–6.3/93 ± 1.5 ppm,δH/C~5.8–6.2/98 ± 2 ppm, andδH/C~6.0–6.4/101 ± 2 ppm). These included an array of 3,5‐dihydroxybenenes attached via oxygen at C1 and substituted 1,4‐dioxins (section b1(also resonating in section b2), 15%), carbon‐bound 2,4,6‐trihydroxybenzenes (section b2, 45%), and oxidized phlorotannins, with≥4 oxygen atoms (section b3, 40%).
ppm (Car‐O units) andδC~100–140 ppm (Car‐C units; Table S4). In isolated 1,3,5‐trioxo aromatic rings, these resonated atδC~95–120 ppm (Car‐C units) while a high diversity of poly‐oxygenated aromatic rings with≥4 oxygen atoms producedδC~140–165 ppm (Car‐O units; supporting information). Notably, oxidized phloro- tannins are more hydrogen‐deficient than ordinary ones and therefore produce also smaller HSQC cross peaks at equal molar concentration. Terminal aromatic rings of phlorotannins often show local C2 symme- try which frequently causes two protons to resonate at identical frequencies (e.g., at 3,5‐or 2,6‐positions), providing NMR resonances with double amplitude. The structural regularity of common phlorotannins with distinct trioxo aromatic rings separated by aryl‐aryl or arylether bonds allows for extrapolation of δH/C
values. So far, HSQC cross peaks of any DOM investigated at our institute (>300) with analogousδH/Chave only been observed in Suwannee River water in which these probably represented catechins and other ter- restrial derived tannins (Figure 7 in Perdue et al. (2007)).
Remarkably, at least 40% of exudated phlorotannins were oxidized moieties with≥4 oxygen atoms per aro- matic ring (section b3; Figures 3 and S12). This is in agreement with an efficient reaction with reactive oxy- gen species and the known very high antioxidant properties of phlorotannins. Hydroxylation and/or carboxylation of the aromatic rings would lead to the oxygenation of phlorotannins, in particular under irra- diation in oxygenated conditions (Schmitt‐Kopplin et al., 1998; Zhang & Blough, 2016). Individual Sargassumextracts showed considerable variance of composition for all functionalities, reflecting a complex temporal evolution of a multiorganism mini ecosystem under our experimental conditions (Tables S2 and S3 and Figures S6–S12). Notably, a single sample showed near double the amount of phlorotannins compared with that found in the consolidated sample (Tables S2 and S3 and Figure S6), suggesting the capacity of Sargassum to produce even higher proportions of phlorotannins and DOM under certain conditions.
Remarkably, high abundance of phlorotannins went along with low proportions of a group of aliphatic esters and vice versa (Tables S2 and S3 and Figure S6). In general, NMR spectra confirmed considerably higher proportions of oxygenated and unsaturated protons and a substantially lower extent of aliphatic branching inSargassumextract when compared with DOM in Atlantic open ocean waters (supporting infor- mation). This conforms to a high share of metabolites present inSargassumextract which could be even- tually transformed into a more defunctionalized, evolved marine DOM.
3.5. SargassumContribution to DOC and Polyphenols in the Gulf of Mexico and North Atlantic Previous work suggested thatSargassumcolonies might be an important source of DOM to the blue waters of the Gulf of Mexico and Sargasso Sea (Shank, Lee, et al., 2010), so by simply assuming that annual biomass between 2 and 11 Tg (Butler & Stoner, 1984; Gower & King, 2011; Parr, 1939; Wang et al., 2018), and a DOC release rate of 12 ± 1μg C g−1biomasshr−1for one day (Figure 1b),Sargassumis capable of releasing 0.3 to 1.2 Tg C annually as DOC, which amounts to approximately 10% of its annual biomass. The estimated produc- tion of 0.3 to 1.2 Tg C fromSargassumis modest when compared to terrestrial DOC inputs to the ocean via river systems of 200 to 400 Tg C/year (Raymond & Spencer, 2015). However, a recent study reported that Sargassumcan account for ~18% of the particulate organic carbon in the Central Western Atlantic and the Caribbean Sea during bloom events, suggesting thatSargassumcan contribute significant quantities of organic carbon that has not been previously considered in climate models (Wang et al., 2018). This work is an excellent example of utilizingfield data with remote sensing data to improve estimates ofSargassum biomass and density (Wang et al., 2018), which will allow improved evaluation ofSargassum's contribution to various carbon pools in the future.
Estimates of terrestrial DOC in the ocean based on lignin phenols ranged from ~0.7 to 2.4% in the Pacific and the Atlantic, respectively (Opsahl & Benner, 1997), but it is not likely that 1,3,5‐trioxo aromatic rings of phlorotannins would be detected as lignin phenols. Recent work that has fractionated marine DOC by polar- ity found that low molecular weight hydrophilic DOC had depleted stable isotope values (−24 to−31‰) relative to hydrophobic and high molecular weight fractions (−23 to−21‰), especially below 1,000 m (Zigah et al., 2017) and evidence suggests that terrestrial DOM components persist in the deep Atlantic (Andrew et al., 2013) and Pacific (Cartisano et al., 2018). Zigah et al. (2017) attributed these depleted values in the hydrophilic fraction to allochthonous sources, such as terrestrial inputs, especially because lignin is typically 3 to 6‰depleted relative to bulk DOC (Spencer et al., 2009). The stable carbon isotope values for phlorotannins did not differ from that of the plant body for three marine brown algae species, which ranged