doi: 10.1002/lno.11652
Dissolved organic carbon (DOC) is essential to balance the metabolic demands of four dominant North-Atlantic deep-sea sponges
Martijn C. Bart ,
1* Benjamin Mueller ,
1Titus Rombouts,
1Clea van de Ven,
1,2Gabrielle J. Tompkins,
3,4Ronald Osinga,
5Corina P.D. Brussaard,
1,2Barry MacDonald,
3Anja Engel ,
6Hans Tore Rapp,
7Jasper M. de Goeij
11Department of Freshwater and Marine Ecology, Institute for Biodiversity and Ecosystem Dynamics (IBED), University of Amsterdam, Amsterdam, The Netherlands
2Department of Coastal Systems, Royal Netherlands Institute for Sea Research (NIOZ), Den Burg, The Netherlands
3Department of Fisheries and Oceans (DFO), Bedford Institute of Oceanography, Dartmouth, Nova Scotia, Canada
4Faculty of Science, Dalhousie University, Halifax, Nova Scotia, Canada
5Department of Marine Animal Ecology, University of Wageningen, Wageningen, The Netherlands
6Division of Marine Biogeochemistry, GEOMAR Helmholtz Centre for Ocean Research, Kiel, Germany
7Department of Biological Sciences, University of Bergen, Bergen, Norway
Abstract
Sponges are ubiquitous components of various deep-sea habitats, including cold water coral reefs, and form deep-sea sponge grounds. Although the deep sea is generally considered to be a food-limited environment, these ecosystems are known to be hotspots of biodiversity and carbon cycling. To assess the role of sponges in the car- bon cycling of deep-sea ecosystems, we studied the carbon budgets of six dominant deep-sea sponges of differ- ent phylogenetic origin, with various growth forms and hosting distinct associated microbial communities, in an ex situ aquarium setup. Additionally, we determined biomass metrics—planar surface area, volume, wet weight, dry weight (DW), ash-free dry weight, and organic carbon (C) content—and conversion factors for all species. Oxygen (O2) removal rates averaged 3.3 ± 2.8 μmol O2 g DWsponge h−1 (mean ± SD), live particulate (bacterio- and phytoplankton) organic carbon removal rates averaged 0.30 ± 0.39μmol C g DWsponge h−1and dissolved organic carbon (DOC) removal rates averaged 18.70 ± 25.02μmol C g DWspongeh−1. Carbon mass bal- ances were calculated for four species and revealed that the sponges acquired 1.3–6.6 times the amount of car- bon needed to sustain their minimal respiratory demands. These results indicate that irrespective of taxonomic class, growth form, and abundance of microbial symbionts, DOC is responsible for over 90% of the total net organic carbon removal of deep-sea sponges and allows them to sustain themselves in otherwise food-limited environments on the oceanfloor.
The oceanic seafloor constitutes by far the largest, and least studied, part of the Earth’s surface area. It covers an area of 361 million km2of which over 90% is found at water depths greater than 150 m (Costello et al. 2010; Ramirez-Llodra et al. 2010). On the northern Atlantic continental shelf, the seafloor is abundantly inhabited by sponges that form large mono-specific sponge grounds, create sponge reefs by deposit- ing thick spicule mats (i.e., layers of skeletal needles derived
from dead and damaged sponges), and are major components of deep-sea coral reefs (Thomson 1873; Buhl-Mortensen et al. 2010; Beazley et al. 2015). Deep-sea sponges fulfill important ecological roles in these habitats, as they provide substrate and habitat complexity to both mobile and sessile fauna (Klitgaard 1995; Beazley et al. 2013; Hawkes et al. 2019).
Moreover, thefirst estimations on respiration and organic car- bon uptake of deep-sea sponges (e.g., Pile and Young 2006;
Yahel et al. 2007; Kahn et al. 2015) suggest that they play a crucial role in benthic-pelagic coupling. However, due to tech- nical restrictions inherent to deep-sea work (e.g., costly ship- based expeditions, sampling under extreme conditions), data on the ecology and physiology of deep-sea sponges is still scarce. The few available studies on deep-sea sponge physiol- ogy consist of a mix of in situ and ex situ studies using differ- ent direct (collecting inhaled and exhaled water samples [Pile
*Correspondence: m.c.bart@uva.nl
This is an open access article under the terms of the Creative Commons Attribution License, which permits use, distribution and reproduction in any medium, provided the original work is properly cited.
Additional Supporting Information may be found in the online version of this article.
and Young 2006; Yahel et al. 2007; Leys et al. 2018]) and indi- rect (using flume experiments (Witte et al. 1997), or incuba- tion chambers (Kutti et al. 2013, 2015; Rix et al. 2016) methodologies. Still, data on the metabolic rates of deep-sea sponges is often incomplete, and does not reflect the diversity and wide array of morphological traits found in deep-sea sponges.
Deep-sea sponges mainly belong to two taxonomic classes:
demosponges (Demospongiae) and glass sponges (Hexactinellidae) (Lancaster 2014). Demosponges come in a wide variety of shapes and sizes—ranging from mm-thin encrusting sheets to m-wide barrels—, occur in freshwater and marine ecosystems, and their skeleton can consist of siliceous, calcium carbonate, or collagenous components (e.g., Müller et al. 2006; Ehrlich et al. 2010; Bart et al. 2019). Hexactinellids are exclusively marine, tubular, cup-, or vase-shaped, predomi- nantly inhabit deep-sea habitats, and their skeleton consists of silica spicules (e.g., Schulze 1887; Mackie and Singla 1983;
Leys et al. 2007). Sponges can be further classified as having either low or high abundances of associated microbes (LMA or HMA, respectively [Hentschel et al. 2003; Weisz et al. 2008]).
LMA sponges contain microbes with abundances and sizes comparable to ambient seawater (~ 0.5–1 ×10⁶cells mL−1), while HMA sponges can harbor up to four orders of magni- tude more and generally much larger microbes (Vacelet and Donadey 1977; Reiswig 1981; Hentschel et al. 2003). These symbionts are involved in various metabolic processes, includ- ing carbon (C) and nitrogen (N) metabolism (reviewed by Pita et al. 2018).
Sponges, including deep-sea species, are well-establishedfil- ter feeders, efficiently capturing and processing nano- and picoplankton (reviewed by Maldonado et al. 2012). Addition- ally, it has been shown that many shallow-water sponges pri- marily rely on dissolved organic matter (DOM) as a food source (reviewed by de Goeij et al. 2017). DOM, often mea- sured in the form of dissolved organic carbon (DOC), is the largest potential food source in the oceans (Hansell et al. 2009). However, DOC uptake has only been confirmed for one deep-sea sponge species (Hymedesmia coriacea [Rix et al. 2016]), but only qualitatively, using laboratory-made stable-isotope-enriched DOM. Consequently, direct evidence of ambient DOM uptake by deep-sea sponges is still not avail- able at present. For some species DOM uptake has been suggested (Leys et al. 2018), for others it was not found (Yahel et al. 2007; Kahn et al. 2015). However, these studies did not directly measure DOC, but derived the dissolved organic car- bon fraction from the total organic carbon fraction. Direct DOC measurements are challenging, as they are performed almost within detection limits of current analytical systems.
Both microbial abundance and growth form are suggested to affect the capability of sponges to utilize dissolved food sources. Higher DOM uptake is predicted for HMA sponges in comparison with LMA sponges, as microbes are considered to play an essential role in the processing of DOM (Reiswig 1974;
Freeman and Thacker 2011; Maldonado et al. 2012; Hoer et al. 2018). However, this distinction is not always clear, as the diet of some LMA sponges also consists mainly of DOM (e.g., de Goeij et al. 2008; Mueller et al. 2014). This is particu- larly found for sponges with an encrusting growth form (reviewed by de Goeij et al. 2017), since it is hypothesized that their high surface-to-volume ratio is advantageous for the uptake of DOM compared to lower surface-to-volume ratio of erect, massive (e.g., ball, cylinder) growth forms (Abelson et al. 1993; de Goeij et al. 2017).
To quantify the metabolic- and carbon removal rates of deep-sea sponges, we investigated the oxygen and dissolved and particulate organic carbon removal rates of six dominant North-Atlantic deep-sea sponges with different morphological traits (three massive HMA demosponges, two encrusting LMA demosponges, and one massive LMA hexactinellid) and com- posed carbon budgets using ex situ incubation experiments.
Additionally, we determined different biomass metrics for the six targeted species (planar surface area, volume, wet weight, dry weight, ash-free dry weight, and organic carbon content) and provide species-specific conversion factors.
Materials and methods
Study areas, sponge collection and maintenance
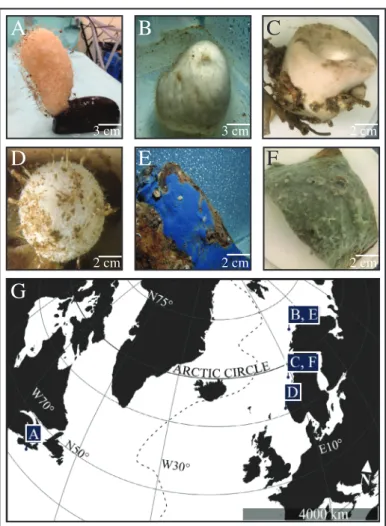
We investigated the following dominant North-Atlantic deep-sea sponge species (Fig. 1 and Table S1): Vazella pourtalesii(Hexactinellidae; LMA; massive vase),Geodia barretti (Demospongiae; HMA; massive globular), Geodia atlantica (Demospongiae; HMA; massive bowl), Craniella zetlandica (Demospongiae; HMA; massive globular), Hymedesmia paupertas (Demospongiae; LMA; encrusting sheet), and Acantheurypon spinispinosum(Demospongiae; LMA; encrusting sheet). Sponge specimens were collected by ROV during four research cruises in 2016, 2017 (two cruises), and 2018 (Fig. 1).
Whole V. pourtalesii individuals were collected in August 2016, attached to their rocky substrate at ~ 300 m depth, dur- ing the Hudson cruise 2016-019 (Kenchington et al. 2017) at the Emerald Basin on the Scotian Shelf, Canada (441908.7300N 6236018.4900W). Sponges were kept in the dark in a 500-liter flow-through holding tank onboard the vessel. The tempera- ture was maintained at 6C, and surface (~ 5 m depth) seawa- ter was added at a rate of 1.2 L min−1. The sponges were transported without air exposure to the Bedford Institute of Oceanography, Dartmouth, Nova Scotia, Canada. In the lab, sponges were kept in the dark in a 500-liter flow-through holding tank. Seawater pumped from the Bedford Basin was passed through a sand filter and 20μ bag filters and maintained at 6C. This water was continuously pumped into the sponge holding tank at 7 L h−1. A small magnetic drive pump was added to the bottom of the holding tank to provide circulation and horizontal flow across the sponges. Whole C. zetlandica individuals were collected during the Kristine Bonnevie cruise 2017610 (April 2017) at 6042012.500N
439009.900E in the province of Hordaland, Norway, and kept in 14-liter onboard flow-through aquaria with seawater pumped through at 120 L h−1. Temperature was maintained at 8C. Whole G. atlantica and A. spinispinosum individuals were collected attached to their rocky substrate during the G.O. Sars cruise 2017110 (August 2017) at the Sula reef (6442025.200N 759024.000E) of the Northern Norwegian coast at depths of 250–400 m. During the same cruise, G. barretti individuals were collected at the Barents Sea (7047020.800N 1803047.200E), at a depth of 272 m. The latter three sponge species were kept on board the research vessel in the dark in 20-literflow-through tanks in a climate room at 6C. North- Atlantic seawater was pumped in from a depth of 6 m at 30 L h−1. H. paupertas individuals were collected attached to rocky substrate during the G.O. Sars cruise 2018108 (August 2018) in the Barents Sea at 7047013.900N 1803023.800E. These sponges were kept on board the research vessel under similar
conditions as during the previous year. Ex situ experiments withG. atlantica,A. spinispinosum, andH. paupertasindividuals were performed on board. The other individuals were trans- ported without exposing them to air to the laboratory facilities at the University of Bergen, Norway, where the experiments took place. In Bergen, sponges were kept in a dark climate room (8C) in multiple 20-liter flow-through aquarium sys- tems. Each holding tank contained a maximum offive spon- ges. Flow originated from unfiltered water pumped from 200 m depth from the outer fjord near Bergen at ~ 50 L h−1 with a temperature ranging from 6C to 8C. All sponges and substrate were cleared from epibionts prior to incubations.
Incubations, sample treatment, and analysis
All sponges were allowed to acclimatize for a minimum of 1 week prior to the incubation experiments. During experi- ments, individual sponges were enclosed in flow chambers (either 2, 3, or 6 liter depending on sponge biomass) for 2–8 h (see below) with magnetic stirring devices to ensure proper mixing (de Goeij et al. 2013). Chambers were acid-washed (0.4 mol L−1HCl) prior to the incubations and kept in a water bath to maintain a constant seawater temperature during the incubations (6–9C depending on the incubation). Chambers were closed without trapping air in the system. The length of each individual incubation was determined during test incu- bations based on sponge size and oxygen removal (ideally timed to about > 10% to < 40% [O2] decrease). At set time intervals depending on the incubation length (tsample = 0, 30, 60, 90,120, 180, 240, 360, or 480 min), 85–100 mL water samples were taken with acid-washed 100-mL polycarbonate syringes. Sample water volume was replaced with aquarium water (drawn in by suction to maintain volume and eliminate air exposure). The concentration of bacterio- and phytoplank- ton in the water bath from which water is drawn in, is assumed to be the same as the concentration att0of the incu- bation, and remains constant over time. Consequently, during each sampling, a known number oft0plankton with the same volume as the sample drawn is added again to the incubation water at that time interval. Subsequently, the concentration of plankton at the beginning of the next time interval was re- calculated to correct for replacement water. These corrections were only performed for plankton, as the amount of DOC and O2added with the drawn in water, was too small to have an effect on the total concentration of each substance within the incubation chamber.
Seawater incubations without sponges were performed as controls at each location according to the aforementioned protocol (Canada,n= 4; on board incubations in 2017,n= 4;
on board incubations in 2018,n= 3; Bergen,n= 6).
Water samples were subdivided to analyze the concentra- tions of DOC and abundances of bacterio- and phytoplank- ton. Unfortunately, due to logistical issues (samples were lost during transport) and a malfunctioning autoanalyzer at the University of Amsterdam, we were not able to analyze all
G A
D E F
C B
3 cm 3 cm 2 cm
2 cm 2 cm
2 cm
Fig. 1. Photographs of six dominant North-Atlantic deep-sea sponge species used in the study (top) and their North-Atlantic sampling area (bottom). (A) V. pourtalesii, (B) G. barretti, (C) G. atlantica, (D) C. zetlandica(courtesy of Erik Wurz), (E)H. paupertas, (F)A. spinispinosum, (G) location where individuals of each sponge species were collected dur- ing four different research cruises. The dotted line represents the Mid- Atlantic Ridge.
DOC samples. For two species, C. zetlandica (n = 3) and H. paupertas(n= 3), no DOC samples could be measured, and we could only successfully analyze DOC samples (at GEOMAR Helmholtz Centre for Ocean Research, Kiel, Germany) for a subset of the total amount of individuals incubated for the other species; V. pourtalesii (n = 4/7), G. barretti (n = 3/12), G. atlantica(n= 4/6), andA. spinispinosum(n= 3/4).
Dissolved oxygen concentrations (O2) were continuously measured during the incubations with OXY-4 mini optical oxygen sensors (PreSens, Germany). Sensors do not consume oxygen and due to their small dimensions (Ø 2 mm),flow and mass-transport inside the chambers are not disturbed. O2con- centrations were recorded every 15 s (OXY-4-v2_30FB software).
Prior to DOC sampling, syringes, glassware, and pipette tips were rinsed three times with acid (8 mL, 0.4 mol L−1 HCl), three times with Milli-Q (80 mL), and twice with sample water (10 mL). Twenty milliliter of sample water was filtered (< 20 kPa Hg suction pressure) over pre-combusted (4 h at 450C) GF/F glass microfiber (~ 0.7μm pore-size)filter and col- lected in pre-combusted (4 h at 450C) amber glass EPA vials (40 mL). Samples were acidified with six drops of concentrated HCl (12 mol L−1) to remove inorganic C, and stored in the dark at 4C until analysis. DOC concentrations were analyzed using a total organic C analyzer and applying the high- temperature catalytic oxidation method (TOC-VCSH;
Shimadzu) modified from Sugimura and Suzuki (1988). Every 8–10 d the instrument was calibrated by measuring standard solutions of 0, 42, 83, 125, 208, and 417μmol C L−1, prepared from a potassium hydrogen phthalate standard (Merck 109017). Every measurement day, ultrapure (Milli-Q) water was used to determine the instrument blank (< 1μmol C L−1).
On every measurement day TOC analysis was validated with deep seawater reference (DSR) material provided by the Con- sensus Reference Materials Project of RSMAS (University of Miami) yielding values within the certified range of 42–45μmol C L−1. Additionally, two internal standards were prepared each measurement day using a potassium hydrogen phthalate (Merck 109017) with DOC concentration within the samples range. DOC of each sample was determined from 5 to 8 injections. The precision was < 4% estimated as the standard deviation of replicate measurements divided by the mean.
Duplicate 1 mL samples for bacterio- and phytoplankton werefixed at afinal concentration of 0.5% glutaraldehyde for 15–30 min at 4C in the dark. Afterfixation, the samples were snap-frozen in liquid nitrogen and stored at −80C until further analysis. Thawed samples were analyzed using a BD- FACSCaliburflow cytometer (Becton Dickinson, San Jose, Cali- fornia) with a 15-mW air-cooled argon laser (Brussaard 2004).
Phytoplankton were enumerated for 10 min at 80 μL min−1 with the trigger on Chlorophyll a, red autofluorescence (Marie et al. 1999). Phycoerythrin containing cells (e.g., cyanobacterialSynechococcus) were discriminated by their
orange autofluorescence. Bacterioplankton samples were diluted (5x or 10x, to keep the event rate at 200–800 events s−1) in sterile TE-buffer, pH 8.0 (10 mmol L−1 Tris, Roche Diagnostics; 1 mmol L−1 EDTA, Sigma-Aldrich) to avoid electronic coincidence, and stained with nucleic acid-specific SYBR Green I to afinal concentration of 1×10⁻⁴of the com- mercial stock (Marie et al. 1999; Brussaard 2004). Samples were corrected for blanks (TE-buffer with SYBR Green I) pre- pared and analyzed in a similar manner as the samples. Bacter- ioplankton samples were incubated in the dark for 15 min at room temperature after which samples were allowed to cool down at room temperature. Samples were analyzed for 1 min at 40μL min−1. Listmodefiles were analyzed using CYTOWIN freeware (Vaulot et al. 1989).
Sponge biomass metrics
After the incubations, sponges were removed from their substrate and analyzed for volume (by water displacement) and (dripping) wet weight. Sponges were photographed, and planer surface area was calculated with ImageJ on scaled pic- tures (Schneider et al. 2012). Then, all sponges were dried for 72 h in a drying oven at 60C to determine dry weight. Ran- domly selected 1-cm3 cubes (n = 6) of each massive sponge were transferred into a pre-weighed crucible and combusted at 450C in a muffle furnace (4 h). Combusted samples were cooled to room temperature in a desiccator and weighed (ash weight). Subsequently, ash-free dry weight was calculated by subtracting ash weight from dry weight and normalized to total volume of the original sponge specimen. The rest of the dried sponges was crushed and ground up with mortar and pestle and stored in a desiccator until further analysis.
Samples for organic C content analysis were decalcified with HCl (4 mol L−1) to ensure removal of inorganic C and subsequently lyophilized for 24 h in a FD5515 Ilchin Biobase freeze-drier. After freeze-drying, aliquots of approximately 10 mg were placed in tin-capsules and analyzed on an Elemen- tal Analyzer (Elementar Isotope cube, Elementar GmbH, Langenselbold, Germany) coupled to a BioVision isotope ratio mass spectrometer(Elementar Ltd, Manchester, UK).
Oxygen and carbon removal rates
Kinetics for each component were described according to its bestfitting mathematical model, integrated over the entire time frame of the incubation, to estimate and compare the most reliable initialfluxes of those components, based on the tangent of each model att0.
To calculate changes in O2concentrations over time, a lin- ear regression analysis was performed for each individual incu- bation. Resulting net O2 removal rates were subsequently compared between sponge and seawater control incubations with a Welch’s t-test for each species and a respective set of seawater controls. O2 removal rates were corrected for back- ground seawater respiration by subtracting the average respira- tion in the seawater controls from the sponge incubations.
Initial net live bacterio- and phytoplankton removal rates were calculated assuming exponential clearance of cells in incubations (Scheffers et al. 2004; de Goeij et al. 2008). The live planktonic fraction was dominated by two general cell types, heterotrophic bacteria and phytoplankton, the latter represented by Synechococcus-like cyanobacteria. To calculate net removal rates for each planktonic component, the average initial cell concentrations of all incubations were used as a starting point. Standardized data were fitted to an inverse exponential model to calculatefinal cell concentrations. Final concentrations were subtracted from the initial corrected concentrations and differences were compared between treatments (sponge vs. control incubations) using an unpaired t-test. Clearance rates (CR) were calculated according to Riisgård et al. (1993):
CR=Vw=t×ln Cð 0=CtÞ
Vw is the water volume in incubation chamber (in mL). t is the duration of incubation (in min).C0is the initial cell (bacterio- or phytoplankton) concentration (in cells mL−1).Ctis the cell concen- tration at time pointt(in cells mL−1).
A conservative estimate of live particulate organic carbon (LPOC) removal was obtained using established conversion factors. Heterotrophic bacterial cells were converted using 30 fg C per bacterial cell (Fukuda et al. 1998; Leys et al. 2018) and phytoplankton using 470 fg C perSynechococcus-type cell (Bertilsson et al. 2003; Pile and Young 2006).
Initial net DOC removal rates were calculated by applying a 2G-model (de Goeij and van Duyl 2007; de Goeij et al. 2008).
This is a simplified biexponential model to describe bio- processing of DOC over time, assuming that the complex and heterogeneous DOC pool comprises two major fractions: a fast- (Cf) and slow-removable (Cs) fraction, for labile and refractory components of DOM, respectively (de Goeij and van Duyl 2007; de Goeij et al. 2008). In an assumed well- mixed system, the fast and slow removal fractions of DOC will be consumed according to their specific removal rate con- stants kf and ks, respectively. The sum of the individual removal rates is used here to describe total DOC removal.
dDOC
dt =− kfCf+ksCs
Integrating this equation yields the function that describes the concentration of DOC as a function of time:
DOC tð Þ=Cf,0×e−kft+Cs,0×e−kst
Experimental data is described with the model by estimat- ing model variables Cf and Cs using a (10,000 iterations) minimalization routine (de Goeij et al. 2008). The initial DOC removal rate was calculated from the estimated values of these variables, based on the integration of the model over the
entire time frame of the incubation (tangent at t0), and is given by
FluxDOC=− kfCf,0+ksCs,0
Carbon mass balance
Total net organic carbon (TOC) removal rates were esti- mated as the sum of net initial LPOC and DOC removal rates.
O2removal served as a proxy for respiration assuming a bal- anced molar ratio of carbon respiration to net O2 removal (1 mol C respired equals 1 mol O2removed), yielding a respi- ratory quotient of 1 (Yahel et al. 2003; Hill et al. 2004).
RQ= moles of C respired per unit time moles of O2consumed per unit time= 1
To establish a mass balance for the different deep-sea sponge species, the quotientΔO2/ΔTOC was calculated using the (bi)exponential removal rates for LPOC and DOC. This quotient describes how much of the carbon intake is used for respiration. Sponges do not meet their minimal respiratory demands at ΔO2/ΔTOC > 1. At ΔO2/ΔTOC < 1, sponges take up more carbon than their minimal respiratory demands, meaning they can invest excess carbon in processes such as growth and reproduction. Carbon budgets where only calcu- lated for sponges of which we had complete sets of O2, LPOC, and DOC data (V. pourtalesii (n = 4), G. barretti (n = 3), G. atlantica(n= 4), andA. spinispinosum(n= 3)).
Results
Sponge biomass metrics
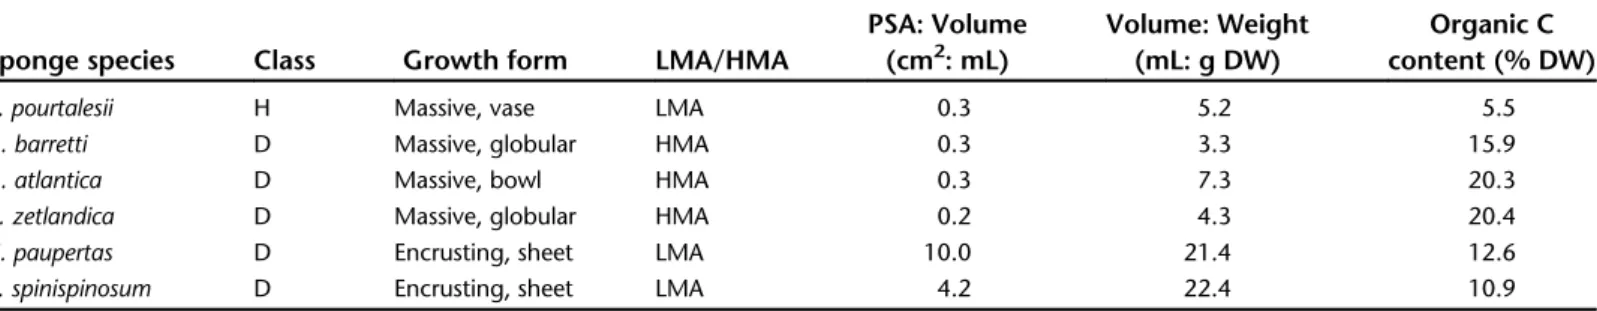
Sponge characteristics (phylogeny, growth form, abun- dance or associated microbes) and biomass metric conversion factors are given in Table 1. Average sponge biomass metrics;
planar surface area (PSA), volume, wet weight (WW), dry weight (DW), ash-free dry weight (AFDW), and organic carbon (C) content are shown in Table S1. Encrusting sponges have a one- to two-orders of magnitude higher planar surface area:
volume ratio (4.2–10.0) than massive sponges (0.2–0.3) and an order-of-magnitude higher volume: DW ratio (21.4–22.4 and 3.3–7.3, respectively). HMA sponges show a significantly higher organic C content than LMA sponges (t = −8.13, df = 27,p< 0.001; Table 1), with lowest values for the hexa- ctinellidV. pourtalesii.
Oxygen removal rates
The concentration of O2in the incubation chambers line- arly decreased with time for V. pourtalesii (t = 4.59, df = 7, p< 0.01), G. barretti(t = 3.69, df = 11, p< 0.01), G. atlantica (t = 5.11, df = 5, p< 0.01), C. zetlandica (t = 3.5, df = 3, p< 0.05), H. paupertas (t = 4.38, df = 2, p< 0.05) and A. spinispinosum, (t= 7.96, df = 5,p< 0.001) compared to sea- water control incubations. Average initial O2removal rates per
species are depicted in Table 2. Examples of O2concentration profiles during incubations for all species and controls are shown in Fig. S1. Initial O2removal rates for all sponges aver- aged 3.32.8 μmol O2g DWsponge h−1 (meanSD through- out text unless stated otherwise), ranging from 1.0 (C. zetlandica) to 7.8 (A. spinispinosum).
Plankton (LPOC) removal rates
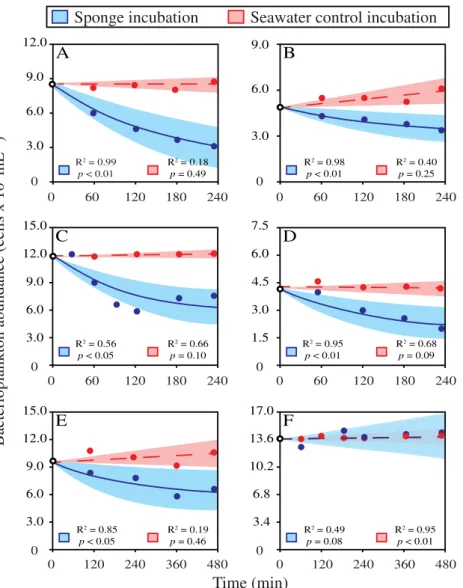
Bacterioplankton concentrations exponentially decreased in incubations with G. barretti (t = 2.44, df = 19, p< 0.05), V. pourtalesii(t= 5.91, df = 9,p< 0.001),G. atlantica(t= 6.62, df = 5,p< 0.01),H. paupertas(t = 2.81, df = 4,p< 0.05), and C. zetlandica (t = 4.25, df = 8,p< 0.01) compared to seawater control incubations (Fig. 2A–F). Incubations with A. spinispinosum showed no significant decrease in
bacterioplankton compared to control incubations (t = −0.72, df = 4, p = 0.51) (Fig. 2F). Average bacterioplankton C removal and clearance rates per species are presented in Table 3.
Initial bacterioplankton C removal rates averaged 0.250.35μmol C DWspongeh−1for all species, ranging between 0.00 (A. spinispinosum) and 0.82μmol C DWsponge h−1 (V. pourtalesii) (Table 3). Bacterioplankton clearance rates averaged 0.691.06 mL mLsponge−1 min−1 for all species, ranging from 0.00 (A. spinispinosum) to 2.22 mL mLsponge−1 min−1 (V. pourtalesii).
Compared to control incubations, phytoplankton (i.e., Synechococcus-type cyanobacteria) concentrations decreased exponentially in incubations withV. pourtalesii(t= 5.34, df = 9, p< 0.001),G. barretti(t= 2.20, df = 11,p< 0.05), andG. atlantica (t = 11.92, df = 6, p< 0.001). Incubations with C. zetlandica Table 1. Characteristics, biomass metrics and conversion factors for six dominant North-Atlantic deep-sea sponges.
H = Hexactinellidae, D = Demospongiae, LMA = low microbial abundance, HMA = high microbial abundance. Planar surface area (PSA) is the surface area covered in a 2D top view, volumes are measured by water displacement in mL and the weight is given as g dry weight (DW). Conversion factors are based on average biomass metrics (planar surface area, volume, wet weight (WW), DW, ash-free dry weight (AFDW), organic carbon (C) content) for all individuals used in the experiments shown in Table S1.
Sponge species Class Growth form LMA/HMA
PSA: Volume (cm2: mL)
Volume: Weight (mL: g DW)
Organic C content (% DW)
V. pourtalesii H Massive, vase LMA 0.3 5.2 5.5
G. barretti D Massive, globular HMA 0.3 3.3 15.9
G. atlantica D Massive, bowl HMA 0.3 7.3 20.3
C. zetlandica D Massive, globular HMA 0.2 4.3 20.4
H. paupertas D Encrusting, sheet LMA 10.0 21.4 12.6
A. spinispinosum D Encrusting, sheet LMA 4.2 22.4 10.9
Table 2. Overview of oxygen removal rates by deep-sea sponge species (meanSE). CA = Canada, NO = Norway. (1) Leys et al.
(2011), (2) Leys et al. (2018), (3) Kutti et al. (2013).
Sponge species
O2removal (μmol O2g DWsponge−1h1)
O2removal
(μmol O2mLsponge−1h−1) Original location T(C) Method Reference
V. pourtalesii(n= 7) 3.40.7 0.70.1 Emerald Basin (CA) 6.7 Incubation This study
A. vastus(n= 22) – 0.1 Fraser Ridge Reef
(CA)
9.0 In-ex* 1
G. barretti(n= 12) 1.30.2 0.50.1 Barents Sea (NO) 9.0 Incubation This study
G. barretti(n= 17) 1.40.3 0.30.1 Langenuen fjord
(NO)
8.0–9.0 In-ex 2
G. barretti(n= 6) 1.5 – Continental Shelf
(NO)
6.9–7.4 Incubation 3
G. atlantica(n= 6) 5.80.9 0.80.1 Sula reef (NO) 6.0 Incubation This study
C. zetlandica(n= 4) 1.00.3 0.20.1 Continental Shelf
(NO)
9.0 Incubation This study
H. paupertas(n= 3) 5.91.5 1.50.6 Barents Sea (NO) 6.0 Incubation This study
A. spinispinosum (n= 4)
7.80.8 0.40.0 Sula reef (NO) 6.3 Incubation This study
*Experiments performed in situ.
(t = 1.23, df = 3,p= 0.31) and A. spinispinosum(t = 1.56, df = 7, p= 0.16) showed no significant decrease compared to seawater control incubations. Average phytoplankton C removal and clearance rates per species are presented in Fig. S2 and Table 3. Initial phytoplankton C removal rates averaged 0.040.07μmol C g DWspongeh−1for all species, ranging from 0.00 (A. spinispinosum/C. zetlandica) to 0.15μmol C DWsponge h−1 (V. pourtalesii) (Table 3). Phytoplankton clearance rates averaged 0.540.96 mL mLsponge−1min−1for all spe- cies, ranging between 0.00 (A. spinispinosum) and 1.77μmol mL mLsponge−1min−1(V. pourtalesii).
Combined initial plankton removal rates amounted to total live particulate organic carbon (LPOC) removal rates of, on average, 0.300.39μmol C g DWsponge h−1, ranging from 0.00 (A. spinispinosum) to 0.97μmol C g DWsponge h−1 (V. pourtalesii).
Dissolved organic carbon (DOC) removal rates
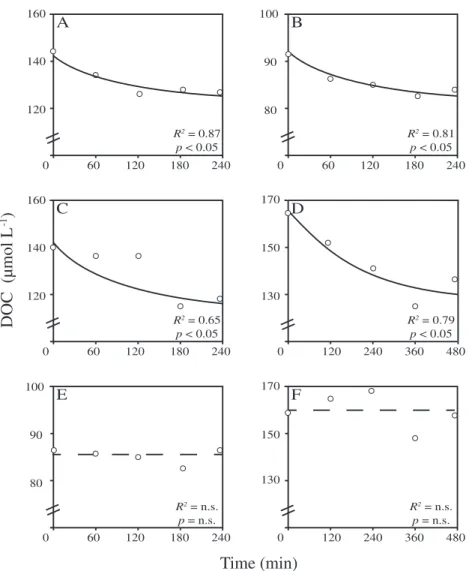
Changes in DOC concentration over time during incubations with four different species (V. pourtalesii (n = 4), G. barretti (n= 3),G. atlantica(n= 4), andA. spinispinosum(n= 3)) signifi- cantly fitted the biexponential 2G-model and thereby showed significant removal of DOC, while no DOC removal occurred in the seawater controls (Figs. 3 and S3). Initial DOC removal rates averaged 18.7025.02μmol C g DWsponge h−1 for all sponges, ranging from 3.70 (G. barretti) to 56.07μmol C g DWsponge h−1 (A. spinispinosum) (Table 3).
Carbon mass balance
Carbon mass balances were only constructed for individ- uals for which a complete set of O2, LPOC, and DOC was available. Note that initial removal rates depicted in Table 4
Time (min) C
R2 = 0.56
p < 0.05 R2 = 0.66 p = 0.10
D
R2 = 0.95
p < 0.01 R2 = 0.68 p = 0.09
E
R2 = 0.85 p < 0.05
R2 = 0.19 p = 0.46
B
R2 = 0.98
p < 0.01 R2 = 0.40 p = 0.25
12.0
A
9.0
R2 = 0.99 p < 0.01
6.0
R2 = 0.18 p = 0.49
F
R2 = 0.49 p = 0.08
R2 = 0.95 p < 0.01
Sponge incubation Seawater control incubation
3.0
Bacterioplankton abundance (cells x 10
5mL
-1)
0 60 120 180 240
0
0 60 120 180 240
15.0
3.0
15.0
3.0
0 60 120 180 240
0 60 120 180 240
0
0
9.0
6.0
3.0
0
0
10.2
0
0 120 240 360 480 0 120 240 360 480
6.0 12.0
6.0 12.0
6.0
6.8 13.6 9.0
9.0
3.4 17.0
1.5 3.0 7.5
4.5
Fig. 2.Average abundances of bacterioplankton over time during incubations with six dominant North-Atlantic deep-sea sponge species (blue) in com- parison to seawater control incubations (red). (A)V. pourtalesii(n= 7), (B)G. barretti(n= 12), (C)G. atlantica(n= 6), (D)C. zetlandica(n= 4), (E) H. paupertas(n= 3), and (F)A. spinispinosum(n= 4). Decrease of bacterial abundance over time during incubations is modeled with an exponentialfit, shades depict 95% confidence intervals of the model. Note thatx- andy-axis show different ranges per species.
are thus based on these measurements only and can deviate from those depicted in Tables 2 and 3. For the four assessed species, more than 90% of the average net total organic carbon (TOC) removal was accounted for by DOC (V. pourtalesii 92.05.5%, G. barretti99.50.5%,G. atlantica93.68.4%,A. spinispinosum 100%) (Table 4). Assuming a respiratory quotient of 1 in combina- tion with exponential removal of LPOC and DOC during the incubations, all four species were found to match their minimal required C uptake (ΔO2/ΔTOC ≤1.0), but only when DOC was included in the mass balance. The HMA species show 2–5 times higherΔO2/ΔTOC ratios than the two LMA species.
Discussion
In this study we show, for the first time, that multiple, dominant, North-Atlantic deep-sea sponge species, irrespective of taxonomic class, growth form, and abundance of microbial symbionts, are capable of consuming ambient DOC, and that this consumed DOC—representing more than 90% of the total organic carbon uptake—is essential to satisfy their mini- mal respiratory demands. We hypothesize that the combined pallet of dissolved and particulate food allows deep-sea spon- ges to thrive in otherwise food-limited environments.
Deep-sea sponges oxygen and carbon removal rates
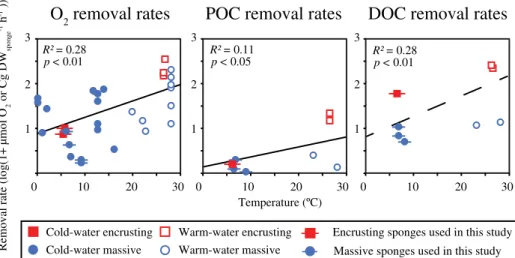
Deep-sea sponge respiration rates (i.e., using O2uptake as proxy for respiration) show consistency throughout literature, as most are roughly within the same order of magnitude (Table 2), regardless of the experimental method used. When comparing respiration rates of deep-sea sponges to those reported for temperate (e.g., Thomassen and Riisgård 1995;
Coma 2002) and tropical sponges (e.g., Reiswig 1974; Yahel et al. 2003), rates of deep-sea sponges are consistently one to two orders of magnitude lower (Fig. 4). Correspondingly, DOC and plankton carbon removal rates of deep-sea sponges are lower than those found for tropical species (e.g., de Goeij et al. 2008; Hoer et al. 2018; Fig. 4). Differences in O2 and plankton carbon removal rates can be explained by the
positive effect of temperature on metabolism and physiologi- cal processes (see also Clarke and Fraser 2004). DOC removal rates seem to follow a similar trend, yet due to the very limited amount of data available, the relation with temperature was not found to be significant.
In general, O2, planktonic carbon and (specifically) DOC fluxes appear to be higher for encrusting sponges compared to massive growth forms (Fig. 4). For example, the deep-sea encrusting spongeA. spinispinosumhas an order-of-magnitude higher DOC flux than massive deep-sea species (56.1 μmol C g DWsponge h−1 vs. 3.7–9.2- μmol C g DWspongeh−1), as is the case for encrusting tropical species (218.3–253.3 μmol C g DWsponge h−1, de Goeij et al. 2008) compared to massive tropical species (10.0–- 11.9 μmol C g DWsponge h−1, Yahel et al. 2003; Hoer et al. 2018). This corroborates earlier suggestions that high surface-to-volume ratios enable encrusting sponges to have higher removal efficiencies compared to massive species (Abelson et al. 1993; Kötter et al. 2003; de Goeij et al. 2017).
In addition to morphology, higher net DOC removal rates are generally predicted for HMA sponges in comparison with LMA sponges, as microbes are considered to play an important role in the processing of DOM (e.g., Reiswig 1974; Hoer et al. 2018). However, both LMA species used in this study, A. spinispinosumandV. pourtalesii, showed high removal rates of DOC (56.1 and 9.2 μmol C g DWsponge h−1, respectively), despite their different growth forms (encrusting vs. massive) and different phylogeny (demosponge vs. hexactinellid).
Interestingly, other hexactinellids were previously not found to consume DOM (Yahel et al. 2007). However, Yahel et al. (2007) did not directly measure DOC, but derived it from TOC analysis, potentially resulting in an underestimation of actual DOC removal rates. Our results thereby add to the increasing body of evidence that also sponges with low micro- bial abundances are capable of consuming DOC (e.g., de Goeij et al. 2013; Rix et al. 2016; Morganti et al. 2017; Rix et al. 2020). However, we conclude that there are still too few available sponge carbon fluxes to fully understand the key Table 3.Average initial (meanSD) dissolved organic carbon (DOC), bacterio- and phytoplankton carbon (BC and PC, respectively) removal rates, and bacterio- and phytoplankton clearance rates of six dominant North-Atlantic deep-sea sponge species. Initial removal rates for bacterio- and phytoplankton are based on exponential uptake during incubations, whereas initial removal rates for DOC are based on a biexponential 2G-model uptake. NA: Not available.
Sponge species
DOC removal rate
BC removal rate
PC removal rate
Bacterioplankton clearance rate
Phytoplankton clearance rate (μmol C g DWsponge−1h−1) (mL mLsponge−1min−1)
V. pourtalesii 9.172.69 0.820.43 0.150.18 2.221.25 1.771.37
G. barretti 3.700.26 0.020.02 <0.01 0.150.17 0.170.15
G. atlantica 5.855.55 0.120.08 0.110.13 0.080.03 0.250.24
C. zetlandica NA 0.020.02 0.00 0.060.06 0.050.11
H. paupertas NA 0.550.42 NA 0.150.10 NA
A. spinispinosum 56.0719.92 0.00 0.00 0.00 0.00
functional traits, such as abundance of microbial symbionts or morphology, that determine the strategy of sponges to process DOM (discussed in de Goeij et al. 2017).
Deep-sea sponge carbon budgets
The contribution of DOC to the total organic carbon removal of the investigated sponges (92–100%) is at the high
end of the range reported for shallow water sponges (56–97;
see table 1 in de Goeij et al. 2017). Indirect measurements recently suggested that DOC accounts for 95% of the TOC removal ofG. barretti(Leys et al. 2018), which is very close to the fluxes presented here. The minimal respiratory carbon demands for all species with a complete O2, LPOC and DOC dataset were, by far, met (Table 4). Both HMA species show
Time (min) DOC (µmol L
-1)
A
0 60 120 180 240
B
0 60 120 180 240
C
0 60 120 180 240
D
0 120 240 360 480
E
0 60 120 180 240
F
0 120 240 360 480 R2 = 0.87
p < 0.05 140
120
R2 = 0.81 p < 0.05
R2 = 0.65 p < 0.05
R2 = 0.79 p < 0.05
R2 = n.s.
p = n.s.
R2 = n.s.
p = n.s.
100
90
80
100
90
80
140
120
150
130
150
130 170
170 160
160
Fig. 3.DOC removal over time by four dominant North-Atlantic deep-sea sponge species compared to seawater controls in ex situ incubations. (A) V. pourtalesii, (B)G. barretti, (C)G. atlantica, (D)A. spinispinosum, and (EandF) seawater control. Trend lines are given by a 2G-modelfit.
Table 4.Mass balance based on minimal respiratory demands of four dominant North-Atlantic deep-sea sponge species. Note that mass balances were only based on individual sponges with a complete set of data for: oxygen (O2) dissolved organic carbon (DOC), bacterio- and phytoplankton organic carbon (LPOC). Mass balances were constructed from initial rates based on linear O2, exponential LPOC and biexponential (i.e., 2G-model) DOC removal rates (averageSD). Total organic carbon (TOC) removal rates are calculated as the sum of initial LPOC and DOC removal rates.
Sponge species O2(μmol O2g DWsponge−1h−1) TOC (μmol C g DWsponge−1h−1) Mass balanceΔO2/ΔTOC
V. pourtalesii(n= 4) 3.191.96 10.002.44 0.32
G. barretti(n= 3) 1.931.09 3.720.24 0.52
G. atlantica(n= 4) 4.761.76 6.075.55 0.78
A. spinispinosum(n= 3) 8.441.04 56.0719.92 0.15
higherΔO2/ΔTOC ratios than the two LMA species. These dif- ferences might be explained by aerobic microbial processes in HMA sponges, such as nitrification (Hoffmann et al. 2009) or ammonia oxidation (Mohamed et al. 2010), which require O2
in addition to the O2 demand based on carbon respiration.
Moreover, the organic carbon uptake needed to balance respi- ration requirements of HMA sponges is potentially further reduced by sponge-associated chemoautotrophs using inor- ganic carbon sources, which are transferred to the sponge host (van Duyl et al. 2008; Pita et al. 2018; Shih et al. 2020). How- ever, van Duyl et al. (2020) found inorganic carbon uptake to represent only 2–3% of deep-sea sponge carbon budgets.
Bacterio- and phytoplankton contributed only a small frac- tion (< 10%) to the TOC removal. However, these particulate food sources may contain valuable nutrients, such as vitamins, fatty acids, and amino acids (Pütter 1925; Phillips 1984), which are essential for anabolic processes that require organic carbon, such as growth, cell-turnover, and reproduction.
Therefore, a complete carbon budget should include these pro- cesses. However, deep-sea sponges most likely grow slowly (Leys and Lauzon 1998), and we assume that within the short (2–8 h) timeframe of our incubations, growth is negligible. For several shallow water encrusting sponges, a rapid cell turnover and the subsequent release of“old”cells as detritus was shown (de Goeij et al. 2009, 2013; Alexander et al. 2014; Rix et al. 2016). This loss of carbon could have a major impact on carbon budgets. In fact, Rix et al. (2016) found that the deep- sea encrusting sponge H. coriacea converted 39% of organic carbon derived from deep-sea coral mucus into detritus, and detritus production by deep-sea sponges has been argued to have a major contribution to the total sedimentation rate of the Greenland–Iceland–Norwegian seas (Witte et al. 1997).
However, work by McMurray et al. (2018) suggests that mas- sive sponges that are not space-limited may not show rapid cell turnover and detritus production, and Leys et al. (2018) reported no production of new cells during experiments with G. barretti, suggesting minimal cell turnover in the investi- gated time frame. In conclusion, reports on deep-sea sponge detritus production and cell turnover are contradictive and still very limited, which does not warrant generalizations at this point. Likewise, only limited data is available on the reproduction of deep-sea sponges (Spetland et al. 2007) as well as seasonal changes in metabolic rates (Morley et al. 2016).
Interpretation of sponge metabolic rates at organism and ecosystem scale
Our understanding and interpretation of metabolic rates at both organism and ecosystem scale is currently hampered by two issues. Firstly, the use of a multitude of sponge biomass metrics (e.g., m2, cm3, wet weight, dry weight, ash-free dry weight) in combination with a lack of conversion factors makes it almost impossible to compare metabolic rates between different sponge species, and to upscale fluxes from organism to ecosystem level. The use of a specific metric may depend on the context and the research question at hand. For example, when extrapolating individualfluxes to the ecosys- tem level, planar surface area is potentially the most practical standardization metric in use (read: fast and low-cost). Abun- dance data in deep sea, but also in shallow-water, habitats are usually collected via 2D video surveys or photo quadrants using ROVs (van Soest et al. 2007; Roberts et al. 2009). How- ever, 2D planar surface area severely underestimates the vol- ume and (organic) biomass of erect vs. flat organisms (e.g., massive vs. encrusting sponges; see also discussion in de Removal rate (log(1+ µmol O2 or Cg DWsponge-1 h-1 ))
Temperature (ºC)
O
2removal rates POC removal rates
R2 = 0.11 p < 0.05
DOC removal rates
R2 = 0.28 p < 0.01 R2 = 0.28
p < 0.01
0 10 20 30 0 10 20 30 0 10 20 30
1 2 3
1 2 3
1 2 3
Cold-water massive Warm-water massive Massive sponges used in this study Cold-water encrusting Warm-water encrusting Encrusting sponges used in this study
Fig. 4. Oxygen, particulate, and dissolved organic carbon (POC and DOC) removal rates for cold-water (< 15C) and warm-water (> 15C) marine sponges plotted against temperature. Removal rates are log transformed. Red squares depict encrusting sponges, blue circles depict massive sponges (i.e., all non-encrusting growth forms).R2values are based on the linear regression of all values (encrusting + massive). Regression lines are given by log (1 +μmol O2 g DWsponge−1 h−1) = 0.033 * T(C) + 0.90, (log(1 +μmol POC g DWsponge−1 h−1) = 0.017 * T(C) + 0.21 and (log(1 +μmol DOC g DWsponge−1h−1) = 0.041 *T(C) + 0.77. All non-log-transformed rates are given in Table S2.
Goeij et al. 2017). Arguably the best metric to standardize met- abolic rate is organic biomass (i.e., ash-free dry weight) or organic carbon content, excluding ecologically inert hard con- stituents, such as silica spicules (Rützler 1978). However, an increase in inorganic spicule content requires additional ener- getic costs at the expense of organic material (McDonald et al. 2002; Carballo et al. 2006). Therefore, in ecological terms, volume, wet weight and dry weight provide alterna- tives. Volume and wet weight are compromised by effects of large variations in shape, form and tissue densities and com- positions of sponges (Diaz and Rützler 2001). We therefore use dry weight here as comparative measure and suggest that future physiological studies on sponges best provide a combi- nation of metrics and/or conversion factors between these metrics.
Secondly, the extrapolation offindings from ex situ studies to in situ conditions is challenging for a number of reasons.
Ex situ experiments are usually performed on smaller sponges (~ 0.1 kg wet weight in this study), while, for example, G. barrettispecimens of 24 kg wet weight have been found in situ (Klitgaard and Tendal 2004). Sponge metabolism per mass unit has been found to decreases with increasing mass (Frost 1980; Morganti et al. 2019). Although we did notfind a significant size effect on O2 consumption (Fig. S4), both size and temperature are important factors to consider before fluxes can be upscaled to the ecosystem level. Furthermore, we incubated four of our six sponge species in surface water.
These surface waters may contain (1) higher concentrations of plankton and DOC compared to in situ conditions and (2) a higher fraction of labile DOC that is bioavailable to metabo- lize by organisms. Both concentration and lability of DOC are known to potentially effect sponge carbon fluxes (Morganti et al. 2017; Wooster et al. 2019). However, for all tested deep- sea sponges, regardless of differences in initial ambient plank- ton and DOC concentrations, DOC proved essential to meet, and exceed, their minimal respiratory demands. Additionally, the species that was incubated in deep-sea water (i.e., fjord water from 200 m), G. barretti, required a similarly high rela- tive amount of DOC to meet its minimal respiratory demands as the other three tested sponges. Moreover, sponge holobionts might be capable of assimilating recalcitrant DOM.
It is known that many sponges, including several LMA species, host specific Chloroflexi lineages (Schmitt et al. 2011; Radax et al. 2012; Thomas et al. 2016). Recently, it was suggested that a specific Chloroflexi lineage found in Geodia spp., SAR202, might oxidize recalcitrant organic matter (Landry et al. 2017) by degrading complex carbohydrates and aromatic compounds (Thrash et al. 2017; Colatriano et al. 2018). In addition, several other studies have now shown an important role of sponge cells in the assimilation of DOM (de Goeij et al. 2009; Achlatis et al. 2019; Rix et al. 2020).
In conclusion, in order to understand deep-sea sponge- mediated ecosystem processes, it is crucial that future studies investigate in situ organic matter fluxes, and the means or
strategies by which various sponge hosts and their microbial symbionts metabolize and cycle DOM.
References
Abelson, A., T. Miloh, and Y. Loya. 1993. Flow patterns induced by substrata and body morphologies of benthic organisms, and their roles in determining availability of food particles. Limnol. Oceanogr.38: 1116–1124.
Achlatis, M., M. Pernice, K. Green, J. M. de Goeij, P.
Guagliardo, M. R. Kilburn, O. Hoegh-Guldberg, and S.
Dove. 2019. Single-cell visualization indicates direct role of sponge host in uptake of dissolved organic matter. Proc.
R. Soc. B286: 20192153.
Alexander, B. E., et al. 2014. Cell turnover and detritus pro- duction in marine sponges from tropical and temperate benthic ecosystems. PLoS One9: e109486.
Bart, M. C., S. de Vet, D. M. de Bakker, B. E. Alexander, D. van Oevelen, E. E. van Loon, and J. M. de Goeij. 2019.
Spiculous skeleton formation in the freshwater sponge Ephydatiafluviatilisunder hypergravity conditions. PeerJ 6: e6055.
Beazley, L. I., E. L. Kenchington, F. J. Murillo, and M. D. M.
Sacau. 2013. Deep-sea sponge grounds enhance diversity and abundance of epibenthic megafauna in the Northwest Atlantic. ICES J Marine Sci70: 1471–1490.
Beazley, L. I., E. L. Kenchington, I. Yashayaev, and F. J.
Murillo. 2015. Drivers of epibenthic megafaunal composi- tion in the sponge grounds of the Sackville Spur, northwest Atlantic. Deep-Sea Res. I Oceanogr. Res. Pap.98: 102–114.
Bertilsson, S., O. Berglund, D. M. Karl, and S. W. Chisholm.
2003. Elemental composition of marine Prochlorococcus and Synechococcus: Implications for the ecological stoichi- ometry of the sea. Limnol. Oceanogr.48: 1721–1731.
Brussaard, C. P. 2004. Optimization of procedures for cou- nting viruses byflow cytometry. Appl. Environ. Microbiol.
70: 1506–1513.
Buhl-Mortensen, L., and others. 2010. Biological structures as a source of habitat heterogeneity and biodiversity on the deep ocean margins. Mar Ecol31: 21–50.
Carballo, J. L., E. Avila, S. Enriquez, and L. Camacho. 2006.
Phenotypic plasticity in a mutualistic association between the spongeHaliclona caeruleaand the calcareous macroalga Jania adherens induced by transplanting experiments.
I. Morphological responses of the sponge. Mar. Biol. 148: 467–478.
Clarke, A., and K. P. P. Fraser. 2004. Why does metabolism scale with temperature? Funct Ecol18: 243–251.
Coma, R. 2002. Seasonality of in situ respiration rate in three temperate benthic suspension feeders. Limnol. Oceanogr.
47: 324–331.http://dx.doi.org/10.4319/lo.2002.47.1.0324 Colatriano, D., P. Q. Tran, C. Guéguen, W. J. Williams, C.
Lovejoy, and D. A. Walsh. 2018. Genomic evidence for the
degradation of terrestrial organic matter by pelagic Arctic Ocean Chloroflexi bacteria. Commun Biol1: 1–9.
Costello, M. J., A. Cheung, and N. De Hauwere. 2010. Surface area and the seabed area, volume, depth, slope, and topo- graphic variation for the world’s seas, oceans, and coun- tries. Environ. Sci. Technol.44: 8821–8828.
de Goeij, J. M., and F. C. van Duyl. 2007. Coral cavities are sinks of dissolved organic carbon (DOC). Limnol. Ocean- ogr.52: 2608–2617.
de Goeij, J. M., H. van den Berg, M. M. van Oostveen, E. H.
Epping, and F. C. van Duyl. 2008. Major bulk dissolved organic carbon (DOC) removal by encrusting coral reef cav- ity sponges. Mar. Ecol. Prog. Ser.357: 139–151.
de Goeij, J. M., A. De Kluijver, F. C. Van Duyl, J. Vacelet, R. H.
Wijffels, A. F. P. M. de Goeij, J. P. M. Cleutjens, and B.
Schutte. 2009. Cell kinetics of the marine spongeHalisarca caerulea reveal rapid cell turnover and shedding. J. Exp.
Biol.212: 3892–3900.
de Goeij, J. M., D. van Oevelen, M. J. A. Vermeij, R. Osinga, J. J. Middelburg, A. F. P. M. de Goeij, and W. Admiraal.
2013. Surviving in a marine desert: The sponge loop retains resources within coral reefs. Science342: 108–110.
de Goeij, J. M., M. P. Lesser, and J. R. Pawlik. 2017. Nutrient fluxes and ecological functions of coral reef sponges in a changing ocean. In J. L. Carballo and J. J. Bell [eds.], Cli- mate change, ocean acidification and sponges. Springer International Publishing.
Diaz, M. C., and K. Rützler. 2001. Sponges: An essential com- ponent of Caribbean coral reefs. Bull Mar Sci69: 535–546.
Ehrlich, H., and others. 2010. Three-dimensional chitin-based scaffolds from Verongida sponges (Demospongiae:
Porifera). Part I. isolation and identification of chitin. Int J Biol Macromol47: 132–140.
Freeman, C. J., and R. W. Thacker. 2011. Complex interactions between marine sponges and their symbiotic microbial communities. Limnol. Oceanogr.56: 1577–1586.
Frost, T. M. 1980. Clearance rate determinations for the fresh- water spongeSpongilla lacustris: Effects of temperature, par- ticle type and concentration, and sponge size. Arch Hydrobiol90: 330–356.
Fukuda, R., H. Ogawa, T. Nagata, and I. Koike. 1998. Direct determination of carbon and nitrogen contents of natural bacterial assemblages in marine environments. Appl Envi- ron Microbiol64: 3352–3358.
Hansell, D. A., C. A. Carlson, D. J. Repeta, and R. Schlitzer.
2009. Dissolved organic matter in the ocean: A controversy stimulates new insights. Oceanography22: 202–211.
Hawkes, N., M. Korabik, L. Beazley, H. T. Rapp, J. R. Xavier, and E. L. Kenchington. 2019. Glass sponge grounds on the Scotian Shelf and their associated biodiversity. Mar. Ecol.
Prog. Ser.614: 91–109.
Hentschel, U., L. Fieseler, M. Wehrl, C. Gernert, M. Steinert, J.
Hacker, and M. Horn. 2003. Microbial diversity of marine spon- ges, p. 59–88.InSponges (Porifera). Berlin, Heidelberg: Springer.
Hill, R. W., G. A. Wyse, and M. Anderson. 2004. Animal physi- ology, v. 2. Sunderland, MA: Sinauer Associates, p. 150–151.
Hoer, D. R., P. J. Gibson, J. P. Tommerdahl, N. L. Lindquist, and C. S. Martens. 2018. Consumption of dissolved organic carbon by Caribbean reef sponges. Limnol. Oceanogr.63: 337–351.
Hoffmann, F., and others. 2009. Complex nitrogen cycling in the sponge Geodia barretti. Environ. Microbiol. 11: 2228–2243.
Kahn, A. S., G. Yahel, J. W. Chu, V. Tunnicliffe, and S. P. Leys.
2015. Benthic grazing and carbon sequestration by deep- water glass sponge reefs. Limnol. Oceanogr.60: 78–88.
Kenchington, E., L. Beazley, and I. Yashayaev. 2017. Hudson 2016–019 International Deep Sea Science Expedition Cruise Report. Fisheries and Oceans Canada, Ocean and Ecosystem Sciences Division, Maritimes Region, Bedford Institute of Oceanography.
Klitgaard, A. B. 1995. The fauna associated with outer shelf and upper slope sponges (Porifera, Demospongiae) at The Faroe Islands, northeastern Atlantic. Sarsia80: 1–22.
Klitgaard, A. B., and O. S. Tendal. 2004. Distribution and spe- cies composition of mass occurrences of large-sized sponges in the Northeast Atlantic. Prog. Oceanogr.61: 57–98.
Kötter, I., C. Richter, M. Wunsch, and D. Marie. 2003. In situ uptake of ultraplankton by Red Sea cavity-dwelling and epi- reefal sponges. Feeding Ecology of Coral Reef Sponges.
PhD-thesis. Univ. of Bremen.
Kutti, T., R. J. Bannister, and J. H. Fosså. 2013. Community structure and ecological function of deep-water sponge gro- unds in the Traenadypet MPA—Northern Norwegian conti- nental shelf. Cont. Shelf Res.69: 21–30.
Kutti, T., R. J. Bannister, J. H. Fosså, C. M. Krogness, I.
Tjensvoll, and G. Søvik. 2015. Metabolic responses of the deep-water spongeGeodia barrettito suspended bottom sed- iment, simulated mine tailings and drill cuttings. J. Exp.
Mar. Biol. Ecol.473: 64–72.
Lancaster, J. (Ed.), S. McCallum, A. C. Lowe E. Taylor, A.
Chapman, and J. Pomfret. 2014 Development of detailed ecological guidance to support the application of the Scot- tish MPA selection guidelines in Scotland’s seas. Scottish Natural Heritage Commissioned Report No.491. Deep Sea Sponge Aggregations supplementary document.
Landry, Z., B. K. Swan, G. J. Herndl, R. Stepanauskas, and S. J.
Giovannoni. 2017. SAR202 genomes from the dark ocean predict pathways for the oxidation of recalcitrant dissolved organic matter. MBio8: e00413–e00417.
Leys, S. P., and N. R. Lauzon. 1998. Hexactinellis sponge ecol- ogy: Growth rates and seasonality in deep water sponges.
J. Exp. Mar. Biol. Ecol.230: 111–129.
Leys, S. P., G. O. Mackie, and H. M. Reiswig. 2007. The biology of glass sponges. Adv. Mar. Biol.52: 1–145.
Leys, S. P., A. S. Kahn, J. K. H. Fang, T. Kutti, and R. J.
Bannister. 2018. Phagocytosis of microbial symbionts