Blijenberg et al.: Calibrators and control samples for bilirubinometers 367 Eur. J. Clin. Chem. Clin. Biochem.
Vol. 31, 1993, pp. 367-374
© 1993 Walter de Gruyter & Co.
Berlin · New York
Calibrators and Control Samples for Bilirubinometers
By B. G. Blijenberg*, G. Brugmann2, W.-J. Geilenkeuser3, Regina Kusyschyn2, G. R hle2, H. Schlebusch4 and Christine Schneider4
1 Centraal Klinisch-Chemisch Laboratorium, Academisch Ziekenhuis Rotterdam-Dijkzigt
2 Hauptlabor der Universit ts-Kinderklinik T bingen
3 Institut f r Klinische Biochemie der Universit t Bonn
4 Abteilungf r Klinische Chemie undH matologie, Zentrum f r Geburtshilfe und Frauenheilkunde der Universit t Bonn
(Received November 30, 1992/February 22, 1993)
Summary: The different matrix properties of neonatal serum and commercial control samples can lead to considerable errors in the calibration and control of bilirubinometers. These difficulties can be avoided by calibration with serum from healthy adults which is supplemented with unconjugated bilirubin. But this procedure is impracticable for most routine laboratories.
Under certain preconditions, control samples, with bilirubin concentrations determined with correctly cali- brated bilirubinometers or spectrophotometers, are also suitable as calibrators. This was established by determination of the bilirubin concentration of 16 different control samples, using both the reference method and correctly calibrated bilirubinometers or spectrophotometers in three or four specialist laboratories. This was also confirmed in several interlaboratory surveys, some involving up to 72 laboratories. The results of these investigations show that a control sample should be used for the calibration of a bilirubinometer only if it meets the following preconditions:
1. There should be no significant difference between the bilirubin values determined with the reference method and with a correctly calibrated spectrophotometer or bilirubinometer.
2. The bilirubin concentration should lie in the range 230 — 300 μηαοΐ/ΐ.
The photometric response of bilirubinometers has a limited linear range, so that analytical results greater than 300 μπιοΙ/1 must be rated as basically unreliable.
Introduction
Bilirubinometers are widely used for the determina- tion of bilirubin in neonatal sera. These simple filter photometers use a glass capillary as the cuvette. The absorbance of undiluted serum or plasma is measured at two wavelengths, and the bilirubin concentration is computed directly.
The calibration of bilirubinometers, however, presents a serious problem. Calibration is generally performed with control sera, with nominal values stated by the supplier. The authors have already shown in previous
Eur. J. Clin. Chem. Clin, Biochem. / Vol. 31,1993 / No. 6
publications (1 —4) that this may lead to considerable errors in the results. It was therefore suggested (5) that bilirubinometers should be calibrated with a pool of neonatal sera, using the reference method value as the assigned calibrator value. This procedure leads to a marked improvement in accuracy (3, 4), but it is impracticable for most laboratories, for the following reasons.
1. The collection of appropriate samples (high bili- rubin concentration, no haemolysis, no photother- apy) presents many problems.
2. Only a few laboratories are equipped to prepare a homogeneous pool and to analyse it with the ref- erence method.
3. Extended storage, which sometimes cannot be avoided, may lead to alterations in the samples.
However, under certain conditions, correct values for neonatal sera can also be obtained by calibrating bilirubinometers with a pool of adult sera, which contains added bilirubin and which has been analysed with the reference method. This material is also suit- able for testing the linear measuring range of biliru- binometers (6).
In the meantime, closer investigation of different con- trol samples has shown that the differences between reference method values and bilirubinometer target values are large for some control sera, but small for others (3, 4, 7). Thus, some control materials clearly have similar properties to neonatal serum when ana- lysed by direct spectrophotometry.
The present work consists of three parts. First, the results are presented of a special survey in which the linearity and accuracy of routinely used bilirubino- meters were checked. Second, reference method values and bilirubinometer target values were determined in 16 commercial control sera and their suitability as calibrators is discussed. Third, some of these samples were also used in 3 interlaboratory surveys conducted by the German Society for Clinical Chemistry in which it was determined whether the accuracy of bilirubinometer results can be improved by using such samples as calibrators.
Materials and Methods
Interlaboratory survey of the accuracy and linearity of bilirubinometers
A serum pool from 10 healthy, fasting probands (bilirubin concentration 6.0 μιηοΐ/ΐ) was equilibrated to pH 7.40 with tonometer gas and finally supplemented with bilirubin to a concentration of 428 μηιοΐ/ΐ (as determined by the reference method) (for details, see 1. c. (6)).
This spiked pool was diluted in 6 steps with the starting pool, producing 6 samples with bilirubin concentrations of 377, 323, 267, 215, 164 and 108 μηιοΐ/ΐ.
Each sample was dispensed into bilirubinometer-type capillar- ies, and sent by post to 54 participants in the interlaboratory survey. Tests were performed to ensure that the bilirubin con^
centrations of the samples did not change within 48 hours.
Participants in the survey analysed the samples in the capillaries, using their apparatus as calibrated for routine analyses.
Correction of results
In each laboratory, the results for the 3 higher and 3 lower concentrations were multiplied by a correction factor. This
factor was equal to the ratio of the reference method value for the intermediate sample (267 μπιοΐ/ΐ) to the value obtained for that sample in the participating laboratory. Results corrected in this way represent the values that would have been expected, if all participants had used the intermediate sample as the calibrator.
Determination of reference method values and bili- rubinometer target values for 16 commercially pre- pared control samples
Sixteen commercially prepared control specimens were inves- tigated. In the code for each sample shown in table 1, the letter stands for the manufacturer, whereas the numbers indicate the order of the bilirubin concentrations in the samples.
The following laboratories took part.
Laboratory 1: Centfaal KlinischbChemisch Laboratorium, Academisch Ziekenhuis
Laboratory 2: Hauptlabor der Universit ts-Kinderklinik T - bingen
Laboratory 3: Klinisch Chemisches Laboratorium der Univer- sit ts-Frauenklinik Bonn
Most of the reference method values were determined with the additional participation of the Institut f r Klinische Chemie I der Medizinischen Hochschule Hannover.
Determination of reference method values
The method of Doumas (8) was used for the determination of reference method values. For this purpose, on two separate days the contents of 5 sample bottles were pooled and the value determined in duplicate. The volumes used in the original method were halved, and the method was otherwise unchanged.
The concentration was calculated using the molar absorbance for azobilirubin of A = 7550 m* · mol""1.
Measurements were made with a spectrophotometer with a band width of < 2 nm. The accuracy of the wavelength setting was checked with holmium nitrate solution at 536.7 nm and 640.0 nm. The accuracy of absorption was tested with two different cyanohaemiglobin solutions, the absorption of which had been determined at the Physikalisch-Technische Bundesan- stalt (Federal Institute for Physics and Technology), Berlin.
Measurements with bilirubinometers The following bilirubinometers were used.
Laboratory 1: Wako Bilirubin Tester (manufacturer: Wako Pure Chemical Industries Ltd., Osaka, Japan)
Laboratory 2/3: Moltronic bilirubinorneter (manufacturer: Mo- chida Pharmaceutical Co., Tokyo, Japan)
Each apparatus was calibrated with a pool prepared from adult sera, to which bilirubin had been added to a concentration of 242 umol/1 (reference method value).
Measurement of undiluted samples with spectrophotometers The light path of standard cuvettes was decreased to 0.9 mm by using a glass insert (Hellma, No..017.000-OS). Absorbance was measured with the spectrophotqmeter at 455 and 575 nm.
The supplemented serum pool described in section "Measure- ments with bilirubinometers" was used for calibration.
Eur. j. Clin. Chem. Clin. Biochem. / Vol. 31,1993 / No. 6
Blijenberg et al.: Calibrators and control samples for bilirubinometers 369 Interlaboratory surveys with control samples as cal-
ibrators
Individual interlaboratory surveys were used to test the effect of using the same calibrators on the different bilirubinometers used by the participants. Three different versions of the survey were performed, but in each case the calibrator and the tested samples were from different sources.
cipant's analytical value for sample B was calculated and used for the correction of sample A. Again, the totality of the corrected Α-values represented the survey result for sample A that would have been expected, if all bilirubinometer users had measured sample A after calibration of their instruments with sample B of known reference method value.
Version 1 (1990)
In addition to survey samples A and B, each participant also received a further sample with an assigned calibrator value (306 μπιοΐ/ΐ). The bilirubin concentrations of samples A and Β were determined first under routine conditions, then again after calibration with the calibrator provided. (This survey was per- formed before the determination of the data presented in table 1. The target values used are therefore absent from table 1).
Version 2 (1991)
One month after the survey, in which samples A (el) and Β (e6) were measured, each participant received an additional unknown sample C (b4) for a routine bilirubin determination.
The values for samples A and Β obtained by each participant were multiplied by a correction factor equal to the ratio of the reference method value for sample C to the result obtained by that participant for sample C.
The corrected results from all participants represented the sur- vey results that would have been expected, if all participants had used the same calibrator (cf. version 1).
Version 3 (1992)
All participants received samples e4 and b4, which were des- ignated survey sample A and B. In analogy with version 2, the ratio of the reference method value for sample B to the parti-
Results
Interlaboratory survey of the accuracy and linearity of bilirubinometers
The accuracy and linearity of bilirubinometers was investigated with the participation of 54 laboratories, each of which received 7 samples of different concen- trations. Samples were sent to participants already dispensed into capillaries and ready for measurement.
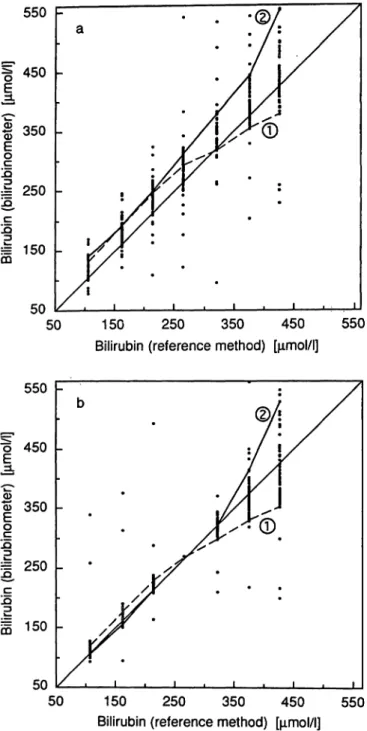
In figure la, the results received are plotted against the corresponding reference method values. Figure Ib shows the corresponding plot after correction of the results for calibration of each participant's bilirubi- nometer.
Bilirubin determinations in control samples with the reference method and by direct spec- trophotometry
Results for the analysis of 16 control sera are shown in table 1. The reference method value for sample b6 was determined in November 1990, the values for the Tab. 1. Results for the determination of target values for bilirubin in 16 control samples, using 3 analytical methods.
Ν = number of laboratories;
η = number of determinations;
MRM, MSP, MBIL = medians of the values from the reference method, spectrophotometry and bilirubinometry, respectively;
Rmax — Rmin = difference between the highest and lowest values of η results.
Control Measuring principle speci- *
men Reference method
Ν
Spectrophotometer
Ν = 3; η = 12 Bilirubinometer
Ν = 3; η = 12
MR
(μτηοΐ/ΐ) (umol/1)
— MSP Rmax — MSP — Rmin MRM
(μιηοΐ/l) (μπιοΐ/ΐ) (μπιοΐ/ΐ) (%) (μηιοΐ/l) (μηιοΐ/ΐ) (μηιοΐ/l) (%)Rmin MSP albl
b2b3 b4b5 b6cl c2dl ele2 e3e4 e5e6
13 43 43 24 42 44 44 44
46 166 166 168 168 1616 1616 1616
348126 223230 231282 337311 312287 112159 204232 256301
15 56 53 46 82 85 75 47
• 305 222128 229236 298327 313320 284104 142182 204224 268
247 328 1317 148 176 145 67 1211
-43+ 2 - 1- 1 + 5+ 16 -10+ 2 + 8- 3 - 8-17 -22-28 -32-33
(-12) (+ 2)
(0)(0) (+ 2) (+ 6) (- 3)
(+ υ
(+ 3)(- D
(- 7) (-11) (-11) (-12) (-13) (-11)296124 219229 234296 331309 280322 105146 208185 230266
3312 1215 127 1215 2012 109 1214 1614
-9-4 -30 -2-2 +4-4 + 24 + 1+4 + 3+4 +6-2
(-3)(-3) (-1)(0)
(-D (-D
(+1)(-1) (+1)(-1) (+1)(+3) (+2) (+2)(+3)
(-D
Eur. J. Clin. Chem. Clin. Biochem. / Vol. 31,1993 / No. 6
550 F
450 -
S 350 - .α
^ 250 -
I 150 μ
50 150 250 350 450
Bilirubin (reference method) [μηιοΙ/Ι]
550
550
450
350
JD
1 250 βc IQ
I 150
5050 150 250 350 450 550
Bilirubin (reference method) [μποΙ/Ι]
Fig. 1. Comparison of the values for bilirubin determined with bilirubinometers and with the reference method. Seven human adult pool serum samples spiked with bilirubin were analysed with 54 bilirubinometers in different lab- oratories.
a) Values measured in laboratories
b) Values corrected on the theoretical assumption that all the bilirubinometers had been calibrated with the intermediate sample (267 μηιοΙ/1).
The values of 2 individual bilirubinometers with differing characteristics are linked by lines.
other samples between March and October 1991. The results for direct spectrophotometry and for biliru- binometry were obtained in October 1991 directly after calibration of the instruments.
The median is reported for each control sample and each analytical method. The scatter of each collective of values is described here by the difference between
the highest and lowest value. For direct spectropho- tometric measurements, the deviation of the median of each analytical result from the median of the ref- erence method value is given. Differences between the medians of the bilirubinometer values and the spec- trophotometric values are also reported.
Interlaboratory survey results before and after calibration of the bilirubinometers In three regular interlaboratory surveys, results were determined by normal routine procedures. In three different versions of the survey, results were also de- termined after correct calibration of the equipment, or the results that would have been obtained after correct calibration were calculated for the same sam- ple material. Table 2 shows the median value and scatter for 5 different control samples in the interla- boratory survey, before and after calibration. The scatter is the difference between percentiles 16 and 84. For normally distributed results, this difference would be the range of the mean value plus and minus one standard deviation.
Discussion
Accuracy and linearity of bilirubinometers tested with bilirubin-spiked pool serum The reliability of bilirubinometers for the determina- tion of neonatal bilirubin has been repeatedly ques- tioned (1-5).
It has been possible to investigate neonatal sera only on a few instruments. The investigation and compar- ison of a relatively large number of bilirubinometers (e. g. in interlaboratory surveys) requires large quan- tities of sample material, so that commercially pre- pared control samples were used in earlier surveys. It cannot be assumed, however, that these samples are equivalent in all respects to neonatal sera..
Under these conditions, it was not possible to deter- mine whether or to what extent unsatisfactory results were due to defects in the apparatus, inadequate qual- ity of the sample material, errors introduced by the analyst, or some combination of these effects. A more detailed study, using adult serum supplemented with bilirubin, however, revealed a possible solution for this problem (6).
Seven different concentrations of bilirubin were pre- pared in adult serum, and dispensed into capillaries for the participants in the survey. Each participant received 7 capillaries, already prepared for direct
Eur. J. Clin. Chem. Clin. Biochem, / Vol. 31,1993 / No. 6
Blijenberg et al.: Calibrators and control samples for bilirubinometers 371
Tab. 2. Medians and scatter ranges of the results of bilirubin determinations with bilirubinometers before and after calibration of the instruments. (For different versions of the calibration procedure, see Methods.)
Inter- labora- torysurvey
Cali- Sample bra-tion
value (μπιοΐ/ΐ)
Target value forbili- rubino- meter (μηαοΐ/ΐ
Interlaboratory survey results Before calibration
η )
Median Percentile
16lh 84th
Differ- ence 84th - 16lh
After calibration η
(μηιοΐ/ΐ) (μηιοΙ/1) (μηιοΐ/l) (μιηοΐ/l) 1990
1991 1992
306 231 231
AΒ A (el) B(e6) A(e4)
233308 104267 206
5151 73 73 58
255357 113289 218
331238 265101 200
390278 125314 237
4059 24 49 37
4343 7373 58
Median Percentile
16th 84th
Differ- ence 84th - 16th (μηαοΐ/ΐ) (μπιοΐ/ΐ) (μπιοΐ/ΐ) (μηιοΐ/ΐ) 313221
262102 .205
301213 96 248 199
233321 274109 212
2020 13 26 13
measurement in the bilirubinometer, and requiring no preparative procedures. This arrangement largely ex- cluded any effects due to inadequacies of the sample material or errors by the analyst. The analytical re- sults therefore provided a reliable indication of the analytical performance of each of the 54 bilirubino- meters used for the analysis of the 7 samples. These results are summarized in figure la, which shows that the 54 reported values for each of the 7 concentrations sometimes differed considerably from the reference method values.
Differences between reported values and reference method values could be due to the fact that the instruments were calibrated with different materials, whose calibration values had not been established by a common, standardized procedure.
Another important factor revealed by these results was the limited linearity of the response of each ap- paratus, as shown by the plot of the 7 analytical values. This is shown for two bilirubinometers in figure la.
Strictly speaking, Beer's law is valid only for mono- chromatic light and low concentrations of the analyte.
As the concentration of the analyte is increased, how- ever, its measured absorption eventually becomes measurably less than would be expected from a linear relationship between absorption and concentration.
In bilirubinometers, this effect becomes increasingly evident at bilirubin concentrations above approxi- mately 250 μιηοΐ/l, as shown more or less by the performance of bilirubinometer 1 (fig. la). In princi- ple, it is possible to alter the characteristics of many bilirubinometers to obtain approximate linearity, even at relatively high concentrations. This can be carried out by the service personnel, but, for technical rea-
sons, apparently only to a limited extent. Thus, the performance of bilirubinometer 2 (fig. la) is a clear example of an overcompensated instrument setting.
It should be possible for the manufacturers to achieve, at an acceptable cost, a better correlation between the measured absorption and the bilirubin concentration of a sample. For example, a small computer could be installed to correct the deviation from linearity.
However, an essential improvement in the reliability of results can be achieved even under the present conditions by providing users with the means for correctly calibrating their instruments. This is verified by figure Ib, which shows the results that would have been obtained for the three low and three high con- centrations, if all the bilirubinometers had been cali- brated using the intermediate sample and its reference method value (267 μιηοΐ/ΐ). For those samples with reference method values between 108 and 323 μιηοΐ/ΐ, the scatter of the recalculated bilirubinometer values was much less than that of the original values in figure la. For concentrations above approximately 300 μιηοΐ/ΐ, however, many of the bilirubinometers no longer produced reliable results, even after precise calibration.
This may explain, at least partly, why Blijenberg et al. (5, 9) and other authors (10, 11) found a wide variation of results for values above 300 μιηοΐ/ΐ, even after calibration with standards based on adult serum.
It appears that a crucial improvement of results in the concentration range 100 — 300 μιηοΐ/ΐ can be achieved by correct calibration of bilirubinometers.
The question arises, however, as to which procedure is practicable for routine laboratories, which do not have a ready source of neonatal sera or supplemented adult sera for calibration purposes (see Introduction).
Bur. J. Clin. Chem. Clin. Biochem. / Vol. 31,1993 / No. 6
These laboratories can only use commercially pre- pared "control samples", whose calibrator values have been established by a standardized procedure.
Bilirubin determinations by reference method and direct spectrophotometry in con- trol samples
In an extensive investigation, 16 batches of control samples from different manufacturers were analysed by means of 3 methods: the reference method of Doumas (8), direct spectrophotometry of undiluted samples with a spectrophotometer, and with a bili- rubinometer (tab. 1). The spectrometric results for each control sample were obtained within 2 days, using uniformly calibrated apparatus. Reference method values for each control sample were, however, based on a\ varying number of determinations per- formed at different times in a different number of laboratories. The median values for the reference method were therefore based on a smaller number of analyses, but there is no evidence that this decreased their reliability.
Two aspects of table 1 are important with respect to the suitability of control samples for the calibration of bilirubinometers.
1. In both the spectrophotometric and the bilirubi- nometric determinations, the difference between the highest and lowest value of each collective was in many cases unexpectedly large, despite optimal calibration of the instruments. Apparently, rela- tively large random and systematic errors are dif- ficult to avoid in both of these analytical methods.
Much smaller differences were observed between the results obtained with the reference method.
2. In the analysis of control samples by direct pho- tometry, there were no significant differences be- tween the results obtained with spectrophotome- ters and bilirubinometers (maximal difference 3%).
In about half of the cases, however, the median values for photometry deviated markedly from the median values of the reference method. The prop- erties of the sample material responsible for these deviations have not been identified.
Interlaboratory survey results from biliru- binometers before and after calibration with control samples
For organizational reasons, three different procedures were used for the calibration of the bilirubinometers:
1. Forty-three of the 51 participants performed their own calibration, using a calibrator supplied to them.
2. The values were corrected' on the basis of results obtained by the participant for an unknown cali- brator, which the participant analysed one month after the survey.
3. One of the two survey samples served as the cali- brator, in that the results were corrected on the basis of the participant's results for this sample.
After the calibration, the median values for all five samples agreed much more closely with the target values than before the calibration (for results see tab.
2). In all cases, there was a very clear improvement of interlaboratory precision, shown in the table by the differences between percentiles 84 and 16. In the second version of the calibration, this improvement might have been even more marked^ if less time had elapsed between the survey and the analysis of the calibrator. It is obvious, however, that interlaboratory precision showed an especially marked improvement
9 8
£7
i
6*δ
α5 4 E 3 z 2 1 0_
a . - - - -
" . . .Π. . .Π. .ΠΜΙ l
r
nl
•
ΠΓ
l
η r
, Λ fl, ,
180 200 220
Bilirubin [μιηοΙ/IJ 240 18
16
£ 14 g 12CD
i 10
oCD 8
"1 6
i 4
2 0b -. . -
η
- Γ
,., ,Π,Π, ,Π, ,Π.Π, . .Π. . . .Π.
180 200 220 Bilirubin [μηποΙ/Ι],
240
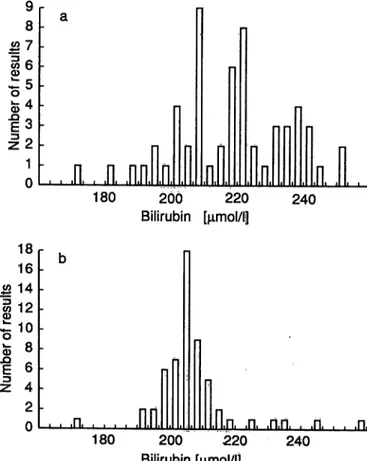
Fig. 2. Results of the determination of bilirubin in control sample A of interlaboratory survey
BI 2/92, using bilirubinometers.
a) Values measured in laboratories
b) Values corrected on the theoretical assumption that all bilirubinometers had' een calibrated with sample B (reference method value 231 μιηοΐ/ΐ) of the inter- laboratory survey (see Methods, version 3).
Eur. J. Clin. Chem. Clin. Biochem. / Vol. 31,1993 / No. 6
Blijenberg et al.: Calibrators and control samples for bilirubinometers 373 whenever the concentration of the calibrator and the
survey sample were close to each other, e. g. sample A in the interlaboratory surveys of 1990 and 1992.
(The results for sample A in 1992 before and after calibration are also presented as histograms in figs.
2a and 2b.) In both cases, the scatter of results after the calibration was only one-third of that observed before the calibration. This effect is plausibly ex- plained by differences in the photometric performance of individual bilirubinometers (e. g. with respect to linearity), and should be taken into consideration when choosing appropriate calibrators.
Conclusions
These studies show that the reliability of bilirubino- meter results can be considerably improved by stan- dardized calibration of the apparatus. With certain preconditions, the calibration can be performed with commercially prepared control samples. These pre- conditions are defined and substantiated as follows.
1) The bilirubin concentration of the control material should lie between about 230 and a maximum of 300 μιηοΐ/ΐ. Since bilirubinometers do not show a
{ uniform photometric response, they should be cal-
| ibrated in the clinically most important concentra- I tion range. With modern therapeutic methods,
concentrations above 300 μιηοΐ/ΐ are rarely en- countered in neonates. When such concentrations do occur, and especially if an exchange transfusion is under consideration, the bilirubinometer result should be checked with a different analytical method. In the great majority of cases, however, the serum bilirubin concentration is lower. On the basis of the present results, a well maintained and properly serviced bilirubinometer, correctly cali- brated in the region of 250 μηιοΐ/ΐ, should measure concentrations in the approximate range 100 — 300 μιηοΐ/ΐ with sufficient reliability.
2) The bilirubin concentration of the control material should be determined with the reference method, and the reference method value should be used as the calibration value (with certain qualifications;
see below). In principle, nominal values (deter- mined by direct photometry as described in the present work) could also be used for the calibra- tion. It is, however, important that the value used for the calibration should have the highest possible precision and accuracy; and it has been shown that the values obtained by direct photometry, even with high performance spectrophotometers, are less precise than those obtained with the reference method. Therefore, only reference method values should be used as calibration values.
3) The reference method value of the control material and the nominal value determined by direct pho- tometry should not differ greatly from each other (the authors recommend a maximal difference of 4%). If the nominal value of a sample determined by direct photometry differs greatly from the ref- erence method value, there is a high probability that any calibration performed with that sample will be wrong. Control samples showing these large differences (tab. 1) appear to be unsuitable as calibrators, but their target values provide suffi- ciently reliable reference points for the routine internal and external monitoring of accuracy.
Adherence to the analytical preconditions, and strict application of the standardized calibration procedures described in the present work, should produce a con- siderable improvement in the reliability of bilirubin determinations with bilirubinometers.
Acknowledgement
We would like to thank Prof. Dr. W.-R. K lpmann (Medizi- nische Hochschule Hannover) for his co-operation in the de- termination of reference method values.
References
1. Blijenberg, B. G., Roetering, H. A. & Leijnse, B. (1987) Reflections on the standardization of total bilirubin in neonatal serum. J. Clin. Chem. Clin. Biochem. 25, 177 — 2. Briigmann, G. (1988) Zur Kalibrierung der Bilirubinbestim-181.
mung bei Neugeborenen. J. Clin. Chem. Clin. Biochem. 26, 737-738 (Abstract).
3. Briigmann, G. (1990) Calibration of direct reading photo- meters for the determination of neonatal bilirubin. J. Clin.
Chem. Clin. Biochem. 28, 83-89.
4. Schlebusch, H., Liappis, R, R hle, G. & Schneider, Ch.
(1989) Zur Kalibration von Bilirubinometern. Lab. Med.
13, 364-368.
5. Blijenberg, B. G., Roetering, H. A., De Vos, A. & Leijnse, B. (1987) Further studies on the standardization of neonatal bilirubin. J. Clin. Chem. Clin. Biochem. 25, 737-741.
6. Schlebusch, H., R hle, G., Schneider, Ch., Liappis, N., Geilenkeuser, W. J. & Genz, R. (1991) Improvement of the accuracy of bilirubinometer results. Lab. Med. 75, 10-15.
7. R hle, G„ Schlebusch, H., Geilenkeuser, W. J. & Kruse, R. (1988) External quality control in the determination of neonatal bilirubin — an approach to the improvement of results. J. Clin. Chem. Clin. Biochem. 26, 441-446.
8. Doumas, B. T., Kwok-Cheung, P. P., Perry, B. W., Jen- drzejczak, B., Me Comb, R. B., Schaffer, R. & Hause, L.
L. (1985) Candidate reference method for determination of Eur. J. Clin. Chem. Clin. Biochem. / Vol. 3l·, 1993 / No. 6
total bilirubin in serum: Development and validation. Clin. 11. Watkinson, L. R., St. John, A. & Penberthy, L. A. (1982) Chem. 31, 1779—1789. ( Investigation into paediatric bilirubin analyses in Australia 9. Blijenberg, B. G. & Leijnse, B. (1980) A survey report on and New Zealand. J. Clin. Pathol. 35, 52-58.
the determination of total bilirubin in neonatal· samples. J.
Clin. Chem. Clin. Biochem. 18, 27-30. Prof. Dr. G. Röhle .,
10. St. John, A. & Penberthy, L. A. (1979) An inter-laboratory Institut für Klinische Biochemie survey of paediatric bilirubin analyses. J. Clin. Pathol. 32, der Universität Bonn
794 - 797. Sigmund-Freud-Straße 25 W-5300 Bonn 1
Bundesrepublik Deutschland
Eur. J. Clin. Chem. Clin. Biochem. / Vol. 31,1993 / No. 6