• Keine Ergebnisse gefunden

Value for the Vulnerable?

N/A
N/A
Protected

Academic year: 2021

Aktie "Value for the Vulnerable?"

Copied!
374
0
0

Wird geladen.... (Jetzt Volltext ansehen)

Volltext

(1)

Value for the Vulnerable?

Sustainable Smallholder Development in Northern Ghana and the Value Chains of Tomato, Chili and Rice.

Inaugural-Dissertation zur Erlangung des Doktorgrades

der Mathematisch-Naturwissenschaftlichen Fakultät der Universität zu Köln vorgelegt von

Jan-Niklas Bamler

aus Kleve

(2)

Berichterstatter: Prof. Dr. Boris Braun

(Gutachter) Prof. Dr. Peter Dannenberg

Tag der mündlichen Prüfung: 15.01.2015

(3)

Abstract:

Ghana has managed to become one of the fastest growing economies in the world with a vibrant agricultural market. The country could be a prime example of successful, pro-poor development following economic liberalisation. Though first change is visible even in traditionally impoverished areas of the north, namely the Upper East Region, hunger and chronic poverty are still prevalent. Yet, after decades of restricted public expenditure, ‘pro- poor’ agricultural policies could now be put in place, to actively improve smallholder lives in the area by various forms of government support. Similarly, foreign development agencies have recently become more engaged in supporting the local agricultural sector. All actors of current relevance have thereby pursued a value chain approach to developing the markets and livelihoods of northern Ghanaian agriculturalists. The contribution to pro-poor, ‘sustainable’

development, however, remains unclear as at now. This study is therefore concerned with how market dynamics and interventions have influenced ‘sustainable development’ of the vulnerable and poor in an emerging economy like Ghana. To do so, the study takes a look at smallholder livelihood systems in the Upper East Region of the country. Here, local peasant society is confronted with environmental changes, economic globalisation processes and interventions in agricultural value chains by the local Ministry of Food and Agriculture and foreign donors like USAID.

To grasp the impact of market dynamics and interventions within this multidimensional context, this study argues for a combination of a holistic livelihood and a more specific value chain and production network approach as a useful conceptual background. Given this theoretic backdrop, data was collected for over 10 months in two villages of the Upper East, namely in Biu and Mirigu, with a focus on tomato, chili and rice, products of major significance to locals. The main methods applied in the field included qualitative as much as quantitative approaches. Farmer focus group discussions (n=37), in-depth farmer interviews and farm budgets (n=47) were the primary source of data gathered. Expert/key-informant interviews (n=70) and expert group discussions (n=2) were held. A household head survey (n=177) and an expert survey (n=25) were used to check hypotheses previously generated by qualitative methods. Primary and secondary data for tomato, chili, rice and partly also shea value chains was collected. Secondary data, such as confidential government and NGO documents, allow an insider view into farmers’ access to subsidies and support. An archive survey of church diaries dating back to 1905, enable a view on local developments in a long- term, historic perspective.

This study thereby yields a number of insights with concern for conceptual approaches

to the issue of understanding the pro-poor impact of markets, their dynamics and interventions

(4)

important aspects of people-centred, human development potentials and constraints in a local environmental and institutional context. Value chain and production network analysis provided further fruitful insights on market dynamics, their structural outlines, their basic rationales and market terms for the successful participation of locals. It can therefore be concluded that both of these basic notions, either people- or market-centred approaches, should be conceptually merged to advance future research on the pro-poor effect of markets and interventions within them, to specifically address questions of what is here understood as ‘livelihood upgrading’.

This study further contributes to an understanding of central aspects of local development and possible future avenues to achieving greater livelihood sustainability through government or donor development interventions. Most significantly, it became clear that

‘positive’, pro-poor market dynamics are also encountered at a local level, but cannot be made

use of by spatially and socially marginalised, vulnerable and poor smallholders. That is mainly

due to elite capture and corrupt practices, ultimately a question of mal-governance, a lack of

grass-roots participation and a disregard for societal dimensions within which interventions are

interwoven. Furthermore, neither environmental degradation nor present or future

environmental changes, especially climatic ones and those with regard to soils, are accounted

for. Interventions thereby remain far below their possible impact and even contribute to a loss

of the natural resource base, aside the fact that they further increase an already high level

socio-economic inequality. In the face of recent economic awakening, despite globalisation

tendencies, future efforts in enabling sustainable development at local level must thus

increasingly embrace environmental and, mostly, societal concerns in their concepts and daily

practice.

(5)

Kurzzusammenfassung:

Ghana hat es geschafft eine der weltweit schnellst wachsenden Volkswirtschaften mit einem besonders dynamischen landwirtschaftlichen Sektor zu werden. Das Land könnte ein Paradebeispiel für erfolgreiche, armutsorientierte Entwicklung im Zuge ökonomischer Liberalisierung sein. Obwohl ein Wandel auch in den traditionell verarmten Gebieten des Nordens, namentlich in der Upper East Region, sichtbar ist, ist hier Hunger und chronische Armut immer noch verbreitet. Allerdings konnten nun nach mehreren Dekaden beschränkter finanzieller Möglichkeiten auf Seiten des Staates neue, armutsorientierte, landwirtschaftliche Politiken eingeführt werden, die aktiv kleinbäuerliche Leben verbessern könnten, durch verschiedenste Formen staatlicher Unterstützung. Ebenso verstärkt sich in letzter Zeit das Engagement ausländischer Entwicklungshilfeinitiativen im lokalen, landwirtschaftlichen Sektor. Mit dem Ziel der Entwicklung landwirtschaftlicher Märkte und, hierdurch, einer Verbesserung kleinbäuerlicher Leben, haben alle Akteure von momentaner Relevanz dabei einen Wertschöpfungskettenansatz verfolgt. Der Beitrag dieser Initiativen zu einer nachhaltigen Armutsbekämpfung ist jedoch bis dato unbekannt. Diese Studie beschäftigt sich daher mit der Frage, wie Marktdynamiken und Eingriffe in diese „Nachhaltige Entwicklung“

der Vulnerablen und Armen beeinflussen in einem Schwellenland wie Ghana. Um dies zu tun, schaut diese Studie auf kleinbäuerliche Lebenshaltungssysteme in der Upper East Region des Landes. In der Region treffen Umweltwandel, ökonomische Globalisierungsprozesse und Eingriffe in landwirtschaftliche Wertschöpfungsketten, letztere durch das Ghanaischen Ministeriums für Ernährung und Landwirtschaft und ausländische Entwicklungshilfeorganisationen wie USAID, auf eine kleinbäuerliche Gesellschaft.

Um die Auswirkungen von Marktdynamiken und -eingriffen innerhalb dieses multidimensionalen Kontextes verstehen zu können, fordert und nutzt diese Studie einen holistischen Livelihood-/Lebenshaltungsansatz in Kombination mit einem konkreteren Wertschöpfungsketten- und Produktionsnetzwerkansatz als konzeptionellen Hintergrund. Auf Basis dieses theoretischen Herangehens, wurden über 10 Monate hinweg diverse Daten in zwei Dörfern der Upper East Region gesammelt, in Biu und Mirigu, mit Fokus auf Tomaten, Chili und Reis, ihrerseits Produkte von besonderer Bedeutung für örtliche Produzenten. Bei der Feldforschung wurden im Wesentlichen qualitative wie auch quantitative Methoden genutzt.

Bäuerliche Fokusgruppendiskussionen (n=37) und vertiefte Einzelinterviews mitsamt

Farmbudgets (n=47) waren die primäre Datenquelle. Experteninterviews (n=70) und

Gruppendiskussionen mit Experten (n=2) wurden abgehalten. Umfragen unter

Haushaltsvorständen (n=177) und unter örtlichen Experten (n=25) wurden genutzt, um zuvor

durch qualitative Methoden generierte Hypothesen zu überprüfen. Primär- und Sekundärdaten

(6)

wurden gesammelt. Sekundärdaten wie vertrauliche, interne Dokumente diverser Organisationen, erlauben andernfalls verborgene Einsichten in den kleinbäuerlichen Zugang zu Subventionen und Unterstützung. Untersuchungen von Aufzeichnungen der örtlichen Kirche, die bis in das Jahr 1905 zurückgehen, ermöglichen einen Blick auf lokale Entwicklung in einer längerfristigen, historischen Perspektive.

Diese Studie erbrachte hierdurch eine Anzahl von Einsichten mit Relevanz für konzeptionelle Ansätze im Bereich der Armutswirkung von Märkten, deren Dynamiken und Eingriffe in diese. Die Lebenshaltungssystemanalyse zeigte sich hierbei als unverzichtbar um wichtige Aspekte menschenorientierter, humaner Entwicklungspotentiale und -hemmnisse innerhalb des örtlichen Umwelt- und Institutionenkontextes zu verstehen.

Wertschöpfungsketten- und Produktionsnetzwerkanalysen erlaubten weitergehende Einsichten in Marktdynamiken, deren strukturelle Gegebenheiten, deren Grundprinzipien und Konditionen für eine erfolgreiche Teilnahme der örtlichen Bevölkerung. Man kann daher folgern, dass beide dieser grundlegenden Ansätze konzeptionell miteinander verbunden werden sollten, um zukünftige Forschung zur Armutsminderung durch Märkte und Interventionen in diesen voranzubringen, um das zu adressieren was im Folgenden als Aufwertung („upgrading“) von Lebenshaltungssystemen verstanden wird.

Diese Studie leistet weiterhin einen Beitrag zu dem Verständnis zentraler Aspekte

lokaler Entwicklung und zukünftigen Möglichkeiten um eine höhere Nachhaltigkeit von

Lebenshaltungssystemen zu erreichen, durch Eingriffe seitens des Staates oder durch

Entwicklungshilfeorganisationen. Vornehmlich wurde klar, dass „positive“, armutsmindernde

Marktdynamiken auch auf lokaler Ebene wahrgenommen werden, jedoch durch räumlich und

sozial marginalisierte, arme und verletzliche Kleinbauern nicht genutzt werden können. Dies

liegt primär an der Abschöpfung von Unterstützungsmaßnahmen durch lokale Eliten und an

der allgemein vorherrschenden Korruption, letztlich eine Frage von schlechter

Regierungsführung und Basisbeteiligung innerhalb der verschiedenen Entwicklungsprojekte,

die jedoch soziale Dimensionen innerhalb derer sie sich bewegen vernachlässigen. Weiterhin

adressieren diese Projekte weder Umweltdegradation noch heutigen oder zukünftigen

Umweltwandel, insbesondere Klimawandel und Bodendegradation. Somit bleiben die

genannten Interventionen weit unterhalb ihres möglichen Potentials, fördern sogar einen

Verlust natürlicher Ressourcen und steigern weiterhin eine bereits stark ausgeprägte,

sozioökonomische Ungleichheit. Im Angesicht des jüngsten, wirtschaftlichen Aufbruchs in

(Nord) Ghana, trotz aller Globalisierungstendenzen, müssen zukünftige Anstrengungen die

nachhaltige Entwicklung fördern wollen, ökologische und insbesondere soziale Dimensionen

in Konzepten und Praxis berücksichtigen.

(7)

Table of Contents

List of Figures ... v

List of Tables ... viii

List of Maps ... ix

List of Photos ... x

List of Abbreviations ... xi

1. Introduction and Overview ... 1

2. Background: Development Policies and Northern Ghanaian Poverty ... 3

2.1. Pre-Independence ... 3

2.2. Post-Independence (1957 to 1983) ... 4

2.3. Structural Adjustment and Economic Reform (1983 to the mid-2000s) ... 9

2.4. The Cost of Adjustment ... 10

2.5. Post-Adjustment (the mid-2000s onwards) – New Opportunities for Northern Ghana? ... 14

2.6. Conclusion ... 17

3. Theory: Poverty Alleviation by Market Integration ... 20

3.1. Poverty and the Livelihood Approach ... 20

3.1.1. Overview of the Sustainable Livelihood Framework ... 23

3.1.2. Externalities: Structural Constraints and Incentives ... 24

3.1.2.1. Vulnerability Context ... 25

3.1.2.2. Transforming Structures and Processes ... 26

3.1.3. Internalities: Agency Constraints and Incentives ... 27

3.1.3.1. Livelihood Assets ... 27

3.1.3.2. Livelihood ‘Strategies’ or ‘Pathways’ ... 31

3.1.3.3. Livelihood Outcomes ... 35

3.2. Markets and Chain and Production Network Concepts ... 37

3.2.1. Global Commodity Chains ... 39

(8)

3.2.3. Global Production Networks ... 42

3.2.4. Development by Upgrading ... 44

3.2.4.1. Concepts of Upgrading ... 44

3.2.4.2. Upgrading in Agriculture by Contract and Outgrower Farming ... 48

3.3. Theoretical Synthesis ... 55

3.3.1. Arguing for a Combination of SLF and GVC/GPN Approaches ... 55

3.3.2. Approach Taken ... 57

3.3.3. Research Questions ... 61

4. Methods ... 63

4.1. Course of Action and Method Application... 63

4.2. General Field Access and Interaction ... 65

4.2.1. At Community Level ... 65

4.2.2. At Administrative Level ... 70

4.2.3. At Trader Level ... 71

4.3. Methods in Detail ... 71

4.3.1. Farm Budgets and In-depth Interviews ... 72

4.3.2. Expert and Individual Interviews ... 73

4.3.3. Farmer Focus Group Discussions (FGDs) ... 74

4.3.4. MOFA/Expert FGDs and Surveys... 77

4.3.5. Household Head Survey ... 78

4.3.6. Secondary Data Collection and Archive Survey ... 79

4.4. Triangulation ... 80

5. Livelihood Systems under Investigation ... 83

5.1. General and Spatial Principles of Livelihood Upkeep ... 83

5.1.1. Crops for Food or Income ... 96

5.1.2. Crops for Social Capital and Well-Being ... 101

5.1.3. Major Issues Encountered in the Agrarian Cycle ... 104

5.2. Environmental Assets ... 110

5.2.1. Soil Properties, Changes and Sustainable Land Use ... 110

(9)

5.2.2. Livelihood Impacts of Soil Changes ... 115

5.2.3. Climatic Properties, Changes and Sustainable Land Use ... 121

5.2.4. Livelihood Impacts of Climatic Change... 131

5.3. Man-Made Assets ... 138

5.3.1. Basic Infrastructure and Services ... 138

5.3.2. Housing Infrastructure ... 144

5.3.3. Demographics, Health and Labour Force ... 148

5.3.4. Education and Religion ... 153

5.3.5. Finances ... 159

5.3.5.1. Outlines of Savings ... 159

5.3.5.2. Outlines of Liquid Financial Capital ... 161

5.3.5.3. Sources of Credit and Support ... 162

5.3.5.4. Crops and Possible Incomes... 163

5.3.6. Social Interaction and Cooperation ... 169

5.3.6.1. Horizontal Social Capital ... 170

5.3.6.2. Vertical Social Capital ... 174

5.4. Major Livelihood Outcomes and Opportunities ... 184

5.4.1. Food and Income ... 184

5.4.2. Natural Resource Base Usage and Resilience to Climate Change ... 190

5.4.3. Well-Being ... 195

5.4.4. Summarised Insights Generated on Overall Vulnerability and Potentials 197 5.4.4.1. Transformation, Results and Potentials of Environmental Factors ... 198

5.4.4.2. Transformation, Results and Potentials of Social Factors... 201

6. Markets ... 204

6.1. The Tomato Market ... 205

6.1.1. General Overview ... 205

6.1.2. Local Structure and Geography ... 208

6.1.3. Access, Inputs and Outputs ... 213

(10)

6.1.3.2. Public Tomato Processing ... 219

6.1.3.3. Private Tomato Processing ... 221

6.1.4. Governance Dynamics ... 223

6.1.4.1. Fresh Tomato Trade ... 223

6.1.4.2. Public Tomato Processing ... 231

6.1.4.3. Private Tomato Processing ... 235

6.1.5. Conclusion ... 239

6.2. The Chili Market ... 246

6.2.1. General Overview ... 246

6.2.2. Local Structure and Geography ... 248

6.2.3. Access, Inputs and Outputs ... 250

6.2.4. Governance Dynamics ... 256

6.2.5. Conclusion ... 260

6.3. The Rice Market ... 264

6.3.1. General Overview ... 264

6.3.2. Local Structure and Geography ... 268

6.3.3. Access, Inputs and Outputs ... 272

6.3.4. Governance Dynamics ... 281

6.3.4.1. Governance Dynamics in General Rice Trade ... 281

6.3.4.2. Governance Dynamics in Public Programmes ... 286

6.3.4.3. Governance Dynamics in the USAID ADVANCE Programme ... 297

6.3.5. Conclusion ... 304

7. Sustainable Livelihoods and Value Chains ... 312

7.1. Theoretical insights ... 312

7.2. Central Aspects of Livelihoods and Avenues to Sustainability ... 316

References ... 321

(11)

List of Figures

Figure 1: Possible levels of engagement of sponsors/lead firms in CF arrangements ... 50

Figure 2: Risk and power allocation in CF and out-grower arrangements, according to models ... 52

Figure 3: Framework for livelihood sustainability under market effects ... 58

Figure 4: Research design and course of action in the field ... 64

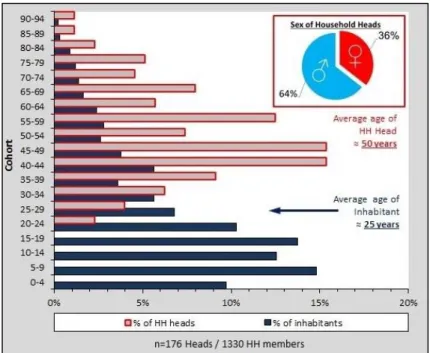
Figure 5: Age and sex of survey participants ... 79

Figure 6: Model of sociological explanation ... 81

Figure 7: Cropping calendar for major rainfed crops in Bui and Mirigu ... 87

Figure 8: Cropping calendar for major irrigated crops in Bui and Mirigu ... 95

Figure 9: Trends in crops (2003-2013) by gender of respondent in Biu ... 96

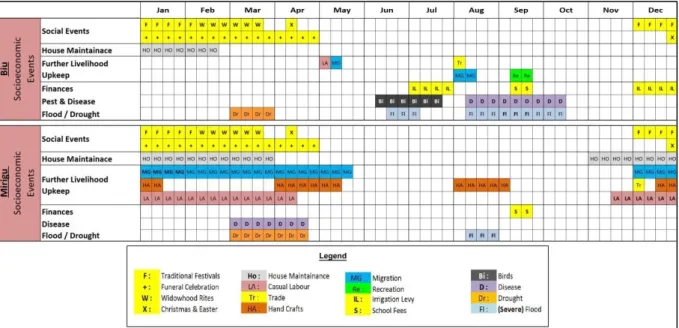
Figure 10: Community events in Biu and Mirigu ... 103

Figure 11: Severity of issues within agrarian cycles/natural capital endowment and usage in Biu ... 106

Figure 12: Inequality in land use in Biu ... 107

Figure 13: Major trends in natural capital endowment as perceived by household heads in Biu ... 109

Figure 14: Trends in animal holdings as perceived by household heads in Biu ... 109

Figure 15: Trends in crop diseases as perceived by household heads in Biu ... 116

Figure 16: Long-term (1980-2005) average rainfall (mm), relative humidity (RH); potential evapotranspiration (PET) and temperature (T) for Navrongo ... 122

Figure 17: Timeline of floods, droughts and famines/food shortages (black boxes, with year) in the Biu-Navrongo-Mirigu area ... 128

Figure 18: Annual (green) and 5-year moving average rainfall (red) in Navrongo from 1961 to 2009 ... 128

Figure 19: Onset of wet-seasons in the Navrongo area, sowing time of millet and incidents of food shortages ... 129

Figure 20: Sowing times of millet from 1905 to 1950 and in 2012/13, and incidents of food shortages and famines in the Navrongo area ... 130

Figure 21: Vertically exaggerated land use profile of Biu from south-west to north-east ... 131

Figure 22: Population pyramid for Biu and Central Mirigu in 2010 ... 151

Figure 23: Timeline of famines/food shortages and disease in the Navrongo-Mirigu-Biu area ... 152

Figure 24: Education levels among Biu’s inhabitants ... 155

(12)

Figure 26: Average costs of selected, irrigated crops, expected yields, prices and net returns per

acre in the 4th quarter of 2012 at common wage of 6 GH₵/man-day... 165

Figure 27: Estimated prices and production costs of ‘optimal’ shea nuts processing and butter

production at minimum and common wage in 2012 ... 166

Figure 28: Estimated farm gate prices of rice, tomato, chili and shea in 2012 ... 167

Figure 29: Major (coloured) and minor (shaded) selling times of selected crops and their major

planting times (‘P’) ... 167

Figure 30: Trends in financial capital and its major sources ... 168

Figure 31: Annual inflation and adjusted growth in farm gate prices of selected crops in Biu

and Mirigu ... 169

Figure 32: Gender and household decisions in Biu ... 171

Figure 33: Trends in the 'sweetness of business interaction' (0 = ‘bad’ to 10 = ‘great’) in Biu

(above) and Mirigu (below) with regard to selected cash crops... 178

Figure 34: Willingness to betray government and private entities among the thereby supported

and the general public in Biu ... 179

Figure 35: Seasonality of 'severe'/'above normal' lack of finances and times of hunger among

female and male headed households in Biu ... 186

Figure 36: Trends in food and finances as perceived by female and male household heads in

Biu ... 186

Figure 37: Duration of money and food shortages according to attested difficulty in attaining

inorganic fertilisers in Biu ... 190

Figure 38: Trends in major well-being indicators as perceived by female and male household

heads in Biu ... 195

Figure 39: Major associations between relevant elements of vulnerability, as based on code co-

occurrences in all qualitative data ... 198

Figure 40: Production, imports and exports of tomato products in Ghana... 206

Figure 41: The Ghanaian tomato value chain ... 212

Figure 42: Intensity of associations made between tomato chain access and assets required

(left) and chain outcomes for farmers’ assets and livelihood outcomes (right) ... 214

Figure 43: Illustration of tomato production costs, expected yields, average prices (January-

March 2012) and net returns per acre at minimum wage of 4.8 GH₵/man-day ... 215

Figure 44: Tomato wholesale prices... 216

Figure 45: Composition of the average kilo retail price of tomato from northern Ghana and

Burkina Faso, sold in Accra from January to March 2012 ... 217

Figure 46: Production of chili in Ghana ... 247

Figure 47: The (northern) Ghanaian chili value chain ... 250

(13)

Figure 48: Intensity of associations made between chili chain access and assets required (left)

and chain outcomes for farmers’ assets and livelihood outcomes (right) ... 253

Figure 49: Illustration of chili costs, expected yields, prices (2012) and net returns per acre at

minimum wage of 4.8 GH₵/man-day ... 254

Figure 50: Estimated average composition of the kilogram retail price of chili from Northern

Ghana, sold in Accra during the 1st quarter of 2012 ... 255

Figure 51: Production and major imports and exports of milled rice in Ghana ... 266

Figure 52: Hectares under rice cultivation at the Tono Irrigation Project from 1985 to 2011

according to season and usage ... 269

Figure 53: The northern Jasmine rice value chain ... 272

Figure 54: Intensity of associations made between rice chain access and assets required (left)

and chain outcomes for farmers’ assets and livelihood outcomes (right) ... 276

Figure 55: Estimates of paddy Jasmine rice production costs, expected yields, average prices

(June – July 2012) and net returns per acre at minimum wage of 4.8 GH₵/man-day ... 276

Figure 56: Prices of rice at district, southern Ghanaian and world level from 2009 to 2012 .. 278

Figure 57: Estimated average composition of the kilogram retail price of milled Jasmine rice

grain from irrigation projects in Northern Ghana, sold in Accra in June – July 2012 ... 278

Figure 58: Illustrations of paddy Jasmine rice production costs, yields, average prices (June –

July 2012) and net returns per acre at minimum wage ... 280

Figure 59: Illustration of margins per acre according to socio-economic stand of producer .. 280

Figure 60: Allocation of all Block Farming subsides in 2012 at anonymised district level .... 293

Figure 61: Flowchart of all traceable, legal and illegal government subsidy usages ... 307

(14)

List of Tables

Table 1: Relevant sub-topics and theoretical approaches used ... 62

Table 2: Sub-topics of research and their methodological approach ... 63

Table 3: Major primary data outcome of research by place ... 65

Table 4: Data types collected according to method and scale ... 82

Table 5: Ranking of crops ... 101

Table 6: Growth periods of major rainfed crops ... 136

Table 7: Population change in in the region and district of the study areas ... 149

Table 8: Costs of one emergency shelter ... 160

Table 9: Primary costs of production for irrigated rice at average intensity and an expected yield of 2 tonnes per acre... 162

Table 10: Pearson correlations of land uses and the duration of food and income insecurity 187 Table 11: Estimated costs of NSTC’s processing of 1 kilo of tomato paste in 2010 ... 220

Table 12: Development of yields, farm gate prices, farmers’ net returns and margins under Expom’s production model ... 222

Table 13: Estimated cost of Expom’s processing of 1 kg of tomato paste in 2010 ... 222

Table 14: Landed cost of 1 kg of imported tomato concentrate ... 222

Table 15: Planned and actual allocation of subsidised fertiliser bags (50 kg) among districts of

the Upper East Region in 2012 ... 289

(15)

List of Maps

Map 1: The study areas, Biu and Mirigu ... 83

Map 2: Illustration of major land reserves and usages in Mirigu ... 85

Map 3: Illustration of major land reserves and usages in Biu ... 86

Map 4: Wet season, compound land use ... 88

Map 5: Growth in compound densities (per km²) from 1967 to 2008 in Biu (left) and Mirigu (right) ... 89

Map 6: SGI garden of five farmers in Mirigu ... 94

Map 7: Irrigated fields near Biu ... 94

Map 8: Biu’s sections, its ‘centre’ (purple), irrigation user density and infrastructure with exposition to flooding in 1966/2010... 132

Map 9: Mirigu’s ‘centre’ (purple to blue) and infrastructure with exposition to flooding in 1966/2010 ... 132

Map 10: Major infrastructure and houses in central Biu and Mirigu ... 140

Map 11: Major regions of rice production in Ghana, according to their contribution to total

domestic production in 2011 ... 268

(16)

List of Photos

Photo 1: Communal land preparation during the wet season in Biu ... 87

Photo 2: Sublateral canals at the Tono irrigation scheme near Biu ... 91

Photo 3: Furrow irrigation at the Tono irrigation scheme near Biu ... 92

Photo 4: Dry season river dugout near Mirigu ... 92

Photo 5: Dry season wells with bucket irrigation in Mirigu ... 93

Photo 6: ICOUR rice silo near Nasia ... 141

Photo 7: ICOUR rice scale and mill near Nasia ... 141

Photo 8: Broken and dismantled equipment at the ICOUR workshop ... 142

Photo 9: Broken sublateral canal serving low lands near Biu ... 143

Photo 10: Traditional compound structure cross section (upper left), mud compound (upper right), roofed square compound (lower left), concrete house (lower right) ... 148

Photo 11: Public school building in Biu ... 154

Photo 12: The NSTC paste factory in Pwalugu, UER, Ghana ... 211

(17)

List of Abbreviations

AAGDS Accelerated Growth and Development Strategy

Ac Acres

ADVANCE Agricultural Development and Value Chain Enhancement programme AGS Accelerated Growth Strategy

BF Block Farming

BUSAC Business Sector Advocacy Challenge Fund

CF Contract Farming

CFA Colonies Françaises d’Afrique DCE District Chief Executive

DS Dry Season

ECOWAS Economic Community of West African States

EDAIF Export Development and Agricultural Investment Fund EDIF Export Development and Investment Fund

EPA Economic Partnership Agreement EPAG Environmental Protection Agency ERP Economic Reform Program

FAO Food and Agriculture Organization of the United Nations FASDEP Food and Agricultural Sector Development Policy FBO Farmer-based Organisation

FGD Focus Group Discussion

GATT General Agreement on Trade and Tariffs GAWU Ghana Agricultural Workers’ Union GCC Global Commodity Chain

GDP Gross Domestic Product

GH₵ Ghana Cedi

GIHOC Ghana Industrial Holding Corporation

GIZ Gesellschaft für Internationale Zusammenarbeit GmbH GNAFF Ghana National Association of Farmers and Fishermen GPRS Ghana Poverty Reduction Strategy

GSGDA Ghana Shared Growth and Development Agenda GVC Global Value Chain

Ha Hectares

HH Household

HHH Household Head

HIPC Heavily Indebted Poor Country Initiative ICOUR Irrigation Company of Upper Region IMF International Monetary Fund

KfW Kreditanstalt für Wiederaufbau KND Kassena Nankana District

M4P Making Markets Work for the Poor MDG Millennium Development Goal

METASIP Medium Term Agriculture Sector Investment Plan

(18)

MIDA Millennium Development Authority MOFA Ministry of Food and Agriculture MOTI Ministry of Trade and Industry MTI Mercury Tomato Industries

N.P.K. Nitrogen, Phosphorous, Potash/Potassium Fertiliser NADMO National Disaster Management Organization NAFCO National Food Buffer Stock Company NDC National Democratic Congress

NGO Non-governmental Organisation NLC National Liberation Council NPP New Patriotic Party

NSTC Northern Star Tomato Company NTTA National Tomato Trader Association PFL Premium Food Limited

PRA Participatory Rural Appraisal PRSP Poverty Reduction Strategy Paper PSI President’s Special Initiative

RADU Regional Agriculture Development Unit SADA Savannah Accelerated Development Authority SAP Structural Adjustment Program

SGI Shallow Groundwater Irrigation SLF Sustainable Livelihood Framework

TICFU Tono Irrigation Cooperative Farmers’ Union UER Upper East Region

UN United Nations

USAID United States Agency for International Development USSR Union of Soviet Socialist Republics

VC Value Chain

WS Wet Season

WTO World Trade Organisation

YIAP Youth in Agriculture Program

ZEF Zentrum für Entwicklungsforschung

(19)

1. Introduction and Overview

This study is concerned with the sustainable development of smallholders’ livelihoods in northern Ghana under climatic change and market influences, whereby the latter are altered by government and foreign aid interventions in agricultural value chains. Research was conducted in Ghana’s north, in the Upper East Region, traditionally characterised as having the highest levels of poverty in the country (AL-HASSAN 2013: 226). In this regard interventions in the agricultural sector are of special importance, since farming directly employs almost the entire population (GHANA STATISTICAL SERVICE 2013: 285). Public agricultural development policies and programmes have attempted, with minor successes, to address the issue of poverty in Ghana’s north since the country’s independence. However, some of these policies have intensified nationwide disparities, to the disadvantage of the north (SONGSORE 2011; YARO 2013). In addition, smallholders in the region are nowadays confronted with severe climatic and environmental change as well as the effects of globalisation processes, a form of ‘double exposure’, and as such are said to be having severe difficulties in coping with these circumstances (LAUBE et al. 2011: 753). Yet, in recent years, public as well as externally funded approaches have placed a focus on the north through interventions aiming at smallholder market integration by the targeted support of crucial leverage points in selected agricultural value chains (GOVERNMENT OF GHANA 2010; OUMA et al. 2012: 227-228; PWC GHANA 2013: 5, 27;

YARO 2013: 12). Among the value chains of special significance to northern Ghana are those of chili, tomato, and rice, parts of which are supported by public and donor endeavours. Since the effects of these public and donor value chain involvements on poverty are still mostly unknown, they need to be tested according to their local, pro-poor impact. Focussing on agricultural markets of chili, tomato and rice – products that are mostly grown in northern Ghana – and interventions within their value chain, this thesis thereby explores the potential for economically, environmentally and socially suitable, thus ‘sustainable’ development of male and female smallholders’ livelihoods.

The theoretical framework of this study brings together human, market and environmentally

orientated development approaches to conceptualise and test this policy-market-poverty nexus

accordingly, to thereby enable a closer look into the implications, constraints and opportunities for

sustainable smallholder development. It accomplishes this goal by applying the sustainable

livelihoods approach, which covers aspects of agency in a given social and physical context. The

approach is enriched with value chain analysis and elements of global production network

analysis to emphasise the outcomes of market integration and intervention. Chapter 2 provides an

introduction to the wider vulnerability context of the region by giving an overview of historical

and contemporary policy and foreign aid interventions. Chapter 3 distils and presents the

(20)

using a methodology, which included diverse methods, outlined in Chapter 4. Chapter 5 narrows

down the analytical view of the study to the livelihood system level. Using the data gathered over

a 10-month stay (2012/13) in two villages – Biu and Mirigu – of the Upper East, the chapter

centres upon the use people make of their changing natural and social environment. A major

component of the peoples’ livelihood outcomes relates to value chain integration of tomato, chili,

and rice production, which are altered by government and development aid interventions. These,

the resulting chains’ structures, their avenues for access, their possibilities for upgrading and their

contributions to livelihood sustainability are then examined in Chapter 6. Final conclusions are

then drawn in Chapter 7.

(21)

2. Background: Development Policies and Northern Ghanaian Poverty

Ghana’s economic and political history is generally subdivided into four phases: the pre- and post-independence period, the period of economic and structural adjustment and, the present- era, post-adjustment. This chapter summarises insights derived from this history, to derive crucial leverage points that can be observed in future attempts to bring pro-poor development to the Upper East Region, where poverty in Ghana has always been most severe.

2.1. Pre-Independence

In pre-colonial days the utilization of land and the seasonal cultivation of crops in northern Ghana and its Upper East Region were mostly governed by religious beliefs, embodied by so called ‘Earth Priests’ (the ‘Tengnyam’, a.k.a. landlords). These administered land decentrally and were political leaders of local settlements at the same time (TONAH 2008: 116). Peasant communities in northern Ghana were mostly characterised by a subsistence economy, the exploitation of the immediate natural environment. Yet, that is not to say that peasants had not become parts of larger, commercial trade systems. Since the fourth century, dense trade networks had been woven between Saharan, northern Ghanaian and more southern market towns. Trade across the desert and into today’s Ghana was organised through multiple ‘Saharan ports’. Until the middle of the 18th century it was mostly gold, ivory, cotton, ostrich feathers and slaves which were exported by camel, caravan trade. Furthermore multiple internal trade channels connected regions within Ghana, carrying mainly local products such as foodstuffs and local crafts, but also few European goods (GRÉGOIRE 1997: 91). Major trade routes – connecting what is nowadays southern Ghana to Burkina Faso – went through today’s Upper East Region. As a result, the northern regions of Ghana had progressed prior to colonialisation, due to the middleman role they played. Their strategically favourable location had initiated the formation of a small (upper) class of merchants, aside the aforementioned Earth Priests (SONGSORE 2011: 153).

Colonial rule under the British – following the annexation of northern Ghana by 1901 – then consciously induced socio-economic north-south disparities in Ghana, to the disadvantage of northern parts of the country, to attract labourers to the south of the country (AHWOI 2010: 4;

LAUBE 2007: 60; SONGSORE 2011: 81-85, 153; YARO 2013: 6). Most economically useful infrastructure, commercial crop production, mining activities and general economic value of the land, became heavily concentrated within the southern parts of Ghana (SCHULTZE 1955:

Beilagen 3-7). The ‘golden triangle’ between Accra, Kumasi and Sekondi-Takoradi prospered

(GRÉGOIRE 1997: 92), while the north of Ghana was increasingly characterised by a mass of

semi-proletarianized peasantry (SONGSORE 2011: 88-90), now partly under indirect rule of

chiefs which had been enthroned by the British (AMANOR 2008: 63). On top of the severe

conflicts that caused with the former leaders – the landlords – little to no positive socio-economic

(22)

development took place in northern Ghana under colonial government (YARO 2013: 7). But, with independence in 1957 under Kwame Nkrumah, the first indigenous president of Ghana, underdevelopment of the north gained more political attention.

2.2. Post-Independence (1957 to 1983)

Opposed to previous colonial policies and as a sign of independence, Ghana embarked on economic protectionism. Massive state participation in the economy and especially in agriculture, far beyond the Marshallian-type of intervention as found in Europe following World War Two, was seen as a historical necessity. In order to industrialise the country, to diversify the primary production portfolio of the economy and to create economic opportunities, import substitution policies were implemented in the early 1960s. Tariff and non-tariff measures were further used as trade barriers to limit imports. The importation of final goods was heavily restricted to protect domestic, especially government industries. Exchange control, tariffs and quantitative controls were introduced to encourage domestic manufacturing. Domestic infant industries were to grow, at the cost of restricting movement of goods, people, information and by keeping multinational enterprises out of the country (LARYEA & AKUONI 2012: 10-12; SONGSORE 2011: 102).

Thus, the era from independence to the mid-1960s saw the emergence of the state as the engine of general economic growth (AHWOI 2010: 5-6), partly also in northern Ghana.

Economic programmes prior to independence had largely neglected/underdeveloped the north of the country. Nkrumah, however, wanted to turn Ghana’s north into the bread basket of the country, essentially, by establishing agro-industries to be fed by large-scale irrigation projects (LAUBE 2007: 64). He envisioned an industrialisation of the northern countryside that was to initiate rural development with the help of out-grower, contract farming schemes. Improvements in food security and well-being were then to come from increased farmer incomes through better market access (AMANOR & PABI 2007: 56). State-owned industries were to be created throughout Ghana and especially in its north to source raw materials from large state farms and peasants (AHWOI 2010: 5-6). Another elementary aspect of the newly formulated policies was the promotion by the government of cash crops in northern Ghana. Seen as a way to diversify the economy, agricultural inputs, among them ploughs and tractors, seeds and fertilisers, were heavily subsidised (AMANOR & PABI 2007: 56; see also FAO 2005; LAUBE 2007: 64). The government constructed 104 small dams in the Upper East (LAUBE et al. 2008: 9) and dry-season cash crop gardening, such as tomato and chili, were actively encouraged (ADU 1969: 17-18).

Furthermore, crops like rice and tomato from the newly envisioned ‘Vea’ irrigation scheme were to feed future agro-processing facilities in the Upper East Region (FAO 1970: iii, 1; LAUBE 2007: 92). As a result of government intervention, tomatoes became the main type of cash-crops.

Further government initiatives included the construction of a rice mill in the regional capital

(23)

Bolgatanga. At the time, a rapid shift in consumer preferences to rice had taken place, owing to increased incomes in the urban centres of the south, government pricing policies, as well as the grain’s good storability and ease of cooking. From 1957, rice production was greatly expanded in the north of Ghana. At least until the end of the 1990s, and if not until today, the rice processing factory and mill remained the region’s largest agro-industrial establishments (ADU 1969: 17-18;

CATHOLIC CHURCH NAVRONGO 1905-1920; GHANA STATISTICAL SERVICE 2005: 8- 12; OTENG 1997: 38; VOSCON ASSOCIATES & MAGNA CONSULTING 1997: 5; YARO 2013: 6, 11).

Nkrumah’s rule contributed to an economic upturn in the Upper East Region. The region was increasingly integrated into the domestic economy and was able to attract some investments in infrastructure and public services, which resulted in some poverty alleviation (ADU 1969: 17- 18). However, Nkrumah’s success in fighting poverty in the north was greatly limited since most of the support was captured by private, bureaucratic or political elites. Furthermore, distributional patterns of support corresponded with the geographical patterns of political interests, most of which were based in the south of the country. A wealthy, urban society, mostly southern-based, came to live off the rural poor, even by exploiting services that were specifically designated to serve the needs of the (northern) poor (SONGSORE 2011: 107, 154-155; YARO 2013: 8). Aside from this, government overrule of the economy, hoarding, speculation, illegal exchanges and contraband also diminished state resources, which led to shortages, created black markets and contributed heavily to the failure of Nkrumah’s economic programmes (LAUBE 2007: 66).

Economic activity took place underground, in a parallel economy known as the ‘kalabule’ system (SONGSORE 2011: 163). Therefore, the government’s balance of payments came under pressure by financial constraints (LARYEA & AKUONI 2012: 10). Nkrumah was overthrown in 1966 as a result of growing public dissatisfaction and unrest (AHWOI 2010: 6).

The National Liberation Council (NLC) came into power and started privatising state-

owned enterprises and farms in order to consolidate the economy (AHWOI 2010: 6). They

pursued a neo-liberal approach to development at the nation-wide level, although this did not stop

them from initiating a public tomato processing factory in the Upper East, the Northern Star

Tomato Company (NSTC). Prior to this, little agro-processing had taken place in Ghana

(ROBINSON & KOLAVALLI 2010: 1). This public industry was ‘established with an over-

optimistic expectation’ which did ‘not so materialise’, due to a lack of quality personnel and final

products (FAO 1970: 2). The processing industry depended entirely on domestic demand, but

local consumers showed no interest in its products. Despite high duties, importation still offered a

greater margin to vendors, and, moreover, consumers continued to prefer foreign products due to

their perceived or real superior quality (SCHÜRMANN 1967: 4-11). Also, the tomato processing

(24)

generators, making it highly unattractive to producers (VOSCON ASSOCIATES & MAGNA CONSULTING 1997: 6).

Initiating such agro-processing to contribute to poverty reduction in the Upper East was of little success and the industry continued to suffer over the decades to come. The initiated factory was characterised by poor operational efficiency, underutilisation of capacities, thus high operation costs and could only survive behind high tariffs walls as they constantly made losses over the 1960s and 1970s. This not only further diminished government resources, but led to declining real incomes in agricultural, non-industrial areas, because these government industries, as much as other non-government industries, were greatly dependent on imported raw materials.

The high production costs reflected in higher consumer prices, which disadvantaged the poorest in northern Ghana. As a result of the continued failure to improve lives in the north, disparities in Ghana kept on growing.

Ghana’s southern ‘golden triangle’ continued to prosper, but not the north of Ghana as had once been planned. By 1969, 86 percent of all registered industrial enterprises, over 80 percent of the labour force and over 90 percent of the value added to industry, were found in the Accra- Sekondi-Takoradi-Kumasi area. The north of the country continued to suffer from severe poverty, leading to further migration to the cities of the south. Spatial concentration of the economy in the south was thus further cemented during immediate post-colonial times, because aside from the aforementioned tomato paste factory, the vast majority of government interventions had actually continued to foster the southern-based cocoa production and trade. Sharpening contradictions in nationwide socio-economic well-being and social marginalisation were the result. State-led growth in agriculture had utterly neglected the food crops sector, especially in northern Ghana, despite the fact that most of the North’s peasants were engaged in food crop production. From the 1960s, domestic food demand began to outstrip the country’s agricultural production. Food prices and imports rose steadily as a result, but imports were restricted by foreign exchange constraints and thus exacerbated demands made on the government’s financial resources (SONGSORE 2011:

109-112, 126, 130, 171).

In 1969 the Progress Party (PP) tried to return the economy to a more market-oriented, capitalist system. It withdrew government support to agriculture and agro-processing as a result of its growing financial problems. Only minor macroeconomic management was able to take place before a military coup, in 1972, ended all economic consolidation efforts (LARYEA & AKUONI 2012: 12). The military National Redemption Council started to pursue a policy of food and raw material self-sufficiency that involved enormous government spending. Duty exoneration and subsidies on agricultural inputs were designed to attract private investors and ease peasants’

production constraints (AHWOI 2010: 6-7; AMANOR & PABI 2007: 56; FAO 2005: 13).

Reacting to rising food prices and imports, further investment in food crop production was made

(25)

under the names ‘Operation Feed Yourself’ and ‘Operation Feed Your Industry’ (SONGSORE 2011: 130). At no time in Ghanaian history were subsidies as high as they were at this time, i.e.

the mid to late 1970s. Northern Ghana received considerable support to produce rice and tomato, among other products, to feed consumers in the south. Fertilisers, seeds, bullock ploughs, tractors, and combine harvesters were made available in local service centres at subsidised rates (YARO 2013: 8). Additionally, research was initiated to find further suitable places for large-scale irrigation in the north (SOIL RESEARCH INSTITUTE 1977: 1). The ‘Tono Irrigation Project’ – put in place by 1975 until the middle of the 1980s – became one of the largest agricultural dams in West Africa. It allowed production of rice and tomato on larger scales and irrigates an area of about 2000 ha, used by several thousand farmers coming from eight nearby villages. It also includes silos with a capacity of 700 tonnes as well as grinding mills for rice, aside 42 km of canals and 120 km of road networks. The project is managed by the “Irrigation Company of the Upper Region” (ICOUR), which further takes care of a smaller irrigation scheme nearby, the Vea irrigation project. Both, but especially the Tono irrigation project, sought to further integrate local producers into the national economy (i.e. the demand structures of the south), to provide economic opportunities to larger sections of the population, to ease perennial food shortages by the production of staples, and to counter the high rate of migration from the north (GHANA STATISTICAL SERVICE 2005: 8-10; ICOUR 2009: 2; LAUBE 2009: 2, 89; MDEMU 2008: 14- 15; TONAH 2008: 113).

Despite a multitude of further projects put in place aside the above mentioned and an all- time high in public spending, often to support rice production, outcomes in terms of poverty alleviation in northern Ghana remained low during the 1970s. Public projects caused interregional disparities to increase, because from the beneficiaries of government subsidies were, once again, richer people, namely civil servants, businessmen, contractors and military officers, most hailing from the traditional industrial core regions of the south. Intraregional disparities grew similarly:

though receiving considerably less in absolute amounts, the subsidies that reached the north of Ghana went almost entirely to local elites who earned high incomes through rice farming, comparable to cocoa farmers in the south. The vast majority of northern peasants were forced to remain at subsistence level (SONGSORE 2011: 130, 134, 178). The rent-seeking behaviour of local elites was partly the result of government intervention that excluded paying attention to most traditional crops in northern Ghana, which are also those produced by the poor. Thus effective purchasing power and also food security of the most vulnerable decreased, which overall led to a lowering of living standards in the north.

By the mid-1970s, the situation led to famines in northern Ghana ‘in the midst of plenty’

(YARO 2013: 9). Elite capture and government misconduct was also reflected in the management

(26)

Irrigation Project ‘was the result of a long, opaque and wasteful process, which made it one of the most expensive irrigation projects ever constructed worldwide’ (LAUBE 2007: 89). Moreover, most lands in the project’s command area were overtaken by ‘richer farmers, allowing the poor ones, very little or no access’ (YARO 2013: 9). Many externally funded projects were of similar, minor success. Ambitious objectives, inadequate funding and poor coordination made these fail (Ibid.: 10). Potential investors and government officials ‘found it more profitable to engage in rent-seeking and other corrupt behaviours, rather than growth-enhancing activities’ (ACKAH &

BAAH-BOATEN 2012: 33). At best one could say that governments from the 1970s until 1983 took decisions on political but not economic grounds, showing little understanding for the consequences of their actions. Furthermore, the country endured additional coups in 1979 and 1981, which came about mostly due to the persisting, poor economic conditions (LARYEA &

AKUONI 2012: 12). It was a period of instability with ‘successive and frequent changes in political leadership through the barrel of the gun affecting both economic and agricultural policies’ (AHWOI 2010: 5), resulting in economic decay, mostly in the north (LAUBE 2007: 66).

From the mid-1970s to the early 1980s most (public) industries and economic activities collapsed. Government finances were ruined: by the early 1980s, 65 percent of total government expenditure had to go into deficit reduction. The economy shrunk drastically and was later forced to embark on recovery programmes prescribed by the World Bank and the International Monetary Fund (IMF). This structural crisis came earlier than most other African countries because of the severe mismanagement and excessive rent-seeking by the ruling military oligarchy. Only later were these trends exacerbated by the collapse of commodity prices and oil price shocks (SONGSORE 2011: 124, 163, 169, 207). In 1981, Jerry Rawlings initiated reforms characterizing the next era of the region’s agro-economic development: the Economic Reform Programmes (ERPs) and Structural Adjustment Programmes (SAPs). These were side-lined by several international trade agreements, namely the General Agreement on Trade and Tariffs (GATT), the World Trade Organisation (WTO), as well as the Bretton Woods institutions (LARYEA &

AKUONI 2012: 10). Reforms were much needed, as ‘the country was on the brink of economic

collapse’ (LAUBE 2007: 74). Given the state of the government’s financial resources and the

economy as a whole, room for political decision-making was severely limited. ‘Neither the USSR,

nor East European countries, Cuba or Libya would, or could, provide concessional finance on

anything like the scale needed to restore the economic infrastructure and productive capacity of

Ghana’ (RIMMER 1992: 181). Ghana was forced to rely on the IMF and the World Bank, who

made strict neo-liberal reforms a precondition for support.

(27)

2.3. Structural Adjustment and Economic Reform (1983 to the mid-2000s)

In its period of economic reform, distortions in Ghana’s economy were removed, trade and exchange rates were liberalised, and emphasis was placed on non-traditional exports and, moreover, export led industrialisation (AHWOI 2010: 7; LARYEA & AKUONI 2012: 10). The Economic Reform Programmes (ERPs) and Structural Adjustment Programmes (SAPs) put emphasis on a free market system whereby market prices were given a central role in the allocation of resources (AHWOI 2010: 7). The main function of the state was now to provide for not much more than ‘an enabling environment for market driven and private enterprise-led economic growth’ (SONGSORE 2011: 166).

ERPs started in 1983 and came in three phases. ERP I lasted from 1983 to 1986 and was primarily concerned with stabilising the economy, by reducing inflation and external deficits and by export rehabilitation through social and economic infrastructure restoration to promote economic growth (SONGSORE 2011: 167). SAPs followed in the same year. As a result, a foreign exchange retention scheme for non-traditional exports was liberalised and the proportion that could be retained was increased in 1987. Several initiatives were made in order to attract investments into agriculture. They included tax exemptions and rebates, investment guarantees, free trade zones with additional income and dividend tax cuts and the possibility of foreign ownership (AHWOI 2010: 9-10). ERP II, from 1987 to 1990, also focused on macroeconomic stability through GDP growth, a lower inflation rate and an improved balance of payments. Import licensing schemes were abolished by 1988, because they were considered redundant since exchange rates were now market-determined. Taxes on imported fruits and vegetables were lowered severely (SONGSORE 2011: 167). To reduce government spending and because donors were no longer willing to support inefficient government industries, processing ventures, such as the tomato factory in the Upper East Region, were forced to close by 1989/1999 (CLOTTEY et al.

2009: 1437; LAUBE 2007: 197).

ERP III set a new emphasis from the early 1990s onwards. Instead of only focusing on economic recovery, it aimed at accelerated growth. The Accelerated Growth Strategy (AGS) was formulated, whereby sustainable development and poverty reduction, with the private sector as the engine of growth, were at the focus. Intersectoral linkages were promoted, especially in the agro- industry. Poverty was to be reduced by labour-intensive, high productivity activities and through better access of the poor to social services through decentralisation. Education and health gained more importance in policies besides capacity building, public sector management and private sector development (SONGSORE 2011: 167-168). In 1992, import quotas were completely abolished and tariffs for food commodities were reduced to 20 percent (ROBINSON &

KOLAVALLI 2010: 2).

(28)

Adjustment efforts were continued over the decade. In early 2000, Ghana’s simple average tariff was further lowered, but after only three months in effect special importation taxes were reintroduced at 20 percent. At the time, these were lower for members of the Economic Community of West African States (ECOWAS), but it took until 2002 for these tariffs to be entirely abolished, in order to bring regulations in line with ECOWAS and WTO provisions (ACKAH, ARYEETEY and MORRISSEY 2012: 104; LARYEA & AKUONI 2012: 14-16).

ECOWAS, commissioned to promote economic integration across the region by gradually removing barriers and the eventual creation of a customs union, was established in 1975.

However, trade liberalization was introduced after 1990 and showed little progress until 1993, when the treaty started to be revised which then led to a removal of all trade barriers by the year 2000. Additionally, until 2004, a common external tariff was to be established, but negotiations were delayed. Only members of the CFA zone, a bloc within ECOWAS, created a common external tariff. Negotiations on further alignments are still on-going and may include Ghana at some point (ACKAH, ARYEETEY and OPOKU 2012: 51; LARYEA & AKUONI 2012: 25).

These events were side-lined by a further relief measure to government finances that came in 1996, when the HIPC (Heavily Indebted Poor Country) Initiative was introduced by the World Bank, IMF and G8. It allowed the freeing of financial resources, which would have otherwise gone into the paying of debts. The HIPC Initiative came with the conditionality of designing Poverty Reduction Strategy Papers (PRSPs). The first outcome was the Ghana Poverty Reduction Strategy (GPRS I), covering the timeframe 2003 to 2005, and being the first to address poverty reduction directly. In its initial phase it aimed at macro-economic stability through economic growth, modernisation of agriculture, human resource development, good governance, and a focus on the vulnerable and excluded (SONGSORE 2011: 254-256). GPRS I was deemed to be ‘a sound macroeconomic framework’ (IFAD 2006: 5) and promised to target not only priority sectors, but especially those areas in which poverty was known to be chronic, i.e. northern Ghana (SONGSORE 2011: 261). Further support came from one of the largest externally-funded projects put in place since 2006, the Millennium Challenge Account grant. This US government supervised intervention aimed at commercializing agriculture, specifically to create a competitive horticultural industry (WHITFIELD 2011b: 31 & 32).

2.4. The Cost of Adjustment

The reforms of the 1980s, 1990s and 2000s were somewhat successful at a macro-economic

level, since they resulted in an increased growth rate, a reduced budget deficit and a lower

inflation rate (AHWOI 2010: 7). Yet, the overall effects of these reforms on poverty in the north

were rather bad. Both Economic Reform Programmes (ERPs) and Structural Adjustment

Programmes (SAPs) – the major guidelines to government policies – forced the government to cut

(29)

spending and withdraw most support for agricultural, especially for inputs and agro-processing, and to cut tariffs. Moreover, the various government agencies that had previously undertaken the production, import and distribution of farm inputs were forced to close. Input prices rose sharply, especially that of fertiliser. Nationwide fertiliser consumption fell drastically and did not increase again until the second half of the 1990s. Generally, due to devaluation and price-deregulation for consumer goods and farming inputs, prices escalated (AHWOI 2010: 8; AMANOR & PABI 2007: 56; FAO 2005: 13; KHOR & HORMEKU 2006: 4-5; LAUBE et al. 2008: 3; SONGSORE 2011: 179).

Moreover, the Ghanaian farmer increasingly faced stiffer competition from overseas markets. Overall, decreases in tariffs had led to rising imports of agricultural commodities, especially tomato paste, rice and chicken from Europe, the USA and China among other countries. Further imports of fresh tomato came from Ghana’s ECOWAS neighbours, especially from Burkina Faso (FAOSTAT 2011). In combination with the forced withdrawal of government support for production, these factors were later blamed for severely undermining economic activities, and thereby human development, in Ghana’s north. Newspapers reported tomato-farmer suicides in the Upper East Region on an annual basis, international NGOs talked of threats to farmers’ human rights and food security (PAASCH 2008: 12-17) and scientific publications talked of economic practices that would devastate the livelihoods of northern Ghana’s farmers (LAUBE et al. 2011: 753; PAASCH 2008; SEND FOUNDATION 2008; SONGSORE 2011:

263). Due to imports of rice, production in Ghana’s Upper East Region decreased and its major mills closed down. Furthermore, tomato paste imports were blamed for making local production unprofitable (YARO 2013: 10-11) and for the shutdown of tomato processing in the Upper East (ROBINSON & KOLAVALLI 2010: 2), the showpiece of previous development approaches.

During the period of economic and structural adjustment, in terms of investment the government almost completely neglected the agricultural economy of the north. Government promotion of smallholder participation in the economy via irrigation schemes was of little success. Attempts to intensify agriculture failed, because people were unable to acquire the farm inputs needed, credit schemes collapsed and extension services were insufficient (LAUBE 2007:

75). Instead the government maintained its focus on the southern industrial core and cocoa producers (ACKAH & BAAH-BOATEN 2012: 45-47; SONGSORE 2011: 173-178;

WHITFIELD 2011b: 31, 32). Within the 2005 District Industrialisation Programme, for example,

Ghana’s north received no attention and only little effort was indicated to modernize agriculture

and support agribusiness in the region (AHWOI 2010: 9-10; KYEREMATEN 2007: 77). Of the

GPRS I funds that came through the HIPC Initiative, the little that was spent in the north had a

minor, positive contribution to poverty reduction. Although the programme specifically aimed to

(30)

regional prioritization of the allocation of funds clearly favoured Ghana’s south, e.g. the money spent in all northern regions (with one of them being the Upper East) combined was about as much as some southern regions received for themselves (SONGSORE 2011: 260). Other government projects in the north remained only ad hoc interventions undertaken in pilot communities (YARO 2013: 11-12).

Externally funded interventions also neglected the north. The Millennium Challenge Account achieved little (WHITFIELD 2011b: 31-32) and did not even mention the poorest regions in Ghana – among them the Upper East Region – as a priority for investment (SONGSORE 2011: 264). Again, the core regions, the ‘golden triangle’, with its cocoa, timber and mineral export economy continued to get most of the support. Southern farmers received publicly funded, technical support and export promotion packages, while further benefiting from guaranteed prices and publicly financed spraying of fields. No comparable activities were pursued for food crop farmers in the north. Thus, these farmers were forced to continue their work under low productivity and income (ACKAH & BAAH-BOATEN 2012: 45-47).

Subsistence agriculture on degraded lands with declining yields and without government support, further intensified seasonal hunger in Ghana’s north. Agriculture in the north was unable to keep up with developments in the south. As a result of the unequal allocation of economic stimuli and resulting lopsided growth, the terms of inter-regional trade shifted to the disadvantage of northern Ghanaian staple-crop growing farmers. Due to the SAPs, the terms of trade turned against food producers to the benefit of non-food consumer items, which came from the south.

The major food crops grown in the north were not covered by a minimum guarantee price, resulting in the de-intensification of agriculture and low farm gate prices (LAUBE 2007: 75;

SONGSORE 2011: 173-180, 264, 281-284). An increase in northern farmers’ incomes would have been required to help the farmers deal with the SAPs-induced government withdrawal of support (SONGSORE 2011: 173-178). Policies pursued throughout the ERP and SAP period caused increased poverty among certain sections of the population, especially unskilled households content with agriculture (ACKAH, MORRISSEY, et al. 2012: 98) and food producers in the north.

Northern Ghana, since the 1980s, constantly accounted for the highest levels of poverty in the country (GHANA STATISTICAL SERVICE 2013: 184). In 1991/92 about 33 percent of all Ghana’s poor came from the savannah of the north. By 1998/99 this number had risen to 37 percent and it kept rising to 50 percent in 2005/06. That meant that in 1991/92, 73 percent of the savannah population suffered from poverty, 70 percent in 1998/99 and 60 percent in 2005/06.

During the 1990s, reduction of poverty mainly took place in Accra and the southern forest

regions. 60 percent of the North’s people constantly suffered from extreme poverty, whilst on a

nationwide scale, levels dropped from 36 to 27 percent (SONGSORE 2011: 180-190, 261).

Abbildung

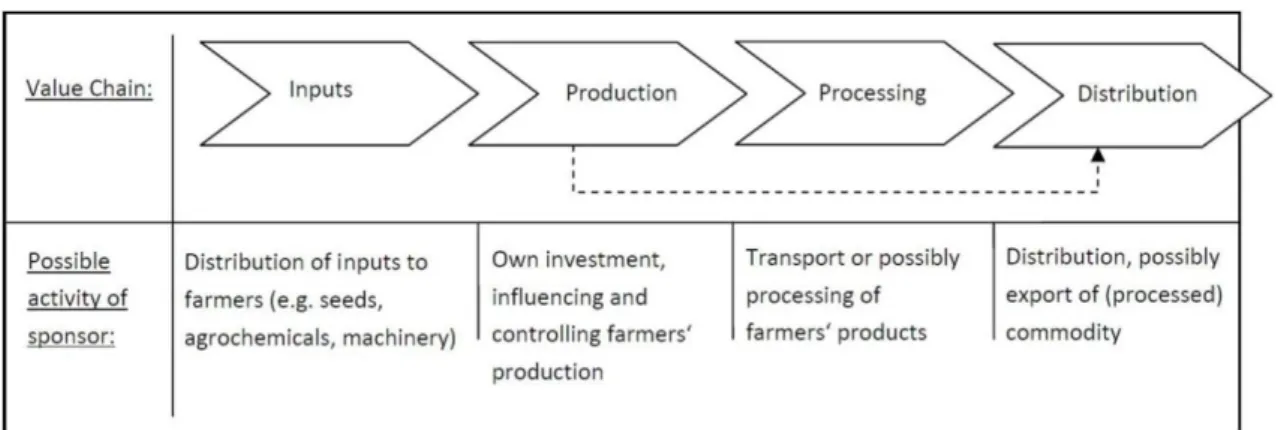
Figure 1: Possible levels of engagement of sponsors/lead firms in CF arrangements (own Figure,  2010, based on SIMMONS 2003: 3)
Figure  2:  Risk  and  power  allocation  in  CF  and  out-grower  arrangements,  according  to  models  (own  figure,  2014,  based  on  DA  SILVA  2005a:  15-18;  EATON  &  SHEPHERD  2001:  44-56;
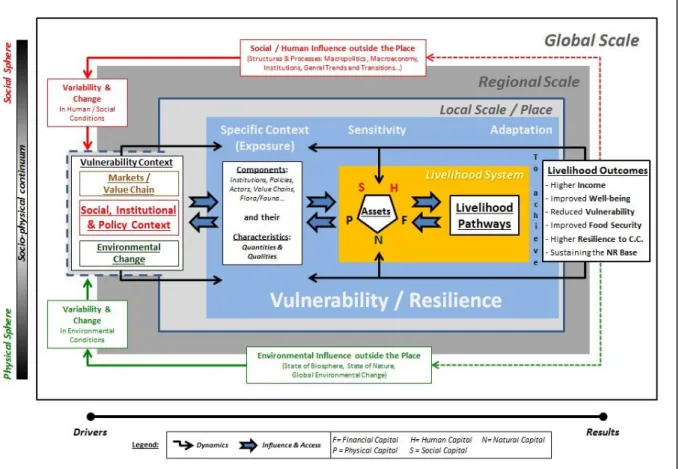
Figure 3: Framework for  livelihood sustainability under market effects  (own figure, 2014, partly  based on DFID 2001: Section 1.1; TURNER et al
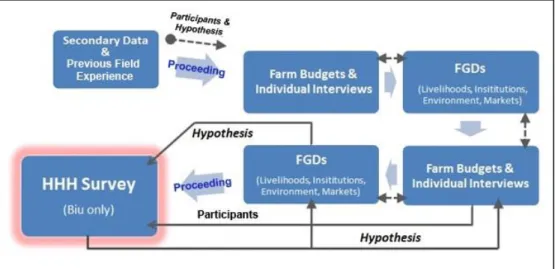
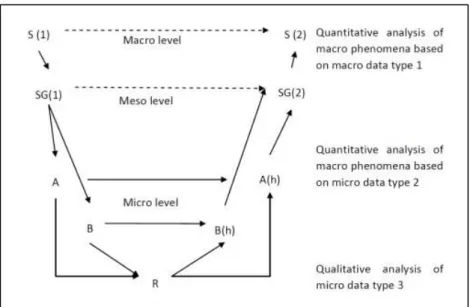
Figure 4: Research design and course of action in the field  (own figure, 2014).
+7

Referenzen

ÄHNLICHE DOKUMENTE

The performance of organizations that handle a problem change is primarily positively affected (that is, cycle time is reduced) by high task awareness and high update rate of

At the same time, qualified in-kind donations of goods, forming part of the assets of a business, will not trigger VAT in the period from 15 July 2021 to 31 October 2021, but

Bishop and Cicchetti (1975) hint that: "By separating the problem the way he [i.e., Schmalensee] does, the uncertainty and trade-offs of the early literature are lost."*

2.1 Combinatorial Complexity Problems of Interoperability between the Players For improved understanding of the dependencies between the various service providers, the examination

(7), when the prey and the predator are asymmetric with respect to their valuations, the type of equilibrium depends both on the effectiveness of their armies and on the ratio of

We take the whole of this body of work as read, in what we present here, for the simple reason that we do not have the time to repeat it. We do not repeat it also because we have

Likewise equation 13 can only hold true in a society which reproduces itself equally perfectly and unchangingly (as Sraffa himself remarks) but with a fully

To summarize, the results from our cross-cultural studies on the value of children and intergenerational relationships give empirical support to the need to further study