Signal Transduction
distinct ways to elicit either a sustained or a transient response, which can have dramatically different conse- quences (Marshall, 1995)? These and other questions Reinhart Heinrich,1Benjamin G. Neel,2
and Tom A. Rapoport3,4
1Institute of Biology
Department of Biophysics can be addressed by a mathematical description of sig- naling pathways.
Humboldt-University
42 Invalidenstrasse Mathematical modeling is a powerful method for the
analysis of complex biological systems. Modeling has Berlin, D-10115
Germany been used extensively to study metabolic networks, re-
sulting in a theory, termed control analysis, that de-
2Division of Hematology-Oncology
Department of Medicine scribes in quantitative terms the role of metabolic en- zymes in the regulation of pathway fluxes and metabolite Beth Israel Deaconess Medical Center and
Harvard Medical School concentrations (Kacser and Burns, 1973; Heinrich and Rapoport, 1974; Westerhoff and Chen, 1984; Reder, 330 Brookline Avenue
3Howard Hughes Medical Institute and 1988; Hofmeyr et al., 1993; Fell, 1997; Cornish-Bowden and Ca´rdenas, 2000). Modeling is useful for describing Department of Cell Biology
Harvard Medical School experimental data, deducing regulatory principles, and understanding more complex dynamic phenomena 240 Longwood Avenue
Boston, Massachusetts 02115 such as oscillations in metabolic pathways (see Heinrich and Schuster, 1996).
Although some specific pathways and reaction schemes have been analyzed (e.g., Huang and Ferrell, Summary
1996; Kholodenko et al., 1999; Brightman and Fell, 2000;
Asthagiri and Lauffenburger, 2001), mathematical mod- We have developed a mathematical theory that de-
scribes the regulation of signaling pathways as a func- eling of signal transduction is at an early stage. A particu- larly thorough simulation was performed on a signaling tion of a limited number of key parameters. Our analy-
sis includes linear kinase-phosphatase cascades, as network using experimentally determined rate constants and component concentrations (Bhalla and Iyengar, well as systems containing feedback interactions,
crosstalk with other signaling pathways, and/or scaf- 1999; Bhalla, 2001). In many other cases, such quantita- tive kinetic data are unavailable, but even without these folding and G proteins. We find that phosphatases
have a more pronounced effect than kinases on the data, mathematical models can enhance our under- standing of regulatory principles and pinpoint critical rate and duration of signaling, whereas signal ampli-
tude is controlled primarily by kinases. The simplest parameters for further experimentation.
We have developed mathematical models for the large model pathways allow amplified signaling only at the
expense of slow signal propagation. More complex class of receptor-stimulated kinase/phosphatase sig- naling cascades. We analyze key features, such as the and realistic pathways can combine high amplification
and signaling rates with maintenance of a stable off- amplitude of the signal output, and the rate and duration of signaling. Our results provide insight into the regula- state. Our models also explain how different agonists
can evoke transient or sustained signaling of the same tory roles of the signaling components and may help to explain the design of pathways.
pathway and provide a rationale for signaling pathway design.
Results Introduction
Overall Rationale
An enormous amount of information has accumulated To simplify the analysis, we first consider a simple linear about the components of various signaling pathways, signaling cascade in which stimulation of a receptor their interplay, and their final output. However, the com- leads to the consecutive activation of several down- plex nature of these pathways renders it extremely diffi- stream protein kinases (Figure 1). The signal output of cult to understand how they are regulated and which this pathway is the phosphorylation of the last kinase parameters determine their dynamics. For example, how which, in turn, can elicit a cellular response (e.g., activa- do the magnitudes of signal output and signal duration tion of a transcription factor). Signaling is terminated by depend on the kinetic properties of pathway compo- phosphatases, which dephosphorylate the kinases, and nents, such as kinases or phosphatases? Can high sig- by inactivation of the receptor, which can involve recep- nal amplification be coupled with fast signaling? How tor dephosphorylation, internalization of the receptor- are signaling pathways designed to ensure that they are ligand complex, and/or degradation of the receptor or safely off in the absence of stimulation, yet display high ligand.
signal amplification following receptor activation? How This general scheme is representative of many signal- can different agonists stimulate the same pathway in ing pathways. For example, growth factors such as EGF, PDGF, or NGF stimulate a receptor tyrosine kinase (RTK), which leads to the activation of three or four consecutive
4Correspondence: tom_rapoport@hms.harvard.edu
tion; thus, the dephosphorylation rate of theith kinase is given byd,i⫽ iXi, whereiis the rate constant for dephosphorylation byith phosphatase.
For all but the first activated kinase in the pathway, the concentration of each activated kinaseias a function of time, i.e.,Xi(t), is given by the solution of the family of differential equations:
dXi
dt ⫽ p,i⫺ d,i⫽ ␣˜iXi⫺1X˜i⫺ iXi. (1) If we defineCi⫽X˜i⫹Xias the total concentration of kinasei(i.e., the sum of the phospho- and dephospho- forms) and␣i⫽ ␣˜iCias a pseudo-first order rate constant, Equation 1 becomes
dXi
dt ⫽ ␣iXi⫺1冢1⫺XCii冣⫺ iXi. (2)
For the first kinase (X1), activation occurs via the stimu- lated receptor, and inactivation is mediated by phospha- tase 1. Therefore, in place of Equation 2, we have
Figure 1. Simple Signal Transduction Cascades dX1
dt ⫽ ␣1R(t)冢1⫺XC11冣⫺ 1X1 (3)
In this scheme, R and Xiindicate the activated receptor and kinases, respectively.is the rate constant for inactivation of the receptor,
and␣iandiare rate constants for the kinase and phosphatase whereR(t) is the concentration of the activated receptor reactions, respectively.
as a function of time.
For our initial analysis, we assume that all pathway components are inactive basally and then undergo rapid downstream kinases (e.g., Raf, MEK, ERK, and RSK)
stimulation, which is modeled by setting the concentra- (Cobb, 1999). Growth factor signals are terminated by
tion of active receptor att⫽0 toR. Receptor inactivation protein-tyrosine phosphatases (PTPs), RTK endocytosis
by various processes (see above) is approximated by the and degradation, protein serine-threonine phospha-
equationR(t)⫽exp(⫺t), where 1/is the characteristic tases, and dual-specificity and tyrosine-specific MAP
time of the active receptor. The smaller the value of, kinase phosphatases (Keyse, 2000). The same type of
the longer the receptor will be in the activated state. In scheme can model pathways that include lipid kinases,
the limiting case of→0, the pathway is permanently such as PI3K, whose reaction products (3-phosphoino-
activated.
sitides) help to activate downstream kinases such as
For any signal transduction system, three key ques- PDK1 and Akt (Toker, 2000; Vanhaesenbroeck and
tions are: (1) How fast does the signal arrive at its desti- Alessi, 2000).
nation? (2) How long does the signal last? and (3) How Typically, real signaling pathways are more compli-
strong is the signal? To provide answers to these ques- cated than this simple scheme. Therefore, in later stages
tions, we introduce three key parameters: (i) the signal- of our analysis, we will consider the effects of crosstalk
ing time,i, is the average time to activate kinasei; (ii) between signaling pathways, the binding of kinases to
the signal duration,i, is the average time during which scaffolding proteins, the requirement that multiple sites
kinaseiremains activated; and (iii) the signal amplitude, be phosphorylated to activate a kinase, and the partici-
Si, is the average concentration of activated kinasei.
pation of G proteins.
Occasionally, we also refer to the signaling rate, defined simply as the reciprocal of the signaling time ( ⫽1/n).
Linear Signaling Cascades The signaling timeiis given by To derive equations that describe the dynamics of the
signaling cascade schematized in Figure 1, we retain
i⫽Ti
Ii, whereIi⫽冮∞
0
Xi(t)dt, andTi⫽冮∞
0
tXi(t)dt. (4) the essentials of reactions while neglecting their mecha-
nistic details. Each phosphorylation step is described
as a reaction between the phosphorylated form Xi⫺1of Ii, the integrated response ofXi, is the total amount of kinasei⫺1 in the pathway and the nonphosphorylated active kinasei generated during the signaling period, form X˜iof a downstream kinase (i). The phosphorylation and thus can be used to characterize signal output (As- rate for each reaction in the pathway is given by the thagiri et al., 2000). If one plotsXiversus time (Figure expressionp,i⫽ ␣˜iXi⫺1X˜i, where␣˜iis the second order 2),Iicorresponds to the area under the curve (shaded).
rate constant for phosphorylation by the ith kinase. The ratioTi/Iiis an average, analogous to the mean value These equations implicity assume that the concentration of a statistical distribution.
of each kinase-substrate complex is small compared with The signal duration is given by the total concentration of the reaction partners. Assuming
that the concentration of active phosphatase is constant, i⫽冪QIii
⫺ 2i, whereQi⫽冮∞
0
t2Xi(t)dt. (5) dephosphorylation can be modeled as a first order reac-
pendix). For the signaling time through the entire path- way one obtains
⫽1
⫹兺n
j⫽1
1
j, (8)
i.e.,is the sum of the characteristic times (and thus, of inverse of the rate constants; see above) for receptor decay and phosphatase action. Remarkably, under these conditions is independent of the kinase rate constants, and all phosphatases have the same effect on, regardless of their position in the pathway. This is in contrast to metabolic pathways or most other reaction schemes, including “strong activation” of signaling pathways (see below), in which all kinetic parameters help to determine signaling time.
For signal duration one obtains Figure 2. Geometric Representation of the Signaling Time, signal
⫽冪12⫹兺n
j⫽1
1
2j. (9) duration, and signal amplitudeS.
Shown is the hypothetical time course of the activity of kinasei in a signaling pathway following receptor stimulation. Geometric
Note that this too is independent of the kinase rate interpretations of the definitions of,, andSwere based on Equa-
constants, and all phosphatases have the same effect.
tions 4–6. Note that the definition ofSleads to a value that is not
Finally, for signal amplitude one obtains identical with the maximum of the curve.
iis similar to the standard deviation of a statistical distri- S⫽ S0兿n
k⫽1
␣k
k
冪1⫹ 2j兺⫽n1
1
2j
(10) bution; thus, i gives a measure of how extended the
signaling response is around the mean time (Figure 2).
The signal amplitude,Si, is given by
whereS0is defined asR/2. In contrast to the signaling time and duration,Sdepends on the kinetic properties Si⫽ Ii
2i. (6) of all pathway components (i.e., receptor, kinases, and phosphatases). The above formula shows that high sig- In a geometric representation,Siis the height of a rectan- nal amplitudes are obtained with fast kinases and slow gle whose length is 2iand whose area equals the area phosphatases; moreover, the kinase rate constants under the curveXi(t) (Figure 2). have a stronger effect than those of the phosphatases.
These definitions can apply to a wide range of signal Thus, in a weakly activated pathway, kinases regulate shapes, including those that display more than one max- only signal amplitude, not signaling time or duration. In imum. They require only that the signal eventually re- contrast, phosphatases affect all of these parameters, turns to its initial ground state (otherwise the integrals and in the same direction; i.e., high amplitude can be in Equation 4 would not reach a finite value). If the ground achieved only with long signal duration and slow signal- state is attained only at infinite time (i.e., in a permanently ing rate. Analogous expressions for,, andScan be activated pathway;→0), signaling time and duration defined for any intermediate stepi. The equations above both tend to infinity, but the amplitudes still have finite show that the signaling time () and duration () increase values (derivation not shown; see also below). The above with the position in the cascade (i.e.,i⬎ i⫺1,i⬎ i⫺1), definitions are most appropriate if the rates of signal but signal amplitudes can increase or decrease along activation and inactivation are of the same order of mag- the pathway, as discussed below.
nitude. If kinase activation is much faster than inactiva-
tion, the decay of the activated kinase can be used to Amplification and Dampening
characterize signal duration (see below). At any step in a signaling cascade, a signal can be amplified (Si⬎Si⫺1), dampened (Si⬍Si⫺1), or remain constant (Si⫽Si⫺1). From Equation 10, one can derive Weakly Activated Pathways
that amplification at stepiwill occur if A pathway is termed “weakly activated” if all of its com-
ponent kinases are phosphorylated to a low degree
(Xi⬍⬍Ci). This may occur when the concentration of i⬍ ␣i冪1⫺␣2i12i⫺1
. (11)
activated receptor is low, when the receptor is rapidly inactivated, and/or when the kinases are present at high
Thus, amplification requires that the phosphatase rate concentrations. Under these conditions, Equation 2 sim-
constant (i) for a given reaction is small compared to plifies to
the kinase rate constant (␣i). Amplification at stepialso depends on signal duration at the preceding step (i.e., dXi
dt ⫽ ␣iXi⫺1⫺ iXi, (7) i⫺1); when signal duration at stepi⫺1 is long (i.e., large
i⫺1), amplification can be achieved even when the phos- phatase rate constant (for stepi) is high. Since signal and the key parameters can be calculated explicitly (Ap-
duration increases along the cascade (see above), am- plification is favored at later steps in a signaling pathway.
Since the expression within the square root of Equa- tion 11 must be positive, there is a lower limit fori⫺1
at which amplification can occur (i⫺1⬎1/␣i); i.e., signal duration at stepi⫺1 must be longer than the characteris- tic time (1/␣i) of the next kinase. For i⫺1→ ∞, which corresponds to the case in which the receptor and/
or an upstream kinase remain permanently activated, Equation 11 simplifies toi⬍ ␣i. Thus in a permanently activated pathway (e.g., as might occur in the presence of a constitutively activated RTK), signal amplification can be achieved at highervalues than in a time-depen- dent situation.
Examples of how our model predicts that a signal will traverse a pathway under conditions of weak activation are shown in Figure 3. If the amplification condition (Equation 11) is fulfilled for all steps (Figure 3A), the peak activity (i.e., signal amplitude) of each succeeding kinase (kinases 1 to 4 in the example) increases. In con- trast, if the amplification condition is not met at any step, the amplitudes of successive steps decrease (Fig- ure 3B). Alternatively, the amplification condition may be fulfilled only at later steps, owing to the increase in signal durationialong the pathway (see above). In that case, kinase amplitude could decrease in the upper part of the signaling cascade, while increasing in the lower part (inset; Figure 3B).
To evoke an appropriate biological response, the ulti- mate signal produced by a pathway must be of sufficient magnitude. Equation 10 implies that the same overall signal can be achieved with different combinations of kinase and phosphatase rate constants.
Longer Signaling Cascades Can Give Sharper
Figure 3. Amplification and Dampening in a Weakly Activated Sig- and Faster Signals
naling Cascade Our analysis reveals a surprising effect of the length of
(A) Signal amplification along a pathway consisting of four steps.
the signaling pathway. On the one hand, longer path-
The parameters used for these calculations were:␣i⫽1,i ⫽0.5, ways tend to increase signaling time and duration (see
⫽1, andCi⬎⬎1. The relative concentrationsXiof the individual Equations 8 and 9). However, longer pathways also per- activated kinases in the pathway were plotted versus time. The mit amplification to be distributed over more steps activities were normalized to the highest amplitude achieved by any (Equation 10), which allows the same signal output to be kinase (set as 1.0).
(B) Signal dampening along a pathway in which␣i⫽1,i ⫽1.1, achieved with faster individual phosphatase reactions.
⫽1, andCi⬎⬎1. The inset shows a case in which signal dampen- Together, these effects can result in a minimum for sig-
ing occurs in the upper part and signal amplification in the lower naling time and duration at a certain chain length (Figure
part of the cascade (␣i⫽1,i ⫽0.6, ⫽10).
4A; curves for 1- and 10-fold amplification). Figure 4B shows the signal output over time of pathways of differ- ent lengths (2–4 steps), each with the same overall ampli-
of an extremely slow phosphatase or fast kinase in a fication (10-fold). Clearly, as the number of steps in the
cascade. In such cases, the simplificationXi⬍⬍ Ciis pathway is increased, a signal can travel faster and be
no longer valid.
of shorter duration. In very short pathways (e.g., only
We first consider the properties of a system that is two steps), signal amplification can be achieved only
permanently in a strongly activated state. From the con- with slow signal propagation and prolonged signal dura-
ditiondXi/dt⫽0 one derives from Equation 2:
tion. This is probably biologically undesirable, poten- tially explaining why signaling cascades generally con-
Xi⫽ CiXi⫺1
i
␣i
Ci⫹Xi⫺1
, (12)
sist of multiple steps.
Strongly Activated Pathways
“Strong activation” occurs if one or more kinases are which relates the concentration of the activated form of kinase (Xi) to that of its upstream activator (Xi⫺1). This converted essentially completely to the phosphorylated,
activated state. This can occur as a consequence of formula is similar in form to the Michaelis-Menten equa- tion [VmaxS/(Km⫹S)] withCibeing the maximum concen- extensive stimulation of the receptor or the existence
Figure 5. Signal Amplification in a Strongly Activated Pathway The concentrations of the activated kinases (1–3) in a pathway were calculated for a permanently activated pathway ( ⫽0) as a function of the concentration of activated receptor. The parameter values were␣i⫽1,i⫽0.3, andCi⫽1. For comparison, the concentration of the activated receptor,R, is shown. Amplification (visualized as the distance between the curves 1, 2, and 3 at givenR) occurs below the indicated threshold,R⫽C(1⫺ i/␣i). Above this threshold, the signal is dampened along the pathway to reach a limiting value.
Calculations were also performed forCi⬎⬎1, corresponding to the weakly activated case (dashed lines).
values ofiand␣iare similar. Thus, signal amplification is less pronounced if a pathway is strongly activated.
Equation 12 can be applied repeatedly to relate the concentration of kinase i to the concentration of the activated receptor. Written in reciprocal form, one ob- tains
Figure 4. Effect of the Length of a Signaling Pathway on Signal 1 Xi
⫽兺i
j⫽1
1 Cj 兿i
k⫽j⫹1
k
␣k⫹1 R 兿i
k⫽1
k
␣k. (14) Output
(A) The signal durationwas calculated as a function of the length of
Equation 14 is again a Michaelis Menten-like equation the pathway (n) for overall amplifications ofSn/S0⫽0.1, 1.0, and 10.0,
respectively. Other parameters were:␣i⫽1, ⫽5, andCi⬎⬎1. ofXias a function of the receptor concentration (R):
(B) Shown is the time-dependence of the signal output, calculated forn⫽2, 3, and 4 and an overall amplification ofSn/S0⫽10. These
Xi⫽ Xmaxi R
KM,i⫹R, (15) calculations were performed with␣i⫽1, ⫽5, andCi⬎⬎1, and
differentvalues to keep the amplification constant;n⫽2, ⫽
0.0141 (Ⳏ ⫽100.0);n⫽3, ⫽0.1076 (Ⳏ ⫽16.1);n⫽4, ⫽ where KM,iis the effective Michaelis constant for the
0.2166 (Ⳏ ⫽9.3). receptor andXimax is the maximum concentration.
These equations imply that the behavior of a signaling system depends on the degree of its stimulation (Figure tration ofXi(analogous toVmax) andCii/␣ibeing the half 5). For weak activation andi⬍ ␣i, gradual signal amplifi- saturation constant (analogous toKm). cation along the pathway is observed, as discussed From Equation 12, it follows that signal amplification before (Figure 3A and compare the dashed lines for at stepi(i.e.,Xi⬎Xi⫺1) occurs if kinases 1 to 3 at a given value of R in Figure 5). In contrast, strong activation (Figure 5, solid curves) gives Xi⫺1⬍Ci冢1⫺ ␣ii冣. (13) lower levels of amplification, and amplification occurs only if the activated receptor R does not exceed a threshold concentration. IfRis equal to the threshold As in a weakly activated pathway (see above),i⬍ ␣iis
anecessarycondition for amplification (lest the term on level, the signal is propagated without amplification or dampening. Above the threshold, the signal decreases the right side of condition [13] be negative). However,
in a strongly activated pathway, this condition is not along the pathway to reach a limiting value.
Weakly and strongly activated pathways also differ sufficient. Instead, condition (13) shows that the concen-
tration of the activated kinaseXi⫺1also must be lower when time-dependent signaling is introduced (i.e., when the pathway is not permanently activated as above).
than the total concentration of the next kinase (Ci); in-
deed, it may have to be considerably lower unless the Consider the three possible routes to a strongly acti-
vated pathway: (1) strong receptor stimulation, (2) a par- pathway is dependent on the rate constants of the ki- nases as well as the phosphatases. However, the impact ticularly slow phosphatase, or (3) a particularly fast ki-
nase in the cascade. When the receptor is strongly of the kinases remains lower, since they affect signal duration logarithmically (see Equations 18 and 19). Also, stimulated and the phosphatases are fast compared to
receptor inactivation, the cascade will quickly attain a in a strongly activated pathway, upstream phospha- tases have a greater effect on signaling time and dura- quasi-steady state, during which kinase activation will
decay slowly. Since this is a highly asymmetrical time tion than downstream phosphatases (Equation 18), whereas with weak activation, phosphatase effects are course, we can define the signal duration as the time
at which the concentration of the activated form of the position independent (Equation 8). It may be shown that the basic conclusions based on Equations 18 and 19 last kinase (Xn) has declined to half of its initial quasi-
steady-state value. do not depend on the specific simplifying assumptions,
as long as there is no other particularly slow phospha- Inserting an expression for exponential decay of the
activated receptor into Equation 15, one obtains tase or fast kinase in the pathway (data not shown).
In our analysis so far, we assumed that all downstream kinases are inactive prior to receptor stimulation. We
⫽1
ln冢2⫹KRM冣. (16) have also considered the possibility that a downstream kinase(s) (j) may be active constitutively, by assuming The (1/) term also applies to a weakly activated path-
thatjcan autoactivate either in a mono- or bimolecular way with fast phosphatases (see Equation 8), but the
reaction (for details, see supplemental data at http:www.
additional term is specific for strong activation. The lat-
molecule.org/cgi/content/full/9/5/957/DC1). In realistic ter can increase the signal duration drastically if the
pathways, the basal activity should be low, and the sys- receptor concentration is high and the effectiveKMvalue
tem will behave similarly to those considered above, (as defined in Equation 15) is small. The effectiveKM
except that the effects caused by receptor stimulation value, in turn, depends on the rate constants and the
will be less pronounced. Similar conclusions apply if the length of the chain. To illustrate the property of the
unphosphorylated form of a kinase has some activity.
solutions of Equations 14 and 15, we set all␣’s equal, all’s equal, and allC’s equal (␣i⫽ ␣,i⫽ , andCi ⫽
Crosstalk between Signaling Pathways C). This allows a simplification of Equation 14 by
Binding of an agonist to its receptor may activate several applying the rules of geometric progression
different signaling cascades, which may influence one another by crosstalk. For example, PDGF receptor stim- KM⫽C(/␣)n(/␣ ⫺1)
(/␣)n⫺1 . (17)
ulation leads to the activation of the Ras/ERK and PI3 kinase/Akt pathways; the latter may inhibit an ERK-spe- Thus, long signal duration, caused by smallKM(Equation
cific phosphatase, contributing to sustained ERK activa- 16), will be seen if ⬍ ␣andnis large (Equation 17).
tion (Grammer and Blenis, 1997).
In the extreme case of ⬍⬍ ␣, the signal duration is
We model crosstalk by considering the perturbation linearly dependent on the number of steps in the cas-
of a given signaling cascade by component Y of another cade. Hence, signal duration can be much longer in a
pathway (Figure 6A). If component Y inhibits phospha- strongly activated (Equation 16), compared to a weakly
taseiin the pathway, one may write activated (Equation 9), pathway. Moreover, in contrast
to weak activation, the rate constants of both phospha-
i⫽ 0i
1⫹Y KI
, (20)
tasesandkinases (not phosphatases alone; see above) determine signal duration.
Similar analyses can be performed for pathways con-
taining a slow phosphatase or a fast kinase. Assuming where0iis the rate constant of the phosphataseiin the that the rate constant j for phosphatase j is much unperturbed situation andKIis the inhibition constant.
smaller than that of the other phosphatases and setting The concentration of component Y is assumed to be the latter all equal (i⫽ fori⬆j), signal duration can proportional to the concentration of the activated recep-
be approximated by the formula tor R.
To obtain explicit solutions and a qualitative descrip-
⬵(n⫺j)
j ln冢␣冣. (18) tion of the system, we assume that component Y inhibits all phosphatases and set the parameters of the different steps equal (␣i⫽ ␣,i⫽ , andCi ⫽C). Substituting For pathways with a fast kinase, the approximate solu-
expression (20) foriin Equation 12, the concentration tion is
of active receptor at which the signal is propagated at constant level through the pathway can be calculated
⬵j⫺1ln冢␣j冣, (19) from the following quadratic equation:
wherej⫺1is the signaling time up to stepj⫺1 and ␣j
R2⫹(KI⫺C)R⫺KIC冢1⫺ ␣0冣⫽0 . (21)
is the rate constant for the fast kinase (for derivation of Equations 18 and 19, see supplemental data at
http:www.molecule.org/cgi/content/full/9/5/957/DC1). The solution of this equation gives values ofRthat sepa- rate signal dampening from signal amplification. If this As is the case for strong receptor activation (and
again, unlike for weak activation), with either a slow equation has only one positive solution, the system be- haves identically to the unperturbed pathway analyzed phosphatase or a fast kinase, the signal duration for a
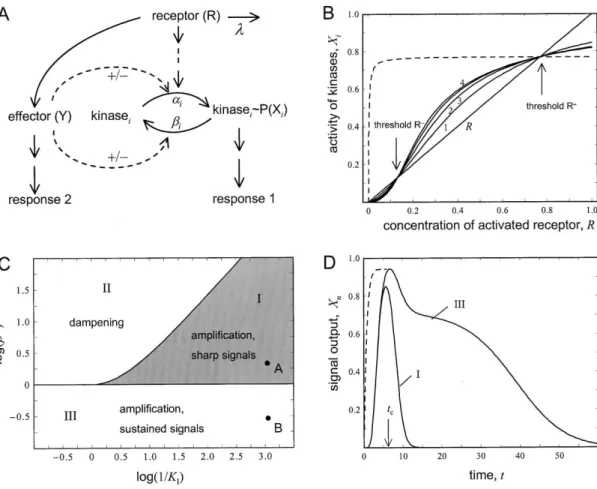
Figure 6. The Effect of Crosstalk on a Signaling Cascade
(A) Shown is a scheme in which a pathway similar to that in Figure 1 is affected by a component Y of another pathway. Both pathways are downstream of the same receptor. Component Y can act either on the kinase or phosphatase of stepiin a positive or negative manner.
(B) All phosphatases of a signaling pathway are assumed to be inhibited by component Y. Shown are the concentrations of the activated kinasesicalculated as a function of the concentration of a permanently activated receptor ( ⫽0). Parameter values:n⫽4,0/␣ ⫽2,C⫽ 1,KI⫽0.1. Amplification occurs only between the thresholdsR⫺andR⫹, and outside this region dampening is observed. For comparison, the dashed line shows the signal output (X4) in the absence of crosstalk and with ⫽0.23.
(C) Parameter regions corresponding to the different behavior of a cascade with crossinhibition of the phosphatases. The rate constant for the phosphatases (0) in the absence of inhibition is plotted against the inverse of the inhibition constant in a double logarithmic manner.
These calculations were performed with␣i⫽1. Parameter region I corresponds to amplification and gives an S-shaped curve, such as that shown in (B). Under these conditions, the time-dependence shows a sharp signal (see [D]). Parameter region II results in signal dampening along the pathway. Region III results in curves without a lower threshold and with sustained signaling (D).
(D) The time course of the signal output is calculated for parameter values corresponding to the points A and B in parameter regions I and III (C). For point A we choose0⫽2 and for point B0⫽3. Other parameters are:KI⫽8.0⫻10⫺4, ⫽1.tcis the time up to which the phosphatase inhibition is effective (see Equation 22). For comparison, calculations were performed for the case in which the kinases are activated by a component of another pathway (KA⫽8.0⫻10⫺4,0⫽0.3, dashed line). Only the initial phase of the time course is shown; at later time points the curve essentially coincides with the solid line.
before. However, if this equation has two positive solu- low but insensitive at high concentrations (Figure 5 and dashed curve in Figure 6B).
tions, there are two threshold values forR(R⫺andR⫹;
Figure 6B), as in the case of strong activation without Different combinations of0 andKIlead to distinct types of system behavior of the system (Figure 6C). In crosstalk (see Figure 5 and dashed line in Figure 6B).
Consequently, there are three distinct regions in which shaded area I, corresponding to strong inhibition (i.e., lowKI), Equation 21 has two positive solutions. For pa- the system displays different properties: belowR⫺, there
is signal dampening along the pathway, between R⫺ rameter combinations outside this shaded area, the sys- tem behaves as if there were no crosstalk: in area II, andR⫹there is amplification, and aboveR⫹, there again
is dampening. The resultant system has two novel prop- dampening occurs for allRvalues, whereas in area III, amplification occurs forRvalues below and dampening erties. First, it filters out small signals (i.e., belowR⫺);
only signals above this noise will be amplified. Second, forRvalues above a certain threshold value (see Figure 5). Although these calculations were performed for a the system remains sensitive over a wide range of recep-
tor activation (Figure 6B), whereas in an unperturbed drastically simplified systems (␣’s, ’s, and C’s are equal), qualitatively similar results are obtained as long pathway, the signal output is extremely responsive at
as the respective kinase and phosphatase rate con- talk, i.e., leading to activation of a phosphatase or in- hibition of a kinase, cause signal dampening (not shown).
stants are not extremely different from one another (not
shown). The most interesting consequence of crossin- Although such interactions may be important for the detailed response of a system, the more decisive cross- hibition of phosphatases is seen in the time-dependent
behavior of the system. Figure 6D shows plots of the talk mechanisms are activation of kinases and, particu- larly, inhibition of phosphatases.
signal output of a four component pathway as a function of time. Both curves are calculated for the same lowKI, i.e., for strong inhibition of the phosphatases. Curve III
is derived using the parameter combination correspond- Stability of Signaling Pathways
Signaling pathways must be stable in the off-state; i.e., ing to point B in Figure 6C (area III, low phosphatase
activity) and shows long signal duration. Curve I is calcu- gratuitous kinase stimulation should be dampened, lated from the parameter combination corresponding to rather than amplified. In mathematical terms this re- point A in Figure 6C (area I, high phosphatase activity) quires that, upon an infinitesimal change in the concen- and shows spike-like behavior. After receptor stimula- tration of an activated kinase, the system must return tion, the kinases are initially fully activated by the inhibi- to its ground state.
tion of the inactivating phosphatases, but the subse- One source of instability can be a positive feedback quent release of inhibition results in rapid termination loop. Consider the case in which the last kinase in a of signaling. The duration of the phase during which the pathway activates the first kinase. The term␣1Rin Equa- phosphatases are strongly inhibited (R(tc)/KI⬎ 1) can tion 3 is then replaced by␣1R ⫹ ⑀Xn, where⑀is the rate
be approximated by constant that characterizes the positive feedback. The
conditions under which the ground state (Xi⫽0) exhibits dynamic instability can be derived from the Eigenvalues tc⫽1
ln冢KRI冣. (22) of the Jacobi matrix:
Beyondtc, the signal decays as in an unperturbed path- 12…n⬍ ⑀␣2…␣n. (23) way, fast for parameter combinations corresponding to
area I in Figure 6C and slow for those represented by If this relation is fulfilled, the signaling cascade may be
area III. activated in the absence of receptor stimulation and
This spike-like behavior is a qualitatively novel behav- cannot return to the ground state following receptor ior of the system, which cannot be observed without inactivation. Notably, the conditions for instability crosstalk. In an unperturbed system, short signals (high (Equation 23) are identical to the amplification condi- phosphatase rates) are always linked to low amplitude. tions12…n⬍ ␣1␣2…␣nderived from Equation 10 for With crosstalk, however, amplification and short signal permanent pathway activation→0, except that␣1is duration can coexist. Interestingly, transition from a pro- replaced by⑀. Thus, high amplification also is potentially longed to a spike-like response can occur with relatively destabilizing. Indeed, a pathway can show amplification minor changes in the rate constants of the system (see and be stable only if the feedback parameter⑀is smaller legend to Figure 6D). This may explain how relatively than ␣1. These considerations suggest that positive moderate alterations of the conditions can lead to mark- feedback interactions may be infrequent in signal trans- edly different qualitative responses by the same signal- duction pathways. However, some signaling systems
ing pathway. are bistable, i.e., they can switch from one stable state
Although thus far we have assumed that all phospha-
at low level activation to another at high level activation, tases are inhibited simultaneously by component Y,
and such a behavior can be caused by positive feedback qualitatively similar (although less pronounced) effects
interactions (Ferrell, 2002; Ho¨fer et al., 2002). As the are seen if only one phosphatase is inhibited (not
switch-like behavior is required only for signal output, shown). The further upstream in a pathway that phos-
e.g., for a transcriptional response, the positive feed- phatase is located, the stronger these effects (see Equa-
back loop may be restricted to downstream portions of tion 18). This predicts that phosphatases regulated by
a pathway.
crosstalk may be preferentially located at the beginning
Another cause of instability may be insufficient kinase of a signaling cascade.
specificity. Consider the case in which kinasejcan phos- Qualitatively similar results are obtained when cross-
phorylate not only its normal substratej⫹1 but also talk with another pathway leads to strong activation of
kinaseiwith the rate constant␣ij. The differential equa- a kinase␣i⫽ ␣0i(1⫹Y/KA). The same three parameter
tions then read areas as in Figure 6C exist. The kinetics differ only at
early time points, during which activation of kinases
leads to immediate stimulation of the pathway (see dXi dt ⫽冢j兺⫽n1
␣ijXj冣 冢1⫺CXii冣⫺ iXi. (24)
dashed curve in Figure 6D). At later times, the signal output remains unchanged.
The consequences of kinase promiscuity for the stability These effects of crosstalk can be seen only if a phos-
of the system can be best appreciated if one assumes phatase is strongly inhibited or a kinase strongly acti-
that each kinase phosphorylates its immediate down- vated (by a factor of 100–1000). Since such drastic
stream target with the rate constant ␣ and all other changes are difficult to achieve with activations, inhibi-
kinases in the pathway with the rate constant⑀. The tion of phosphatases may be more relevant physiologi-
cally. Notably, the two other possible effects of cross- solution of Equation 24 results in parameter plots with
F·Ti
(FTi) ⫽Di,(FTi)Tj
(FTiTj)⫽Dij, (FTiTj)Tl
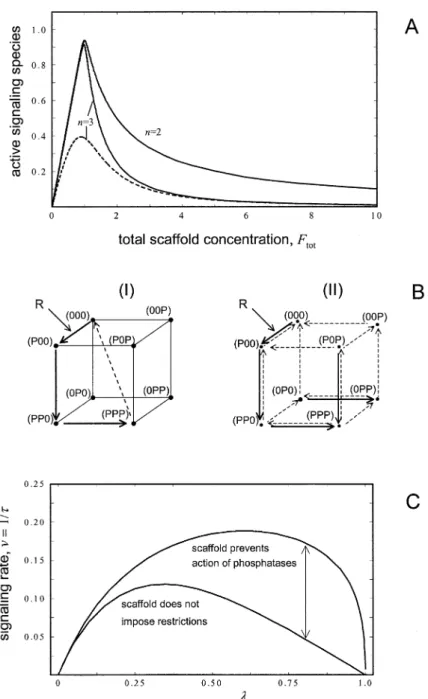
(FTiTjTl)⫽Dijl, (25) whereTi,Tj, andTlare the concentrations of the free kinases, the species in brackets are binary, ternary, and quaternary complexes of F with its kinase binding part- ners, and theD’s are dissociation constants. Using these equations, the concentration of the active species can be calculated from the total concentrations of the ki- nases and the scaffolding proteinFtot. Figure 8A shows the concentration of the active species as a function ofFtot, assuming that the active complex contains the scaffolding protein and all three kinases (FTiTjTl). The solid line (n⫽3) illustrates the system’s behavior when the kinases bind tightly to F (i.e., low dissociation con- stants): the active complex increases linearly to reach a maximum at which the concentrations of scaffolding Figure 7. Kinase Promiscuity Results in Signaling Pathway Instability
protein and kinases are about equal, and thereafter, The rate constant of the phosphatasesis plotted versus the rate
decreases steeply. The sharp decline reflects the de- constant⑀that describes the crossphosphorylation of kinases out-
side the actual pathway. These calculations were performed for␣ ⫽ creasing probability that all three kinases will bind to 1 and different pathway lengths (n⫽2, 4, or 6). Shaded areas the same scaffolding protein simultaneously (a situation correspond to parameter regions in which the system has a stable analogous to decreased immune complex formation in off-state and displays amplification when activated. Above this re-
the presence of antibody excess). If only two kinases are gion there is a stable off-state and dampening along the pathway
required to generate the active complex, the decrease is after activation, whereas below this region, the off-state is unstable.
less pronounced (Figure 8A, solid line;n⫽2). Alterna- tively, if the kinases bind to the scaffolding protein weakly (highD’s), only a small fraction of the total popu- lation of kinases is found in the active complex under three possible outcomes (Figure 7). Below the shaded
any condition (dashed curve;n⫽3). These results show area, i.e., for low phosphatase activity (small), the off-
that the scaffolding protein allows efficient signaling state of the pathway is unstable. Within the shaded area
only below a critical concentration. However, a large (intermediatevalues), the pathway is stable and signal
fraction of the kinases remains unutilized by the path- amplification occurs. Finally, with high phosphatase ac-
way. Obviously, such a situation would only be meaning- tivity (high), the system is stable but displays signal
ful if the unbound kinases were essentially inactive. The dampening. The higher the rate constant⑀for nonspe-
fact that scaffolding proteins may either stimulate or inhibit cific phosphorylation (i.e., the more promiscuous the
signaling, depending on their concentration, may explain kinases), the stronger the tendency toward instability.
differences in the observed effects of scaffolding protein Increasing the number of kinases in the system also
overexpression (e.g., Gu et al., 1998; Zhao et al., 1999).
increases the tendency toward instability (Figure 7; note
Although more speculative, another possible role for the increase in the area below the shaded region with
scaffolding proteins could be to sterically hinder phos- increasingn). Thus, the kinases in a system need to be
phatases from acting on bound kinases. To analyze this very specific to achieve stability, particularly if one takes
situation, we assume again that the scaffolding protein into account the large number of kinases in cells. A
can bind three kinases, resulting in a total of eight spe- further implication is that the broadening of the sub-
cies in which the scaffold-bound kinases have different strate range of a kinase, either by mutation or overex-
phosphorylation states (indicated in Figure 8B by “0” or pression, may lead to instability. This may help explain
“P” at the three positions within brackets). If phospha- the pathogenic consequences of some oncogenic muta-
tases cannot act on the bound kinases (scheme I in tions (Songyang et al., 1995; Piao et al., 1996).
Figure 8B), dephosphorylation is possible only after re- lease of all kinases (dashed arrow). If the phosphatases The Role of Scaffolding Proteins can act on the bound kinases, there are many potential Many signaling pathways utilize scaffolding proteins pathways for phosphorylation-dephosphorylation (see that bind multiple kinases in the pathway (for review see arrows in scheme II of Figure 8B).
Pawson and Scott, 1997). Several potential functions For both schemes, we have calculated that the signal- for scaffolding proteins have been proposed. ing rate and signal duration, assuming that the amplitude One possibility is that scaffolding proteins serve to of the signal output, species (PPP), has a given value.
activate a group of kinases. We consider a pathway in In Figure 8C, the signaling rate is plotted versus the rate which the component kinases are active only when constant of receptor inactivation (). For both schemes, bound to a scaffolding protein, F. Assume that F binds signaling becomes extremely slow if receptor inactiva- three consecutive kinases (e.g., the JIP proteins in the tion is slow (close to zero). If receptor inactivation is stress-activated JNK pathway; Whitmarsh and Davis, fast (close to 1), the rate constants for the phospha- tases have to be small to achieve a given amplitude, 1998). The following equilibria can be written