Photosensing in LOV domains: a computational study of signal transduction pathways
DISSERTATION
Presented to the Faculty of Chemistry and Pharmacy University of Regensburg, Germany
In partial fulfillment of the requirements for the Degree of
DOCTOR OF NATURAL SCIENCES (Dr. rer. nat.)
presented by IVAN STAMBOLIĆ
Belgrade (Serbia)from
Regensburg, 2017
The work presented has been supervised by Prof. Dr. Bernhard Dick.
Thesis has been submitted on 20. 02. 2017.
Thesis has been defended on 29. 03. 2017.
Supervisory committee:
Committee chair: Prof. Dr. Frank-Michael Matysik Primary supervisor: Prof. Dr. Bernhard Dick
Secondary supervisor: Prof. Dr. Dominik Horinek Committee member: Prof. Dr. Andreas Möglich
I
To the less fortunate ones
This is one corner... Of one country, in one continent, on one planet that’s a corner of a galaxy in a corner of the universe that is forever growing and shrinking and creating and destroying and never remaining the same. For a single millisecond. There is so, so much to see...
— J. Smith, DW
Acknowledgments
First of all, I would like to express my sincere gratitude to my supervisor Prof. Dr Bernhard Dick for his constant support, endless patience, continuous encouragement and for helping me grow as a researcher. He has been a tremendous mentor. All advice and help I received was invaluable. I would not have accomplished this work without his guidance and his unique sense of humor. I am very grateful to him for dedicating so much time training and guiding me how to become a better scientist.
I would like to thank Prof. Dr Dominik Horinek for taking over the responsibility, for offering critical discussions and for his helpful comments, feedback and guidance in advancing this work and my scientific career. He offered me great help and en- couragement during my graduate career, that I am very grateful for. In addition, I would also like to thank PD Dr Stephan Bäurle for all his thoughtful comments, support and scientific discussions.
I would like to give my thanks to the current and previous members of the Dick group for generating such a great, scientific and friendly environment for work and providing me with generous help and suggestions. I cannot think of a more inspiring and exciting place to work at. I would especially like to thank Kathrin Magerl for all her countless help, comments and selfless support, for never loosing patience with me and for all her guidance and encouragement when I needed it. I would like to thank Dr. Larisa Mataranga-Popa for her support and guidance during my time in the Dick lab. I would also like to thank Dr Sergeii Donets and Dr Anton Pershin who initiated some of the projects and provided the working framework for me.
Special thanks goes to Klaus Ziereis for his continuous technical aid and IT expertise.
I would like to thank Andrea Nömeier for her administrative assistance and support, which have made my graduate life worry free. Additionally, I would like to thank the current and previous members of the GRK Research Training Group 1626 for gener- ating helpful and critical scientific environment and for promoting the scientific way.
Finally, I would like to thank my dear friends and family, especially Milena Petković, Mladen Stojanović, Lidija Živanović, my brother Miljan Stambolić and my parents Dragana Stambolić and Zoran Stambolić. I would not have made it through without them. They needed to endure all my follies over the years and that is a true feat.
III
Abstract
Light-, Oxygen- and Votlage- (LOV) domains are blue-light activated photoreceptors that control various functions in plants and algae. They contain a non-covalently bound flavin mononucleotide (FMN) in their protein core. Upon blue-light illu- mination, the LOV domains undergo a reversible photocycle. This photocycle is spectroscopically well understood, however the structural aspects of it are still un- der debate. Currently available data for several LOV domains show that the light- triggered activation induces a covalent bond formation between the C4a atom of FMN and the sulphur atom of a conserved cysteine. There is no large body of work, currently available, that shows the signal propagation beyond the immediate surrounding of FMN, as this is not easily achievable with the currently available techniques. X-ray crystallography can not completely describe the signal transduc- tion pathway, probably due to the restraint imposed by the crystal lattice. NMR and CD techniques, on the other hand, did reveal the global changes induced with the LOV domain activation, such as dissociation and loss of helical structure of the Jα helix. This ultimately leads to the activation of the linked effector domain or of the binding to the protein partner. However, the complete pathway within the LOV domain still remains to be fully described.
A number of photoswitches have been developed that extend the currently available optogenetic tools. The LOV2 domain of A. sativa (AsLOV2) is often used as the photosensitive part of these constructs. One of the recent photoswitches that was shown to control the motility and growth of living cells, was the LOV2-Rac1 fusion protein. This photoactivatable Rac1 (PA-Rac1) was shown to be reversibly activated with localized blue light illuminations. The LOV domain in this construct serves as a photo-sensor, while the Rac1 domain controls downstream effectors.
Here we show the molecular mechanism of LOV domains from R. sphaeroides and C. reinhardtii as model-systems for the mechanism guiding the LOV-part of the PA-Rac1. In RsLOV we propose a fast mechanism, propagating from the FMN- pocket, through the anti-parallel β-sheets, to the A’α helix, and with it, the Jα helix. The Jα helix forms a helix-turn-helix (HTH) motif, together with the Kα helix, so the signal is propagated from the FMN-binding pocket to the HTH-motif.
As the HTH-motif forms a dimerization surface, in RsLOV homodimers, blue-light activation also affects the association properties of RsLOV. In CrLOV we were able to show the mechanism and structural aspects guiding this LOV domain. Upon introducing a single point mutation, F41Y, the mechanism changes to an electron transfer completely abolishing adduct formation. Furthermore, with additional mu-
V
Moreover, the 19-amino acid insertion in Rac1b is a key structural region that controls the signal propagation and opening of the binding site. We also show the mechanisms behind the protein complexes of Rac1 and Rac1b with p67phox and RhoGDI, and the induced changes in the interaction surfaces formed between these domains.
Finally, using the knowledge of the model-systems, we bring the mechanisms to- gether and show the signal transduction dynamics of the LOV2-Rac1b fusion con- struct. We identify the important aspects of the LOV2-Rac1b structure and the structural effects that the 19-amino acid insertion cause. LOV2 domain sits on top of the 19-amino acid insertion which acts as a loading arm. This region extends and contracts thus releasing or binding the LOV2 and Rac1b units more tightly. The dynamical changes induced in the structure upon the activation of either of the two subunits that form this photoactivatable construct are also described. This includes changes in the binding regions, interaction surface as well as the magnesium and calcium ions. While magnesium is important in nucleotide binding and recognition, our results suggest that the calcium ion plays no role in a calcium-deficient envi- ronment. The LOV2 domain of the fusion construct shows a mechanism similar to the ones seen in our model systems. The Jα helix partially looses its helical struc- ture, showing breakage and unwinding of the geometry. We also show the complete unfolding of the small A’α helix. Furthermore, our results suggest coupling of the Gβ and Hβ sheets which corresponds to the early stages of the β-sheet tightening process, seen in FTIR experiments for isolated LOV domains. Finally, we propose that Rac1b is controlling several structural aspects, from unit binding to nucleotide hydrolysis, while LOV2 has control over the partner binding as well as the release of the binding regions of Rac1b, responsible for the downstream effector binding.
List of abreviations
AA amino acid
ADP adenosine diphosphate
APBS adaptive Poisson-Boltzmann solver AsLOV Avena sativa LOV domain
ATP adenosine triphosphate BLUF blue light using FAD COX cyclooxygenase
CrLOV Clamidomonas reinhardtii LOV domain CRY cryptochrome
DADS decay associated difference spectra DNA deoxyribonucleic acid
DSSP define secondary structure of proteins ET electron transfer
FAD flavin adenine dinucleotide
FDPB finite difference Poisson-Boltzmann FMN flavin mononucleotide
FTIR fourier transform infrared spectroscopy GAP GTPase activating protein
GDP guanosine diphosphate GDS GDP dissociation stimulator GEF guanine nucleotide exchange factor GLUT1 glucose transporter 1
GTP guanosine triphosphate HTH helix-turn-helix
IDO indoleamine-2,3-dioxygenase
IR infrared
LOV light-oxygen-voltage
LPBE linearized Poisson-Boltzmann equation MD molecular dynamics
NADPH nicotinamide adenine dinucleotide phosphate NO nitric oxide
NOS nitric oxide synthase
NOX nicotinamide adenine dinucleotide phosphate oxydase PA-Rac1 photoactivatable Rac1
PAS Per-ARNT-Sim
PCET proton coupled electron transfer
VII
TA transient absorption
TCSPC time correlated single photon counting TPR tetratrico-peptide repeat
UV ultraviolet Vis visible
WT wild type
Acronyms for Amino Acid Types
Ala A alanine
Arg R arginine
Asn N asparagine
Asp D aspartic acid
Cys C cysteine
Gln Q glutamine
Glu E glutamic acid
Gly G glycine
His H histidine
Ile I isoleucine
Leu L leucine
Lys K lysine
Met M methionine
Phe F phenylalanine
Pro P proline
Ser S serine
Thr T threonine
Trp W tryptophan
Tyr Y tyrosine
Val V valine
Contents
Abstract V
List of abreviations VII
Contents IX
1 General introduction 1
1.1 Aim of this work . . . . 1
1.2 Outline . . . . 2
1.3 Publications and presentations . . . . 3
2 Background 5 2.1 Blue light sensing . . . . 5
2.1.1 Diversity of LOV domains . . . . 6
2.1.2 LOV domain photocycle . . . . 6
2.1.3 The structure and signaling mechanism of LOV domains . . . 7
2.2 Electron transfer . . . . 8
2.2.1 Models of electron transfer . . . . 8
2.2.1.1 Packing density model . . . . 8
2.2.1.2 Pathway tunneling model . . . . 9
2.2.1.3 Comparison of the two models . . . 10
2.3 Cancer . . . 10
2.3.1 Classification of cancer . . . 10
2.3.2 Development of cancer . . . 11
3 Mechanism of early signal transduction of the short LOV photosensor from Rhodobacter sphaeroides 13 3.1 Introduction . . . 13
IX
4.1 Introduction . . . 33
4.2 Methods . . . 35
4.2.1 Sample preparation . . . 35
4.2.2 Protein expression and purification . . . 35
4.2.3 UV/Vis Spectroscopy . . . 35
4.2.4 Determination of S1 lifetimes . . . 36
4.2.5 Determination of fluorescence quantum yields, ΦF . . . 36
4.2.6 Transient Absorption Spectroscopy and data analysis . . . 36
4.2.7 Spectral fitting of DADS . . . 37
4.2.8 Modelling . . . 37
4.2.9 MD Simulations . . . 38
4.3 Results . . . 38
4.3.1 Photoreaction of CrLOV1-F41Y . . . 38
4.3.2 Additional mutation of the reactive Cys57 . . . 41
4.3.3 pH influence . . . 43
4.3.4 Decay of the S1state suggests electron transfer via the excited singlet state . . . 44
4.3.5 Molecular Dynamics Simulations . . . 45
4.4 Discussion . . . 51
4.5 Conclusions . . . 54
5 Predicting the complete electron transfer pathways in proteins 55 5.1 Introduction . . . 55
5.2 Algorithms . . . 56
5.2.1 Finding the optimal pathway . . . 56
CONTENTS XI
5.2.2 Predicting the start and terminal residue . . . 58
5.2.3 Implementation of the algorithms . . . 59
5.3 Validation of algorithms . . . 59
5.4 Design of alternative pathways . . . 62
5.4.1 Predicting electron transfer pathway and donor and acceptor residues in CrLOV . . . 64
5.5 Conclusions . . . 64
6 Signaling mechanism of Rac1 and Rac1b and their protein constructs with p67phox, RhoGDI and LOV2 67 6.1 Introduction . . . 67
6.2 Results . . . 71
6.2.1 Rac1 and Rac1b simulations . . . 72
6.2.2 RhoGDI-Rac1 simulations . . . 76
6.2.3 p67phox-Rac1 and p67phox-Rac1b simulations . . . 76
6.2.4 LOV2-Rac1b simulations . . . 79
6.3 Discussion . . . 85
6.3.1 Rac1 and Rac1b signaling mechanism . . . 85
6.3.2 RhoGDI-Rac1 signaling mechanism . . . 88
6.3.3 p67phox-Rac1 and p67phox-Rac1b signaling mechanism . . . 89
6.3.4 LOV2-Rac1b signaling mechanism . . . 90
6.4 Conclusions . . . 93
7 Material and Methods 95 7.1 Generation of RsLOV initial structures . . . 95
7.2 Generation of CrLOV initial structures . . . 95
7.3 Generation of Rac1 and Rac1b initial structures . . . 95
7.4 Simulation details . . . 96
7.5 Electrostatics calculations . . . 97
7.6 Calculation of pKa values of titratable amino acids . . . 97
7.7 Secondary structure assignment . . . 97
8 Summary 99
Appendix 103
1 General introduction
1.1 Aim of this work
There is no large body of work, currently available, that describes the signaling dynamics past the immediate surrounding of the activation trigger point within a signaling protein domain. The description of the signaling pathways within a protein domain is very hard to do, using the currently available experimental techniques.
X-ray crystallography has restraints imposed by the present crystal lattice. NMR and CD techniques have an issue that they are extremely hard to solve for protein environments and are, so far, only able to describe mostly global structural changes.
The scope of this thesis is the investigation of the signal transduction dynamics of protein-based photoreceptors, photoswitches and optogenetic tools. Using molec- ular dynamics simulations we describe the signaling transduction within a protein domain, on a molecular level. We first show the early mechanisms of the RsLOV and CrLOV domains. In order to ascertain the electron transfer pathway as well as the initial donor and the terminal acceptor residues of the electron transfer process within LOV domains, we have developed a novel method that is able to answer these question. We have also simulated Rac1 and Rac1b proteins, together with their complexes with p67phox and RhoGDI, in an effort to understand the mecha- nisms guiding these two spliced variants. Studying these model-systems, RsLOV and CrLOV on one hand, and the Rac1 and Rac1b on the other hand, allowed us to apply the knowledge gained of their mechanisms onto the mechanism of the LOV2-Rac1b photoswitch. As a result of these simulations, we observed the early signal transduction dynamics within the studied photoswitches and photoreceptor constructs.
1
Chapter 1 includes this outline together with the description of the aim of the work described in this thesis as well as the list of publications published as part of this thesis.
Chapter 2 contains background information, including the general theories and explanations, required for easier understanding of the topics and results discussed later on in the thesis.
Chapter 3describes the molecular mechanism that drives the signaling of LOV do- main inR. sphaeroidesupon activation as well as the information exchange between the two subunits forming the RsLOV dimer.
Chapter 4shows the effects of single-point mutation on the reaction type in LOV domain from C. reinhardtii. This chapter, in part, describes the results obtained employing experimental techniques performed by Kathrin Magerl.
Chapter 5 includes the description of the novel method for predicting electron transfer pathways in proteins. Additionally, the chapter describes the algorithms for predicting the initial donor and the terminal acceptor residues of an electron transfer process.
Chapter 6contains the molecular mechanism and behavior of Rac1 and its spliced variant, Rac1b. In this chapter, the mechanisms of their p67phox, RhoGDI and LOV2 constructs are also described.
Chapter 7gives information on the methods used to generate the results presented in the main body of this thesis.
Chapter 8includes the summary of the presented results and conclusions.
1.3 Publications and presentations 3
1.3 Publications and presentations
Parts of this thesis have been submitted for publication:
• K. Magerl, I. Stambolic and B. Dick,Switching from adduct formation to elec- tron transfer in a light-oxygen-voltage domain containing the reactive cysteine, Phys. Chem. Chem. Phys, (2017)
Parts of this thesis constitute manuscripts in preparation:
• I. Stambolic, D. Horinek and B. Dick,Mechanism of early signal transduction of the short LOV photosensor from Rhodobacter Sphaeroides, (2017)
• I. Stambolic, D. Horinek and B. Dick, Early signaling mechanisms of Rac1, Rac1b and their constructs with RhoGDI, p67phox and LOV2 domain, (2017)
• I. Stambolic, D. Horinek and B. Dick, Predicting complete electron transfer pathways in proteins, (2017)
Additionally, I have contributed to the following report:
• E. Peter, B. Dick, I. Stambolic and S. A. Baeurle, Exploring the multiscale signaling behavior of phototropin1 from Chlamydomonas reinhardtii using a full-residue space kinetic Monte Carlo molecular dynamics technique, Proteins:
Structure, Function and Bioinformatics, 82, 2018 (2014)
Parts of this thesis have been presented both orally and in a poster form at over 15 international conferences.
2 Background
2.1 Blue light sensing
Living organisms rely on the ability of their cells to sense and respond to extracellular stimuli in order to grow and survive. Single-cell organisms need to sense the nutrients present in the extracellular environment. Cells of multicellular organisms need to sense their neighbors in the surrounding tissues. In both cases, the cells need to adjust their metabolism as a response to this external stimuli. This adjustment is done through a series of signal transduction pathways. Each pathway is formed by a series of proteins that interact with each other in order to pass the information downstream. [1] Signal transduction also includes the stress propagation within each of the protein forming the pathway. This process of signal transduction within a protein is called the early signaling. Deregulation, disruption or alteration of any part of a signaling pathway can lead to cell death or disease. Signaling cascades start with the protein that is directly responding to the external stimuli. Activation of this receptor protein induces a series of structural changes that ultimately lead to its modified reactivity and interactions with downstream protein partners. [2] The basic mechanism of a signaling pathway and the corresponding stimuli response is shown in figure 2.1.1.
Light is one of the essential external stimuli that cells have evolved to sense and respond to. Photodynamic action regulates a vast number of cellular processes, such as cell adhesion, phototropism and circadian rhythm [3–5] in many organisms, from bacteria to plants. There are two ways a receptor senses the external stimuli.
One is through small molecules ligand binding while the second way is with post- translational modifications. Here, we will discuss sensing through ligand binding, mostly by describing the light-oxygen-voltage sensing proteins. Specific responses listed above, cell adhesion, phototropism and circadian rhythm, are controlled by a common receptor family sensitive to light stimuli. These are the Light-Oxygen- Voltage- (LOV) sensitive domains. [6] LOV domains harbor a non-covalently bound flavin chromophore that senses the blue light (400-470 nm range). Upon light acti- vation, it undergoes a reversible photocycle. [7] The first step in the light response of LOV domains is adduct formation, between the C4a atom of the flavin cofactor and the sulphur atom of the strictly conserved cysteine.
5
Figure 2.1.1Basic mechanism of the initiation of the cell signaling cascade. Upon activation by the external stimulus, receptor proteins undergo a conformational change that modifies its reactivity or partner binding properties.
2.1.1 Diversity of LOV domains
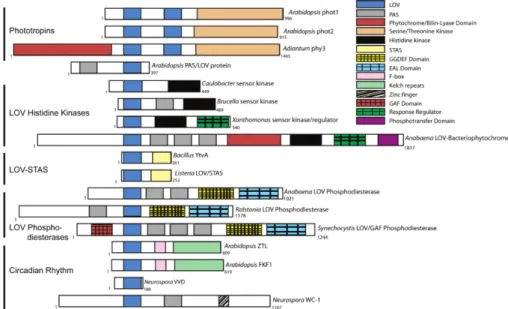
LOV domains are usually coupled to other domains, called effector domains. LOV domains sense the blue light and pass the information to the effector domain they are linked to. Subsequently, the effector domain then controls certain reactions in biological systems as a response to light, even though the effector domains can not sense the light themselves. LOV domains are coupled to other sensory domains, such as STAS domains, Ser/Thr kinase domains, F-box proteins and many others, depending on the organism and the particular construct in question. [8] Effector domains govern the function of these photoreceptors. Additionally, there are LOV domains that are not coupled to any effector domain, but instead they bind to protein partners in response to light. They are called short LOV domains, [9] because of their short primary sequence when compared to the sequence of the complete photoreceptor-effector construct.
2.1.2 LOV domain photocycle
The photocycle of a LOV domain starts from the dark-adapted state. Upon blue- light irradiation, the flavin is excited to the excited singlet state, which undergoes intersystem crossing to the excited triplet state. This reacts with a nearby cysteine residue resulting in a covalent bond between flavin C4a and cysteine sulfur atom.
This photoadduct is most likely formed between a FMNH• and •SCys radical pair.
It is the signaling state of a LOV domain. The radical mechanism is not the only mechanism proposed, [4, 7, 10] it is however, the most likely one. [11–13] In addition to this radical combination, FMN-N5 is protonated.
2.1 Blue light sensing 7
Figure 2.1.2Alignment of cartoon representations of a few LOV domain-containing proteins, showing a great diversity of LOV domains. Reprinted with permission from [8]. Copyright 2013 American Chemical Society.
2.1.3 The structure and signaling mechanism of LOV domains
There are numerous crystal structures determined for LOV domains. They show a high degree of similarity of the LOV core, because they share the same PAS (Per- ARNT-Sim) domain. Cartoon alignments of different LOV domain sequences are shown in figure 2.1.2, revealing a great diversity of LOV domains. The shared PAS core is made of antiparallel β-sheets with several α-helices flanking the core. [14]
The solvent-exposed surface, formed by the β-sheet, is identified as an interaction surface for protein-protein binding. [15]
The flanking helices vary greatly depending on the particular LOV domain. They have been shown to play a crucial role in the control of the early signaling. The C-terminal helix, named Jα helix, associates with the β-sheet surface in the dark, while it partially looses its helical structure in the light state and detaches from the protein core. [16] This conformational change influences the linked effector domain or the protein binding surface. At the N-terminal end of the protein, there is an A’α helix. This helix has been shown to fully unfold upon activation and to be a key region in transducing the signal from the flavin cofactor in the protein core to the flanking helices, which ultimately pass the signal to the effector domain or the effector region. [17]
the electron transfer process are the distances between each individual donor and acceptor as well as the local charge distribution. [19]
2.2.1 Models of electron transfer
Since the pioneering work by Marcus, [20, 21] several methods have been developed to treat the ET process in proteins. Two methods in particular will be described here, the Packing density model and the Pathway tunneling model. These two models are presented here as the etFIND software described later in the thesis uses these two models to determine the pathway and the two points of ET.
2.2.1.1 Packing density model
The packing density or the square barrier model was developed by Hopfield in 1974.
[22] This simple model approximates the tunneling medium with a square barrier.
The barrier has an effective height, as shown in figure 2.2.1a. In this model, the coupling matrix element between the initial and final wave functions decays expo- nentially with the distance. This model is able to provide a good description of the ET in proteins. The model has been expanded for protein environments by Moser and Dutton [19, 23], where in the expanded model the rate of ET is given as equation 2.1.
logkET = 13− β
2.303(R−R0)−γ(∆G0+λ)2
λ (2.1)
wherekET is the electron transfer rate in units of s−1,R (in Å) is the edge-to-edge electron transfer distance, R0 is the van der Waals contact distance and is set to 3.6 Å, ∆G0 (in eV) is the Gibbs free energy change and λ(in eV) is the reorganizational energy. The parameter γ includes room temperature constants and the coefficient β is given as a dependency of ρ, the packing density of the medium, which further depends on the barrier height.
β =ln10(1.2−0.8ρ) (2.2)
2.2 Electron transfer 9
Figure 2.2.1Electronic coupling matrix element for ET in biological systems. Schematic representation of a) the packing density model and b) the pathway tunneling model. Adapted with permission from [18]. Copyright 2015 American Chemical Society.
2.2.1.2 Pathway tunneling model
The pathway model [24, 25] describes the structure of the tunneling medium on an atomistic level. Tunneling in this model takes into account the intermediate charge carriers, connecting the donor with the acceptor. This is shown in figure 2.2.1b.
Electronic coupling of a given path, connecting the donor with the acceptor, is given as a product of the closest contact term, Hab, and the attenuation factor. This attenuation factor is a product of three factors that describe the decay of consecutive tunneling through covalent bonds (ci), hydrogen bonds (hbj ) and space (tsk). The distancer is defined as a distance between heavy atoms. This is shown in equations 2.3 to 2.6.
= Π
i ciΠ
j hbj Π
k tsk (2.3)
ci = 0.6 (2.4)
hbj = 0.36exp[−1.7(r/Å−2.8)] (2.5) tsk = 0.6exp[−1.7(r/Å−1.4)] (2.6) The pathway model is an empirical method approximating the superexchange model, which assumes that the electron tunneling between the two ET points is controlled by the unoccupied orbitals of the atoms in-between the donor and acceptor pair.
As there is a vast number of pathways connecting donor and acceptor, this number has to be trimmed down. Usually, this is accomplished by excluding certain paths, based on geometrical parameters, such as the distance from the two points. Another
donor-acceptor distance has been widely debated in the literature. [26–28] However, next to this coarse graining of the protein environment, the issue with this model is that it can only describe the tunneling between the initial and final points of ET and it can not describe the individual steps, in-between these two ET points. The pathway model, on the other hand, successfully captures the atomistic structure of the protein, unlike the density packing model, but it is fully empirical.
Moreover, the two models use a different definition of the distance. In the density packing model, the distance is defined as edge-to-edge, meaning two closest atoms of the donor-acceptor residue pair. In contrast, the pathway model uses center-to- center or metal-to-metal distance of the donor-acceptor pair in its equations. The density packing model is strongly supported by the fact that when using edge-to- edge distances, ET reactions in biological systems fall within an exponential decay line. [29] However, when metal-to-metal distances are used the pathways model gives a good explanation of the resulting ET rates. [26] Long-range ET processes in biological systems are almost solely governed by the distance, but for more quanti- tative understanding of these reactions the structure of the protein on an atomistic scale needs to be taken into account.
2.3 Cancer
According to the World Health Organization [30] cancer is a collective term describ- ing a large group of diseases that can affect any part of the body. Malignant tumors or cancers, compared to benign tumors, have the ability to infiltrate surrounding tissue which ultimately leads to the destruction of the perforated tissue. Malignant tumors also have the ability to spread to lymph nodes and distant organs via blood vessels and lymphatic pathways. This is known as metastasis.
2.3.1 Classification of cancer
There are over a hundred types of cancer. The classification of cancer depends on the criteria selected for classification. Classically it is based on morphological
2.3 Cancer 11
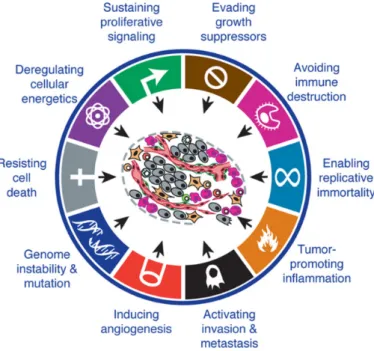
Figure 2.3.1 Schematic representation of the hallmarks of cancer acquired during development of tumors, together with emerging hallmarks and enabling characteristics. Reprinted from [35], with permission from Elsevier.
appearance [31] or based on the cells of origin. [32] There have been other approaches [33, 34] that classify tumors based on different molecular markers. Additionally, tumors with the same histopathological appearance can have very different clinical progressions. [31] Each class of tumors have subclasses and in most cases these subclasses are distinct enough to lead to different clinical outcomes.
2.3.2 Development of cancer
Cancer development is a multistep process during which cancer develops several functional properties. They ensure survival, growth and dissemination of the tumor.
These features are known as hallmarks of cancer [35]. Amongst others, they include sustaining proliferative signaling, evading growth suppressors, resisting cell death, enabling replicative immortality, inducing angiogenesis and activating invasion and metastasis as shown in figure 2.3.1.
Tumorigenesis is caused by genome instability and accumulation of mutations. The accumulation of spontaneous mutations is very slow due to efficient DNA-repair mechanisms. Tumor cells develop numerous mutations, which results in deactivation of these DNA repair mechanisms. [36] The alteration of a single gene is not enough to form cancer. Instead, subsequent mutations, enabling malignancy and invasion, are necessary for tumor progression. [37]
The most important feature of tumor cells is the sustained proliferation signaling.
In cells, growth and division are normally tightly regulated by the release of growth
tosis is regulated through apoptotic triggering proteins BAX and BAK, BCL2- accociated X protein and BCL2 antagonist/killer, respectively. Additionally, these proteins are inhibited by BCL2 anti-apoptotic protein. Cancer cells have developed mechanism to alter the apoptosis or to completely evade it. [43] Additionally, cancer cells have developed the replicative immortality trait. It enables unlimited prolifer- ation. [44] Activating invasion and metastasis is the final step in cancer progression.
It includes dissemination of tumor cells to distant sites, through lymph channels and blood vessels. [45] A key protein involved in cell-to-cell adhesion is E-cadherin.
This protein is regulated on many levels, including the tight regulation by Rac1.
The downregulation and inactivation of E-cadherin is usually observed in cancer cells, [46] and can be linked with the deregulation of Rac1.
3 Mechanism of early signal
transduction of the short LOV photosensor from Rhodobacter sphaeroides
3.1 Introduction
Flavin-binding photoreceptors are found in a variety of organisms where they con- trol numerous functions, [47] depending on the photoreceptor family. They can be categorized [48] into three distinct groups: a) Light-, Oxygen- and Voltage- (LOV) sensing domains; b) Blue-Light Using FAD (BLUF) domains and c) Cryptochromes (CRY).
LOV domains are blue-light photoreceptors that harbor a non-covalently bound flavin mononucleotide (FMN) or in some cases flavin adenine dinucleotide (FAD) chromophore. [49] The signaling state in LOV domains is generated via blue-light induced formation of a covalent bond between the C4a atom of FMN and the sulfur atom of an adjacent cystein. [50]. In the dark, the FMN-cysteinyl adduct breaks slowly, on a time-scale from minutes to hours, reverting the LOV domain to the ground state, and concluding the photocycle. [49] This photocycle of LOV domains is shown in figure 3.1.1 panel a).
The majority of LOV domains are apart of larger multi-domain constructs, where the light-sensing of LOV domains acts as triggers or activators of linked effector domains. The LOV domain biological function in plants has been well established, however their regulatory function in bacteria is still poorly understood. [51]
In addition to multi-domain constructs, many LOV domains exist in fungi and bac- teria that do not contain a coupled effector domain. They are called short LOV domains, [52] due to their short sequences when compared to the sequences of multi-domain LOV constructs. Several short LOV domains have been function- ally characterized. Interestingly, short LOV domains exhibit the complete function of LOV domains, most likely through binding to other protein partners. [49] Short LOV domains contain C- and N-terminal helical extensions that are involved in sig- naling. [52, 53] In multi-domain LOV constructs these helical extensions link the effector domains to the LOV domain and often act as triggers or spacer providing
13
Figure 3.1.1(A) Simplified photocycle of a LOV domain. (B) Structure ofR. sphaeroidesLOV domain in the dark state, with all of the RsLOV structural elements labeled.
conformational flexibility. [54] A light-triggered monomer-dimer equilibrium can be a mode of action of short LOV domains where either the monomer or the dimer selectively interacts with downstream signaling partners. [17, 52, 55] This signaling control through partner binding can be mediated through the A’α- and Jα-helices.
[17]
The LOV domain photocycle starts from the dark-adapted state, LOV450, with the non-covalently bound FMN. Upon irradiation FMN gets excited to a singlet state which then undergoes intersystem crossing to the lowest excited triplet state.
From the triplet state, FMN decays into the photo-adduct, LOV390. This photo- adduct state is most likely preceded by a transient FMNH• -•SCys radical pair, and represents the signaling state of the LOV domain. While the radical mechanism is not the only mechanism proposed in the literature, [4, 7, 10] it is, however, the most likely [11–13] mechanism for adduct formation in LOV domains. Following this biradical combination, which is coupled with the protonation of FMN-N5 atom, is the formation of the covalent bond between C4a atom of FMN and the sulfur atom of the cysteine residue in LOV390 state. In most LOV domains the LOV390, which is the signaling state in vivo, thermally recovers to the dark-adapted state, the LOV450 state. [56]
One of the first and crucial steps in signal propagation to the LOV domain surface is the sidechain flip of the conserved glutamine residue that lies on the Iβ strand. It has been shown multiple times [16, 57–62] that this is a critical step in the mechanism propagation. In order to maintain a hydrogen bond with the protonated N5 atom of FMN, the amide of the conserved glutamine residue must flip.
Rhodobacter sphaeroides is a photosynthetic purple bacteria that contains several light-sensing proteins, a short LOV domain (RsLOV), the FAD photoreceptor AppA
3.2 Results 15 and three CRY-like domains. [52] RsLOV binds FMN as a chromophore. While having distinct structural characteristics, it carries some similarities to Vivid (N.
crassa) and YtvA (B. subtilis). The RsLOV core is mostly conserved with respect to Vivid and YtvA LOV domains, and the highest degree of differences lie on the flanking helices. Most notably, the domain swapping N-terminal region of Vivid is lacking in RsLOV, but the receptor pocket for it is conserved. [52] Additionally, the C-terminal extension is present in RsLOV and YtvA but is lacking in Vivid.
While RsLOV lacks an effector domain, the two C-terminal helices linked through a salt bridge, the Jα and Kα helices form a helix-turn-helix (HTH) motif, which has been shown previously to be involved in DNA and protein binding. [63, 64]
The structure of the RsLOV dark state domain is shown in figure 3.1.1 panel b), with all of the structural elements labeled. In RsLOV the HTH motif is used as an unusual dimerization region, forming a tight four-helical bundle, flanked by the A’α helices. RsLOV is a homodimer in the dark, which dissociates upon light irradiation.
[52] However, the crystal structure reveals that the dimers are made of two distinct subunits.
Interaction partners and targets of RsLOV are still unknown, but RsLOV has been linked with photosynthetic gene expression, carbohydrate metabolism, chemotaxis, response to photooxidative stress and light-controlled gene expression. [52, 53] How- ever, the mechanism behind the RsLOV control of these processes and the light- driven signal propagation is still poorly understood.
Here, we address the issue of the short LOV photoreceptor early signaling mechanism triggered by the blue-light irradiation, in R. sphaeroides. We present the results of molecular dynamics simulations of both dimers and monomers of RsLOV wild type in the dark and light states. We further show the results from the simulations of different RsLOV constructs in an effort to elucidate the early signal propagation pathway in this short LOV domain. These results lead us to a proposal for the early signaling mechanism of RsLOV as well as the mechanism of unit dissociation upon blue-light activation.
3.2 Results
We performed non-invasive MD simulations of dark- and light-state monomers as well as the second dark domain after light-dark simulation has completed. Further- more, we performed simulations of dark-dark, light-dark, light-light and symmetrical dark-dark dimers.
3.2.1 Simulations of dark-dark and light-dark dimers
Formation of the FMN-Cys covalent bond causes a perturbation in the FMN-binding pocket. The residues surrounding the FMN show significant changes in the light
Figure 3.2.1 Distortion of the FMN-binding pocket. Characteristic distances between (A) Arg56 and FMN, (B) Gln59 and FMN, (C) Asn54 and FMN and (D) Arg56 and Gly48 residues. The distances of the dark-dark simulation are shown in black in all graphs, while the light-dark distances are represented with red color.
state. Figure 3.2.1 shows a comparison of the behaviors of certain residues in unit A in the dark-dark and light-dark simulations. Figure 3.2.1 panels a) and b) show the separation of the Eα helix and the FMN cofactor in the light state. In panel c) of figure 3.2.1 the closing of the Dα-Eαloop with the FMN residue in the light state can be seen, as well as the formation of a hydrogen bond between the two regions.
Figure 3.2.1 panel d) shows a hydrogen bond formation between Arg56 and Gly48, which lie on the Eα and Dα helices, respectively.
Upon blue-light activation, the signal is transduced over the A’α helix to the helix- turn-helix motif. Signal transduction is direct and can be split into 5 distinct steps.
The first step is the disturbance of the FMN-binding pocket described above. These changes, specifically the opening of the α-helices around the FMN-phospho tail, induce a movement of the Bβ sheet. This can be seen in the figure 3.2.3 panel a).
3.2 Results 17
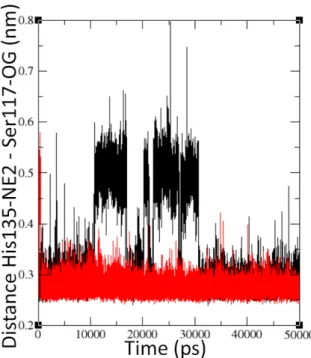
Figure 3.2.2 The Jα-Iβ anchor through the His135 and Ser117 link. Distances of the dark-dark simulation are shown in black, while the light-dark distances are represented with red color.
Panel b) of figure 3.2.3 shows the release of the A’α helix through the breakage of the hydrogen bond between the Bβ and A’α regions in the light state. Figure 3.2.3 panel c) shows the signal propagation from the A’α helix to the HTH-motif, specifically to the Jα-helix. Finally, in figure 3.2.3 panel d) the subsequent step of the signal propagation within the HTH-region is shown. This final step is the closing of the Jα and Kα helices and the change in the HTH-motif geometry.
Changes in the geometry of the HTH-motif are shown in figure 3.2.4. Panel a) shows the changes in the angles between the axes of the two helices. Axis of a helix was determined by averaging the direction of backbone atoms Ci → Oi → Ni+4. Meanwhile, panel b) shows a simplified representation of the induced changes and the closing of the two helices, Jαand Kα, that form the HTH-motif, upon blue light activation.
Figure 3.2.2 shows the binding of the Jα helix to the Iβ sheet through the link between the His135 and Ser117 residues. The Jα-Iβ anchor persists in both the dark and light states, leaving the Jα helix bound to the core even after the activation of the LOV domain.
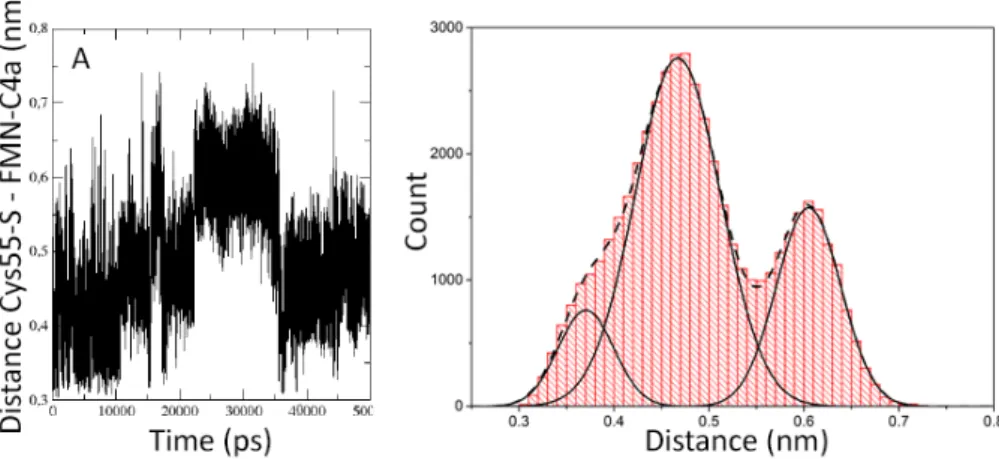
The analysis of the distance between FMN-C4a and Cys55-S is shown in figure 3.2.5.
Distances for each of the time points were extracted from the dark-dark simulation and grouped into distance bins. Resulting histogram shows a bimodal distribution.
Integrating the surface bellow each peak of the histogram results in the ratio of the surfaces of 63% to 37%. Panel a) shows the trajectory of the inter-atomic distances between the Cys55-S and FMN-C4a atoms, while panel b) shows the histogram analysis of the trajectory.
Figure 3.2.3 Distinct signal transduction and light-activation steps. Characteristic inter-atomic dis- tances between (A) Arg56 and Ala35, (B) Asn36 and Gly17, (C) Val18 and Glu142 and (D) Arg145 and Glu154 residues. Distances of the dark-dark simulation are shown in black in all graphs, while the light-dark distances are represented with red color.
Figure 3.2.4Geometry changes of the HTH-motif. (A) Changes in the angles between the Jαand Kα axes. (B) Simplified representation of the HTH-motif changes upon activation.
3.2 Results 19
Figure 3.2.5 Distribution of the Cys55 and FMN distances (A) Inter-atomic distances between the Cys55-S and FMN-C4a atoms of unit A in the dark-dark dimer over the simulation time. (B) Comparison of distribution functions of the distances between Cys55-S and FMN-C4a extracted from each time-point of the dark-dark trajectory.
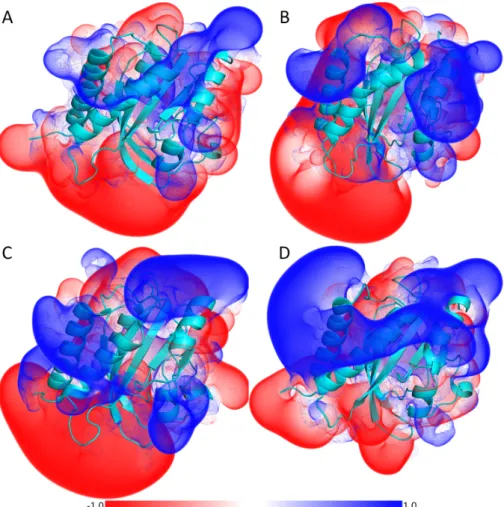
Changes in electrostatics, upon RsLOV activation, of units A and B are shown in figure 3.2.6, where the dark state units A and B are shown in panels a) and b) and light state units A and B are shown in panels c) and d), respectively. Most noticeable is the region of the Jα and Kα helices, which is positively charged in unit A. The change upon blue-light activation is the increase of the positively charged region of the HTH-motif in the light state, when compared to the dark state. The Jα and Kα helices of the unit B are oppositely charged to the HTH-motif surface of unit A.
These oppositely charged regions further strengthen the interaction between the two subunits, through electrostatic contacts. Furthermore, these electrostatic contacts allow for signal propagation beyond the single domain of RsLOV upon activation.
3.2.2 Dimer constructs: light-light and symmetrical dark-dark dimers
Structure of the symmetrical dark-dark construct has been generated by an in-place replacement of the unit B with a copy of the unit A. The initial structures for light- light simulation were generated by inducing the adduct state in both subunits, by forming the covalent bond between FMN-C4a and Cys55-S atoms in both units.
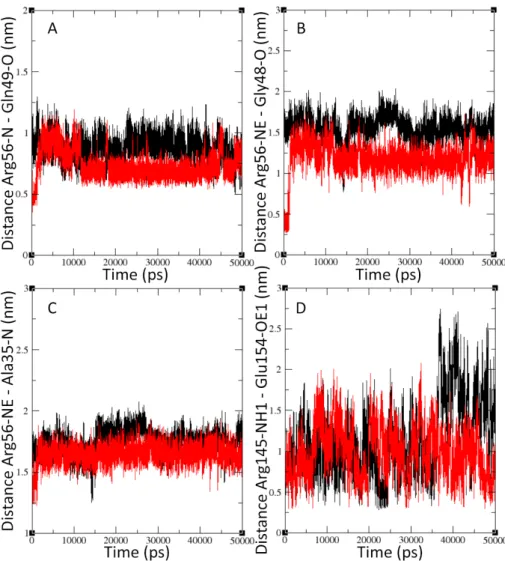
Figure 3.2.7 compares the differences in behavior between the light-light and sym- metrical dark-dark dimers. Specifically we compare the signal propagation and mechanism steps differences. In panel a) the difference between dark and light be- havior of the Arg56 and Gln49 residues is shown. Panel b) shows the distances between Arg56 and Gly48, while panel c) shows the characteristic Arg56 and Ala35 inter-atomic distances. The distances between Jα and Kα are shown in panel d).
In figure 3.2.8 we compare the center of mass distances between the two units forming the dark-dark, light-dark and light-light dimers over the simulation time. These
Figure 3.2.6APBS surfaces of RsLOV 50 ns structures of (A) dark unit A, (B) dark unit B, (C) light unit A and (D) light unit B.
3.2 Results 21
Figure 3.2.7 Signal propagation in unit A of light-light and symmetrical dark-dark dimer simulations.
Characteristic inter-atomic distances between (A) Arg56 and Gln49, (B) Arg56 and Gly48, (C) Arg56 and Ala35 and (D) Arg145 and Glu154 residues. Distances of the symmetrical dark-dark dimer simu- lation are shown in black in all graphs, while the light-light dimer distances are represented with red color.
distances show the differences in signal propagation past the initially-activated unit between the dimers. They also show the differences in unit-separation behavior upon blue-light activation.
To further analyze the states of different constructs we generated a density plot of radius of gyration of the HTH-motif (Jα-Kα region) versus the Arg145 and Glu154 distance and binned the values with a 0.05 Å increment. The color scales are pro- portional to the density of the points for a particular bin.
Figure 3.2.8 Distances of centers of mass of dark-dark, light-dark and light-light dimers simulations.
Dark-dark dimer distances are shown in black, light-dark distance in red and light-light distances are colored green.
3.2.3 Monomers
Initial structures for monomer simulations were generated by taking only the unit A of the wild type dimer RsLOV structure. For the light monomer a covalent bond was formed between FMN and Cys.
Figure 3.2.10 shows the differences in behavior between the dark and the light monomers. Panel a) shows the changes in the FMN-binding pocket through the distance between FMN and the Gln59 residue. In panel b) the distance between Arg56 and Gln49 is shown. Panel c) shows the Val18 and Glu142 distances while panel d) shows the changes induced in the HTH-motif.
Next to the the dark and light monomer simulations, we performed a simulation of the dark monomer after the light-dark simulation has completed. The behavior of this monomer is shown in figures 3.2.11 and 3.2.12. Figure 3.2.11 shows the behavior of the FMN-binding pocket in panels a)-c) while panel d) shows the Jα-Iβ anchoring point through the interactions between the His135 and Ser117 residues.
Furthermore, the distances of the signal propagation steps are shown in figure 3.2.12.
Panel a) shows the distance between Arg56 and Ala35, panel b) the distance between Asn36 and Gly17 while panel c) shows the distances between Val18 and Glu142.
Finally, panel d) shows the changes in the Jα and Kα region.
Additionally in figure 3.2.13 we compare the different conformational states occupied by the two subunits of RsLOV taken after the simulations have completed. The anchoring point between the Jα helix and the Iβ sheet is emphasized with the representations of His135 and Ser117.
3.2 Results 23
Figure 3.2.9 Distance between the Arg145 and Glu154 residues from LOV domain as a function of the radius of gyration of Jα and Kα regions (HTH-motif) in the dark and light-states of different constructs. The color scales are proportional to the number of counts for the specific state observed during the simulation run.
Figure 3.2.10Stress propagation in dark and light monomer simulations. Characteristic inter-atomic distances between (A) FMN and Gln59, (B) Arg56 and Gln49, (C) Val18 and Glu142 and (D) Arg145 and Glu154. Distances of the dark monomer simulation are shown in black in all graphs, while the light monomer distances are represented with red color.
3.2 Results 25
Figure 3.2.11 FMN-binding pocket disturbance upon light-activation in the second, dark unit after the light-dark simulation has completed. Characteristic inter-atomic distances between (A) FMN and Arg56, (B) FMN and Gln59, (C) FMN and Asn54 and (D) His135 and Ser117.
Figure 3.2.12Stress propagation in the second, dark unit after the light-dark simulation has completed.
Characteristic inter-atomic distances between (A) Arg56 and Ala35, (B) Asn36 and Gly17, (C) Val18 and Glu142 and (D) Arg145 and Glu154.
3.3 Discussion 27
Figure 3.2.13 Comparison of distinct structural states occupied by different units of different 50 ns simulations. (A) Chain A from dark-dark simulation, (B) chain A of light-dark simulation, (C) chain A of light-light simulation, (D) Chain B from dark-dark simulation, (E) chain B of light-dark simulation and (F) chain B of light-light simulation.
3.3 Discussion
Formation of the FMN-Cysteinyl adduct is a conserved first step in the light- triggered activation of LOV domains. This response to blue-light illumination causes perturbations in the flavin-binding pocket with significant changes in the residues surrounding the FMN cofactor. This is then followed by signal propagation over the A’α helix over to the Jαhelix, and with it to the effector domain or protein partner.
In their study, Conrad and coworkers [52] observed the flavin-cysteinyl adduct in only one of the two units and even in that one unit the light-state was formed ap- proximately 60% of the time. In the other 40% of the time it occupied an alternative conformation. Considering that the adduct state is formed from the dark-state, we extracted the distances between the FMN-C4a and Cys55-S atoms, the two atoms forming the covalent bond in the adduct state, from the dark-dark simulation. We grouped them into bins of 0.01 nm width. Resulting histogram shows a bimodal distribution. The distances can then be grouped into two distinct groups. The data were fit using a Gaussian distribution function. Integrating the surface bellow each of the peaks in the histogram results in the surface ratio of 63% and 37% for the two groups. This points to the same behavior of the dark-dark dimer as shown in the experiments [52]. These results indicate that the dark-dark dimer spends 63% of the simulation time in conformations that are able to form an adduct. In the other 37%
of the time however, the dimer occupies alternate dark-state conformations that are