Uwe Neumann
Are my neighbours ageing yet? Local dimensions of demographic change in German cities
Abstract
Among the highly developed countries, demographic ageing is particularly advanced in Germany. Accentuated by migration, there is great regional variation in the progress of demographic change. Within urban areas, residential neighbourhoods differ considerably in their demographic composition and perspectives. Based on municipal data, this paper examines regional variability in the diversity and pace of neighbourhood-level ageing. Focusing on the Rhine- Ruhr conurbation in North Rhine-Westphalia, the analysis outlines at what pace ageing proceeds in a variety of neighbourhoods, which attract no constant influx of working-age migrants. After decades of suburbanisation, in the period from 1998 to 2008 regional migration concentrated on the central districts of large cities. More profoundly in the most prosperous cities growing in population than in other cities, childless working-age adults separate from other age groups and family types in selected central city quarters. The findings suggest that spatial differentials in ageing are likely to affect future location decisions and, thereby, regional and local prosperity.
Keywords: demographic change, neighbourhoods, segregation, migration _________________
Uwe Neumann
Rheinisch-Westfälisches Institut für Wirtschaftsforschung (RWI) Hohenzollernstr. 1-3
45128 Essen Germany
Tel. +49.201.8149.212 Fax +49.201.8140.200
E-Mail: uwe.neumann@rwi-essen.de
The final version of this paper has been published in Journal of Population Ageing, 6(3), September 2013, The final publication is available at www.springerlink.com, doi: 10.1007/s12062-013-9081-4
Introduction
In the discussion about the political implications of demographic change until fairly recently the regional dimension was, by and large, overlooked. In Europe, population decline and changes in the age structure have only just begun to affect societies as whole. Several regions, however, have already experienced severe losses in population, while others have continued to grow. Regional analysis therefore makes it possible to study the challenges arising from demographic change long before ageing proceeds to a similar stage at the national level.
Many of the issues implied by demographic change (e.g. concerning education, the labour market or social security) have to be addressed by national policy. Yet, given an increase in the importance of individual and interpersonal knowledge factors in constituting regional competitiveness (Camagni 2002), further policy implications emerge at the regional level.
Since neighbourhood sorting is a characteristic of urbanisation, there is great intra-urban variation in the pace of ageing. A full survey of the local economic consequences of demographic change would have to account for the way in which people, firms and communities adapt to changing conditions and in turn possibly affect the pace of local demographic ageing itself. This analysis takes a first step by outlining the local differentials of population change and the way in which they relate to regional prosperity.
Due to a fairly advanced stage in demographic ageing, in many German cities economic growth today combines with stagnation or even a decline in population.
However, the most vibrant cities still grow in population due to a net migration gain. Truly, regional labour markets in Germany have begun to compete for qualified personnel. Apart from Eastern Germany, the old-industrialised Ruhr is
one of the German regions which have already been affected by a severe loss in population and a fundamental change of the population structure due to net outward migration over the past decades. The Ruhr is part of the largest urban agglomeration in Germany, the Rhine-Ruhr conurbation, which is the study area of this analysis. This paper examines
1. how far progress in ageing varies between different kinds of neighbourhood,
2. at what pace ageing proceeded during the past decade,
3. how local demographic ageing relates to regional prosperity, and
4. what challenges arise from the regional variability of neighbourhood-level ageing.
The analysis suggests that mobility of the younger adult generation accentuates the local outcome of demographic change to a great extent. In the most prosperous cities, demographic neighbourhood sorting, which is a feature of urban regions in general, is particularly pronounced. As a whole, the local outcomes of ageing and regional migration imply considerable challenges for urban policy. The following survey starts with a brief review of the relevant literature in the next chapter, followed by a presentation of the data and methodical approach. The analysis begins with an outline of demographic ageing in the study region and then proceeds to an investigation at the neighbourhood level.
Literature review
While there is a wide literature on international migration (cf. Bauer et al. 2004, Haug 2008) and demographic change at the national level (e.g. Batini et al. 2006, Börsch-Supan 2003, European Commission 2007), regional and urban aspects so
far have played a minor role in the discussion about the dynamics and policy implications of ageing. As a step forward, regional demographic heterogeneity in labour supply, productivity, human capital and R&D has been documented for the 264 NUTS 2 regions in the EU-27 by Tivig et al. (2008).
In the strategic guidelines for EU cohesion policy in the current 2007-2013 period, demographic change was seen as an issue affecting labour market and health policy, yet it was not characterised as a fundamental challenge implying a comprehensive policy approach (European Council 2006). With the Barca (2009) report on an agenda for a reformed cohesion policy though, which suggests six priorities for future cohesion policy (innovation, climate change, migration, children, skills, and ageing), issues of demographic change were assigned a much more prominent position.
Among the highly developed countries, demographic change is more advanced in Europe than in other continents. For example, in 2010 the median age in the European Union (EU 27) was 40.9, compared to 37.2 in the U.S. (European Commission 2011, U.S. Census Bureau 2011). Across the EU 27, the progress of population ageing at the country level is most advanced in Germany. In 2010 the median age in Germany (44.2) was the highest of all EU member states (European Commission 2010: 62-63). Not surprisingly, the German government has adopted a strategic demographic policy. The main policy subjects include families, working conditions, senior citizens, the quality of life in rural areas, integration of immigrants in urban areas and national finances (BMI 2011). The strategy identifies regional aspects as a matter of concern, albeit perceiving ageing as a challenge arising predominantly for rural areas.
Since neighbourhood sorting is a characteristic of cities, ageing at the local level much likely emerges as an issue for urban policy also. In urban research, it has been documented by many studies that segregation by age and family type is typical of cities throughout the Western world (cf. Gans 1962, Coulson 1968, Heinritz and Lichtenberger 1991, Knox 1995). It was one of the consequences of suburbanisation, i.e. a shift of the (younger) population from the centres to the outer zones of urban areas during the second half of the 20th century, that in inner cities the share of old-age residents increased (Cowgill 1978). Yet, depending on intra-regional migration, ageing had also become a characteristic of some suburban areas by the 1980s (Fritzpatrick and Logan 1985).
In the more recent literature on demographic change and on urban dynamics, however, relatively little attention has been paid to demographic segregation between neighbourhoods. As mentioned before, the literature on ageing has focused more on countries than on regions. Analysis of residential segregation has typically been concerned with ethnicity (Peach et al. 1981, Friedrichs 1988, Sethi and Somanathan 2004, Johnston et al. 2007), the tenure status (Hoff and Sen 2005) and socioeconomic disparities (e.g. Harvey 1973, Hamnett 1994, Burgers and Musterd 2002).
In the analysis of structural change in the Ruhr industrial area, where as explained demographic change is far advanced even by German standards, until recently, demographic issues were also regarded as a minor aspect compared to the impact of industrial decline. An exception is the analysis of Steinberg (1978), which provides a review of development of the Ruhr population during the 19th and 20th century. It shows that the decline of the dominant coal and steel industries gave rise to a net outward migration, which resulted in fundamental changes of the composition of the residential population. More recently, a study of Klemmer
(2001) activated a widespread discussion about the regional consequences of ageing in the Ruhr (e.g. Wehling 2003, Lehner 2006, Neumann and Schmidt 2006). An outline of demographic change in North Rhine-Westphalia was provided by ILS (ed.) (2010). The survey points out, among other consequences, implications of demographic ageing for the housing industry and urban development policy, i.e. the need to adjust housing and infrastructure to the requirements of seniors.
Focusing on the demographic perspectives of different types of neighbourhood in the Ruhr, Strohmeier (2002) identifies groups of urban districts differing according to age, family type, ethnicity, mobility and income.
The following analysis adds to this literature by providing a systematic outline of the extent and pace at which demographic ageing affects different kinds of cities and neighbourhoods.
Data and methods
In Germany, a very precise analysis of demographic change can be carried out at the level of administrative territorial entities, i.e. regions, cities and municipalities.
However, there is no standard of aggregation of demographic indicators at the sub-city statistical level. This analysis draws on a set of comparable sub-city data, which has been made available due to municipal cooperation.
On a voluntary basis, over 100 cities (almost all with more than 100,000 inhabitants) have agreed to cooperate in a working group (AG KOSTAT) and to distribute a (largely restricted) set of standardised sub-city data. The data comprise information about age, sex, nationality and the household composition
of the resident population1. By and large, the territorial units in this data source represent historical “neighbourhoods“ or housing estates, which are perceived as spatial entities23. While there is no obligatory standard concerning sub-city statistics, municipalities define their own sub-city statistical districts for purposes of administration and urban development. Even though a private market for data with reference to small spatial entities has emerged, the accuracy of municipal registers makes them preferable as an empirical base of demographic analysis. On average, around 11,000 inhabitants live in the statistical districts on which the study is based4.
Data on regional migration, which is of fundamental interest to the analysis of local demographic change, so far has been made available only at the city level.
By combining information from the sub-city data with city-level data provided by the statistical office of North Rhine-Westphalia (IT.NRW), however, a unique data base comprising the whole of the inner and outer zone of the Rhine-Ruhr conurbation, which includes information about regional migration, was compiled for the purposes of this analysis.
The only indicator relating to ethnicity in the data is the number of residents with a foreign nationality (excluding those with a double, i.e. German and foreign nationality). It is well-known that the distribution of foreigners relates to other
1The KOSTAT data set currently comprises the following indicators: population at primary and secondary residence, male and female population, foreigners, age groups (under 18, 18-29, steps in tens up to 59, 60 and over), number of households.
2In the future, it will be desirable to apply data aggregated at smaller levels such as building blocks or spatial grids to sub-city analysis. For the time being, sub-city districts defined by the municipalities offer a territorial reference suitable for the analysis of intra-city differentials in Germany.
3Serious methodical challenges can arise due to the designation of district boundaries. These have been described as the modifiable areal unit problem (MAUP). First, a statistical bias may emerge if the size of the population represented by statistical districts varies to a great extent. Second, statistical results may vary even if only the shape (not the size) of districts is changed (e.g. from census districts to postcode areas) (Openshaw 1984).
4In the municipal districts (Kreise) of the outer urban zone, the municipality as smallest statistical unit replaces the sub-city district level. The municipalities of the outer zone on average represent a similar total population as the sub-city districts of the cities (kreisfreie Städte) in the core zone. All population figures in this analysis refer to the permanent population.
characteristics of urban areas in Germany5. Yet, due to a large number of naturalisations and immigration of late repatriates with German citizenship during the past decades it is uncertain to what extent the share of foreign nationals in a region represents the population with a migrant or a specific ethnic background6. Much likely, the administrative data available at the city and district level would therefore provide an insufficient source for a study with a primary focus on ethnic segregation.
The following analysis examines to what extent demographic characteristics (age, household size and, in addition, nationality) vary between neighbourhoods, which of the demographic groups defined by these indicators agglomerate in neighbourhoods, to what extent demographic ageing in combination with regional migration has affected the composition of neighbourhood populations during the past decade and how these changes relate to basic features of cities and neighbourhoods.
Demographic neighbourhood sorting will be examined using regional factor analysis, which is a statistical method common to research on urban segregation.
Urban districts differ from each other by various demographic characteristics.
Factor analysis constructs linear combinations of highly correlated variables in order to filter out the basic features representing most of the total variability. In a second step, a value for each factor is calculated for the statistical districts. Since
5 Strohmeier (2002) finds that in the Ruhr neighbourhoods with a very high share of foreigners are usually low-income areas. In the Ruhr, a large share of foreign nationals stem from immigrants from Mediterranean countries (mainly Turkey) who found labour as industrial “guest workers” over a period from the 1950s to the 1980s. It is a characteristic of neighbourhood sorting in the Ruhr that the “guest worker” population settled in relatively unattractive neighbourhoods with an old housing stock, in close proximity to large industrial plants, e.g. coal mines and steel works. More recently, some of these neighbourhoods have been a focus of immigration from very poor regions of the new Central European member states of the European Union.
6 At the level of the German Federal Lands, administrative statistics now provides information about the residential population with a migrant background. According to these statistics, in 2009 among the 17.9 million inhabitants of North Rhine-Westphalia there were 1.9 million foreign nationals and 2.5 million Germans with a migrant background, i.e. foreigners who adopted German nationality or late repatriates (IntMK (ed.) 2011).
the factors extracted by this analysis are uncorrelated7, they qualify as index values of a subsequent cluster analysis, which classifies districts with similar overall characteristics.
Demographic dynamics over the study period will be explored by regression methods common to the analysis of regional economic growth. It will be the goal to examine to what extent basic characteristics of cities and urban neighbourhoods affected neighbourhood population dynamics during the period from 1998 to 2008. Due to regional spillover effects, change of economic or demographic characteristics of a region may depend, among other factors, on characteristics of neighbouring regions. In regional economic analysis it has, therefore, become common to control for spatial interdependence, i.e. mutual influence between regions (Magrini 2004). Since cities are, however, characterised by considerable segregation, mere proximity between neighbourhoods may not account for such spatial interdependence in an adequate manner. In this analysis, spatial
“proximity” will be accounted for by controls for neighbourhood type and regional characteristics. The delineation of the Rhine-Ruhr conurbation as survey region follows the concept defined by the regional development plan for North Rhine-Westphalia (LEP NRW) (MURL 1995) (Figure 1).
Due to its internal diversity, this urban agglomeration is well-suited as a case study of local demographic change under varying regional conditions. The most obvious subdivision separates between the Ruhr (commonly defined as the administrative area of the Ruhr Regional Association, RVR) and Rhine sub- regions.
7 Linear combinations of the original variables were constructed by a varimax-rotated principal component analysis. Principal components are uncorrelated.
Figure 1 about here
In Europe-wide comparison, the large cities of the Rhine subregion (Bonn, Cologne, Düsseldorf) rank among the top group of cities with respect to income (as measured in GDP per head) and innovation (patent intensity) (Table 1).
Economic prosperity in these cities combines with a very high concentration of 35-45 year-old working-age inhabitants. Cities from the Ruhr (here represented by Bochum, Dortmund and Essen) rank in a middle position among 329 cities from all EU 27 countries, which are taking part in the European Urban Audit data collection (European Communities 2004) in terms of economic prosperity and innovation. They rank relatively highly in the share of 35-45 year-olds, although considerably lower than the Rhine cities.
Table 1 about here
The Ruhr cities are characterised, however, by a very low share of small children (under 5) and a very high share of senior citizens (>60). They rank in the bottom third of all cities regarding city growth between 2001 and 2004. As an outcome of job-related migration, particularly to the more dynamic regions of Southern Germany, some time after the beginning of the decline of the coal and steel industries, the total population of the Ruhr began to shrink in the 1960s (Steinberg 1978: 146). The total population of the Ruhr declined from 5.72 million in 1962 to 5.18 million in 2007, i.e. by 540,000 inhabitants (-9.4%). In the rest of North Rhine-Westphalia the total population increased by over 20% in the same period (RVR 2009). Combined with a decrease in fertility affecting German society as a
whole, by the 1980s there was a higher surplus of deaths over births in the Ruhr than in other regions of North-Rhine Westphalia.
Demographic change during two sub-periods, 1998-2003 and 2003-2008, will be examined. While the data allow no decomposition of the effects of in situ change and migration on neighbourhood populations, it is possible to analyse in what way these dynamics in combination relate to the regional and local context. The neighbourhood typology accounts for mobility, since it separates the “central”
quarters, which gain from migration, from stagnant or declining neighbourhoods with a lower influx. Also, controls for sub-regions will represent diversity of net migration at the city level.
In regional economics, the concept of convergence towards a “steady state” of long-term economic growth describes a similar relation between basic regional characteristics at a specific point in time and growth over a subsequent period (Sala-i-Martin 1996: 1330). The formal specification of neighbourhood-level demographic change in this analysis is
(1) yi,t+5 – yit = α + Tt=1998(ß1Xi,t + ß2Ci + ß3Ri ) + Tt=2003(ß4Xi,t + ß5Ci + ß6Ri ) + ß7Tt=2003 + 𝘶it
where yit is the population of neighbourhood i (i = 1, 2....922) or, alternatively, the share of residents from a specific demographic group in this neighbourhood at time t (t = 1998, 2003), t + 5 is the population or share of the population five years hence, X is a set of neighbourhood characteristics, C a dummy variable representing central city quarters according to the neighbourhood typology
derived above8, R comprises three regional dummy variables for (i) the large cities of the Rhine sub-region (Bonn, Düsseldorf, Cologne), (ii) the large Ruhr cities (Bochum, Dortmund, Duisburg, Essen) and (iii) the other core cities of the conurbation (Gelsenkirchen, Hagen, Hamm, Herne, Krefeld, Leverkusen, Oberhausen, Mülheim/Ruhr, Remscheid, Solingen, Wuppertal), T is a dummy variable representing the base years 1998 and 2003, 𝘶it is disturbance at time t9. As an alternative to a mere description of univariate distributions or bivariate correlations, this approach accounts for the relation between changes in neighbourhood populations and specific regional and neighbourhood characteristics, given that all other influential factors remain constant.
Regional migration and ageing
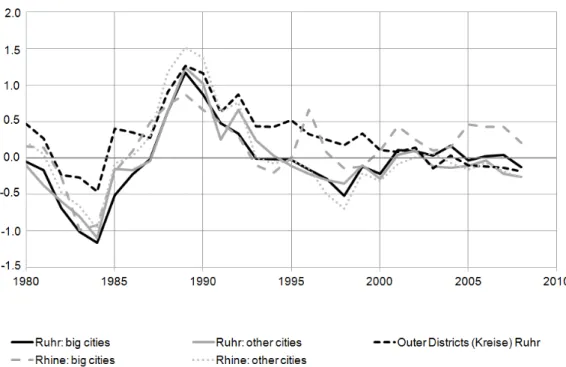
Apart from long-distance migration, which relates closely to regional disparities, there was an ongoing suburbanisation process within the survey region, resulting in continued net migration gains (or comparatively lower losses than in the inner zone) in the outer urban zone during the 1980s and 1990s10. During the past decade, however, net migration to the outer zone has come to a halt (Figure 2).
Figure 2 about here
8The neighbourhood type dummy variable represents a large group of central city quarters (1 = types 1 or 2 from the typology derived above; 0 otherwise) with a relatively diverse range of demographic characteristics. These neighbourhoods comprise almost half of the total population in the conurbation (46% in 2008). Multicollinearity between the neighbourhood type dummy and more specific neighbourhood characteristics is thus avoided.
9To allow for a straightforward interpretation of coefficients, all independent variables are interacted with the base year of both periods and an additional control for time is incorporated (cf. Yip and Tsang 2007).
10Due to immigration from former Eastern Bloc countries and the former Yugoslavia, there were temporary migration gains in all regions between 1987 and 1992.
Today, in the Ruhr cities all age cohorts above 48 are overrepresented in comparison with the rest of North-Rhine Westphalia (NRW). In the cities from the Rhine sub-region, age cohorts from 22 to 44 are (highly) over-represented and most age cohorts above 44 (slightly) under-represented (Figure 3). Accordingly, Klemmer (2001) found that as a result of regional migration during the past decades the Ruhr precedes the overall ageing process of Germany as a whole by about 25 years.
Figure 3 about here
According to current population projections for 2030, the Ruhr population will shrink by another 415,000 inhabitants (-8%) up to 2030 (IT.NRW 2009). In 2030, the share of senior citizens (age cohorts over 60) is expected to be particularly high in the outer districts (Figure 4). The share of younger working-age residents, on the other hand, is expected to be higher and the share of senior citizens lower in the biggest cities (Bochum, Dortmund, Duisburg, Essen) than in the smaller cities and outer zone. In the three most important cities of the Rhine subregion (Bonn, Cologne, Düsseldorf), working-age residents can be expected to remain the prevailing group, while in the smaller cities of the Rhine sub-region the age structure in 2030 is likely to resemble that of the smaller Ruhr cities.
Figure 4 about here
Even though it is difficult to predict in what way residential location preferences may change (again) over the forthcoming decades, according to current projections local differentials of demographic ageing are likely to increase. The following chapter substantiates the spatial analysis by focusing on the neighbourhood level.
Demographic neighbourhood sorting
For the purposes of this study, based on data from 2008, a set of 922 sub-city districts (neighbourhoods) were classified into characteristic demographic “types”
by regional factor and cluster analysis. Residential patterns observed in this analysis reflect a number of basic neighbourhood characteristics identified by previous research in other regions throughout the Western World (Murdie 1969, Knox 1995). Three dimensions (factors) represent most of the differentiation observable by the original indicators (cf. Table 2). The first factor represents young working-age adults (18-40), who co-agglomerate with foreign nationals.
The second is a family factor representing a high share of children (under 18) and an above-average household-size. Factor three stands for older working-age residents (40-50 age cohorts), who tend to agglomerate on the urban fringe (as parents) and (if they have no children) in more central urban residential areas. The first two factors are inversely correlated with the share of older-age residents, i.e.
in their residential priorities families, young city-dwellers and foreigners separate from over 60 year-olds.
Table 2 about here
Based on the factor values of each statistical district, six neighbourhood types (cf.
Tables 3 and 4) were identified11. They can be described as
1. central city commercial areas and surrounding neighbourhoods with a high share of one-person-households, few children and a relatively high share of foreign nationals,
2. “urban” areas with a mixed composition of age groups, household types and ethnic minority groups,
3. “ageing” urban areas with a mixed household structure, a low share of foreign nationals and an above-average share of senior citizens (over 60), 4. “aged” (and relatively wealthy) urban residential areas with a very high
share of seniors (over 60),
5. inner city areas with a very high share of foreigners (and children), inhabi- ted by (low-income) families, and
6. low-density residential areas, inhabited mainly by (high income) families.
Tables 3 and 4 about here
While typical central city neighbourhoods with very small households, few children and high shares of working-age and foreign national residents emerge in all of the large cities, in Cologne and Düsseldorf they dominate among the total spectrum of neighbourhoods to a greater extent than in the large cities of the Ruhr (Figure 5 and Table 5).
11The typology is based on a four-step analysis: 1. Principal component analysis (varimax rotation), 2.
hierarchical cluster analysis (Ward´s method), 3. optimisation of cluster analysis by k-means clustering, 4.
final correction by discriminant analysis (cf. Tables 2 and 3).
Figure 5 about here
Table 5 about here
In especially “high-age” neighbourhoods (Type 4), which account for over 10% of the total population of the study region, already almost a third of all residents are above 60 years old today. According to current projections, ageing at the national level will have proceeded thus far not before 2022, i.e. as mentioned before, parts of the study region precede the overall demographic ageing process in Germany, while the total conurbation resembles German averages in its age composition (Table 4).
International migration during the past decades has alleviated ageing of this largest urban agglomeration in Germany. In the central city quarters (Type 1) foreign nationals comprise an important part of the (predominantly working-age) population. In those neighbourhoods with a very high share of foreigners (Type 5) the number of children is higher than in the family-dominated residential areas (Type 6). Certainly, attraction of international migrants will gain in importance in any regional strategy to meet the forthcoming demographic challenges.
Regional variability of neighbourhood ageing
It has been agreed so far that change in the residential composition of neighbourhoods is driven predominantly by intra-urban migration (O´Loughlin and Glebe 1984). Even though the overall likeliness to migrate relates to different personal characteristics (e.g. education), within the life-cycle, (job-related)
mobility is usually highest in early adulthood (cf. Schwartz 1976).
Neighbourhoods favoured by young adults can therefore be expected to experience a relatively high influx of mobile residents.
Bailey (2012) argues that among the determinants of segregation, in situ change of the residential population, due to the way in which it is affected by ageing or economic change, is gaining in importance. Yet, the pace of these long-term dynamics may be affected considerably by migration. In the Rhine-Ruhr conurbation, between 1998 and 2008, only the central city quarters (Type 1, +0.3%) and the “family”-dominated neighbourhoods (Type 6, +6.1%) gained in population. As explained, the neighbourhood-level data provide no information on migration flows. Yet, since Types 1 and 6 were also the only neighbourhood types, in which the share of the - arguably highly mobile - 18-30 year-olds increased during this period, a connection between migration and neighbourhood composition in this region seems likely (Table 6).
Due to further ageing of the now 40-50 year-old “baby-boomers” born in the 1960s, in about one and a half decades, low-density (Type 6) neighbourhoods will belong to those with a high share of over 60 year-olds, unless many of them decide to move elsewhere in the near future. In these neighbourhoods, ageing of the residential population will, in combination with a lack of an influx of mobile inhabitants, account for considerable changes of local demographic characteristics. Already in the study period from 1998 to 2008, the over 60-year- old population increased most rapidly (+23.4%) in these low-density residential neighbourhoods.
Table 6 about here
Neighbourhood-level demographic ageing is examined on the basis of change over two periods, 1998-2003 and 2003-2008. The analysis suggests that the role of the local context changed from the first to the second period to some extent (Table 7). In both periods, neighbourhoods in the big Rhine cities (Bonn, Cologne, Düsseldorf) on average grew faster than in the outer urban zone, which is the reference category, while those in the big Ruhr cities (Bochum, Dortmund, Duisburg, Essen) (particularly in the first period) and in the smaller cities grew slower (or rather declined at a faster rate).
Table 7 about here
In the first period, central city quarters and “family-dominated” neighbourhoods with a low share of foreigners and with a low share of senior citizens were likely to grow, in the second period those with a low share of under 18 year-olds. The share of foreigners increased particularly in central city quarters, but not in those districts where the concentration of foreigners was high already.
During the second period, growth in the share of youths was related adversely to their overall share at the start of the period. Rather than in other parts of cities, the share of under 18 year-olds now increased in central city quarters.
Further relative concentration of 30-40 year-olds (or relatively low decline of their share in the total population) was a characteristic of neighbourhoods with an above-average share of foreigners and with a high share of seniors. Apparently, residential concentration of 30-40 year-olds shifted somewhat out of the neighbourhoods dominated by working-age residents. Whereas in the first period, 30-40 year-olds were more likely to agglomerate in any city of the inner zone of
the conurbation than in the outer zone, from 2003 onwards they were more unlikely to do so. In this case, it can be assumed that the observed change relates predominantly to in situ ageing of the resident population. Obviously, a shift of the 30-40-year-olds into the next age category during the second period was particularly characteristic of larger cities, where this age group concentrates.
Rapid increase in the share of residents over a specific “seniority” age threshold (e.g. 50 or 60) has become a characteristic of low-density residential areas on the edge of cities and in the outer zone of the conurbation. In both periods the share of seniors (>50) increased in neighbourhoods with an above-average share of children rather than in “urban” locations with a high share of foreigners or a high share of seniors.
Regional disparities are reflected in the demographic composition of urban neighbourhoods, since relative agglomeration of working-age residents (aged 18- 40) in the more competitive cities of the Rhine-Ruhr conurbation (Bonn, Cologne, Düsseldorf) is high. In these cities in particular, working-age residents tend to agglomerate in selected (central city) neighbourhoods, i.e. in their settlement pattern they are more segregated from other age groups here than in other cities.
Foreign national immigrants comprise a large part of the working-age population in these cities.
Throughout the past decade, the tendency of (predominantly childless) working- age residents to separate from older age groups and households with children has increased. While relatively central urban areas with a high-quality housing stock are likely to continue to attract younger mobile working-age residents from Germany and abroad, the high-income low-density residential areas of the urban fringe face considerable changes in their age structure due to decreased fertility,
decreased net migration to these areas and, thus, in situ ageing of the residential population.
It will be an issue for further research to investigate in what way local demographic change determines future migration decisions, i.e. how individuals and households adapt by migration. Based on a survey among mobile households in Mannheim, Gans et al. (2010) find that among the motives of migration out of the city, apart from moving in with a partner and job change, the (inadequate) size of dwelling was dominant. For some of these households, high-quality housing in ageing neighbourhoods of the large cities may be a welcome alternative to relocating to the suburban zone in the future.
Conclusions
Enhanced by migration, there is great regional variability in the progress of demographic ageing. In the most prosperous cities of the Rhine-Ruhr conurbation, particularly in Cologne and Düsseldorf, a constant influx of working-age migrants combines with agglomeration of young adults living in one- or two-person- households in the most popular districts.
Apart from migration between regions, intra-regional migration obviously affects the composition of neighbourhood populations. After several decades of suburbanisation, in the 1990s in the study region net migration from core cities to municipalities in the outer urban zone came to a halt. In neighbourhoods which are not favoured by young adults, due to low fertility and a low influx of mobile households, the total population has begun to decline and the average age to increase, particularly in low-density suburban residential areas.
Segregation between demographic groups would accelerate if agglomeration of young adults attracted even more mobile households to central city quarters. On the other hand, neighbourhoods with an ageing population might benefit from a
“spillover” of households trying to avoid the housing costs of the most popular areas while still seeking urban centrality. For the smaller and the less prosperous cities in this conurbation, it may become an advantage in competition over mobile households that they can offer a less constrained housing market, even in relatively central quarters. After all, the number of commuters in this region is high and many people working in Düsseldorf, for example, commute from their home in the Ruhr on a daily basis.
It is likely that in the large cities of the Ruhr region, which have just overcome being perceived as dominated by old industries, attraction of high-qualified labour will combine with an urban development policy focusing on the requirements of mobile adults more specifically, i.e. to approve construction of high-quality housing at central-city locations or upgrading of Wilhelminian-style (i.e. high quality early 20th-century) housing wherever possible. For a long time, regeneration of inner city neighbourhoods has been known as “gentrification”
(Smith and Williams (ed.) 1986). In the literature, it has been criticised that gentrification often results in displacement of lower-income households (Atkinson 2001). In the Ruhr cities facing a particularly rapid decline in population, so far only relatively small quarters have been “gentrified”. It can even be argued that from the point of view of cities in the Ruhr, at the moment the limited number of
“gentrified” neighbourhoods rather suggests intensified efforts to attract mobile adults than to prevent gentrification.
Immigration from outside of Germany during the past decades has alleviated ageing in the Rhine-Ruhr conurbation. In this region, foreign nationals comprise large shares of the working-age population and many children are born from parents with a migrant background. Immigrants are known to adjust to German low-fertility levels, even though fertility may be higher in their country of origin (Schmid and Kohls 2011). Certainly, it will remain part of the development policy of this large and prosperous urban region to continue to attract international migrants, even if it cannot be expected that they will be characterised by above- average fertility. It is very likely that regional competition over qualified international migrants will increase across Europe. A deepening of regional disparities therefore can be expected to combine with demographic ageing in Europe.
It will be an important task of further research to examine effective regional and local demographic change, i.e. considering the way in which individuals, households, firms and communities react to shifts in the composition of neighbourhood populations. Housing markets have begun to adapt to population ageing and decline, e.g. by refurbishment of the existing stock in order to meet the needs of senior citizens and demolition of unattractive housing built during the post-war urban expansion. Larger housing companies and associations in cooperation with welfare institutions now provide household-oriented services, e.g. cleaning, transport and daycare in their estates (Naegele et al. 2005).
For sure, demographic change gives rise to manifold implications for local communities and markets. It will not be possible for national governments to
“manage” local adaptation to these new challenges. In Germany, experience in project-based cooperation between national, regional and municipal policy and
local interest groups has been gained during implementation of the “Socially Integrative City” programme since the 1990s. The outcomes suggest that local community development can be supported quite effectively by a public policy, which seeks to activate local potential. Adaptation of local economies to demographic change may benefit from the willingness of firms to participate in neighbourhood improvement. The public sector can function as an initiator of such private efforts. Of course, an urban development policy focusing on the living conditions of specific demographic groups may encourage segregation. A governance approach involving local communities should aim at finding a balance of policy measures, which favour prominent parts of the local population without discouraging others from moving in.
References
Atkinson, R. (2001), The hidden costs of gentrification: Displacement in central London. Journal of Housing and the Built Environment 15(4): 307–326.
Baley, N. (2012), How spatial segregation changes over time: sorting out the sorting processes. Environment and Planning A 44(3): 705 – 722.
Barca, F. (2009), An agenda for a reformed cohesion policy. A place-based approach to meeting European Union challenges and expectations. Independent Report prepared at the request of Danuta Hübner, Comissioner for Regional Policy (European Commission, DG Regional Policy, Brussels)
Batini, N., T. Callen and W. McKibbin (2006), The global impact of demographic change, IMF WP 06/9, IMF, Washington D.C.
Bauer, T.K., J.P. Haisken-DeNew and C.M. Schmidt C M (2004), International labor migration, economic growth and labor markets - the current state of affairs.
RWI Discussion Papers 20 (RWI, Essen)
BMI Bundesministerium des Inneren (2011), Jedes Alter zählt.
Demografiestrategie der Bundesregierung. Berlin: BMI.
Börsch-Supan, A. (2003), Labour market effects of population aging. Labour 17(s1): 5-44.
Burgers, J. and S. Musterd (2002), Understanding urban inequality. A model based on existing theories and an empirical illustration. International Journal of Urban and Regional Research 26(2): 403 – 413.
Camagni, R. (2002), On the concept of territorial competitiveness: sound or misleading? Urban Studies 39(13): 2395 – 2411.
Coulson, M.R.C. (1968), The distribution of population age structures in Kansas City Annals, Association of American Geographers 58(1): 155-176
Cowgill, D.O. (1978), Residential segregation by age in American metropolitan areas. Journal of Gerontology 33(3): 446-453.
European Commission (2007). Europe´s demographic future: Fact and figures on challenges and opportunities. Brussels.
European Commission (2011), Demography Report 2010. Older, more numerous and diverse Europeans. Luxembourg: EU Publications Office.
European Communities (2004) Urban Audit Methodological Handbook. 2004 edition. Luxembourg: Office for Official Publications of the European
Communities.
European Council (2006), Council Decision of 6 October 2006 on Community strategic guidelines on cohesion (2006/702/EC) Official Journal of the European Union L291/11. Brussels.
Friedrichs, J. (1988), Ethnic segregation in Cologne, Germany, 1984-94. Urban Studies 35(10): 1745-1763.
Fritzpatrick, K.M. and J.R. Logan (1985), The aging of the suburbs, 1960-1980.
American Sociological Review 50(1): 106-117.
Gans, H.J. (1962), The urban villagers: Group and class in the life of Italian- Americans. New York: Free Press.
Gans, P., A. Schmitz-Veltin and C. West (2010), Wohnstandortentscheidungen von Haushalten am Beispiel Mannheim. Raumforschung und Raumordnung 68(1): 49-59.
Haug, S. (2008), Migration Networks and Migration Decision-Making. Journal of Ethnic and Migration Studies 34(4): 585 – 605.
Heinritz, G., and E. Lichtenberger (1991), Wien und München – ein
stadtgeographischer Vergleich. Berichte zur deutschen Landeskunde 58(1): 55–
95.
Hamnett, C. (1994), Social polarisation in global cities: theory and evidence.
Urban Studies 31(4): 401 - 425.
Harvey, D. (1973) Social justice and the city. Baltimore: John Hopkins University Press.
Hoff, K. and A. Sen (2005), Homeownership, community interactions, and segregation. American Economic Review 95(4): 1167 – 1189.
IntMK Konferenz der für Integration zuständigen Ministerinnen und Minister / Senatorinnen und Senatoren der Länder (ed.) (2011), Erster Bericht zum Integrationsmonitoring der Länder 2005 – 2009. Mainz: IntMK.
ILS Institut für Landes- und Stadtentwicklungsforschung (ed.) (2010),
“Demographischer Wandel in Nordrhein-Westfalen”, 2nd ed., ILS Forschung 1/10, ILS, Dortmund
IT.NRW Information und Technik Nordrhein-Westfalen (2009),
Vorausberechnung der Bevölkerung in den kreisfreien Städten und Kreisen Nordrhein-Westfalens 2008 – 2030/2050. Düsseldorf: IT.NRW.
Johnston, R., M. Poulsen and J. Forrest (2007), Ethnic and racial segregation in U.S. metropolitan areas, 1980-2000: the Dimensions of Segregation Revisited.
Urban Affairs Review 42(4): 479 – 504.
Klemmer, P. (2001), Steht das Ruhrgebiet vor einer demographischen
Herausforderung? Schriften und Materialien zur Regionalforschung 7. Essen:
RWI.
Knox, P. (1995), Urban social geography. An introduction. 3rd ed. Harlow:
Longman.
Lehner, F. (2006), Die Gestaltung des Wandels. Regionalwirtschaft und
Demographie im Ruhrgebiet. Zeitschrift für Wirtschaftsgeographie 50(3/4): 206- 216.
Magrini, S. (2004), Regional (Di)Convergence. In: Henderson, J.V. and J.F.
Thisse (ed.), Handbook of Regional and Urban Economics 4. Cities and Geography: 2741-2796. Amsterdam: Elsevier.
Murdie, R.A. (1969), Factorial ecology of metropolitan Toronto, 1951-1961: an essay on the social geography of the city, RP 116, Department of Geography.
Chicago: University of Chicago.
MURL Ministerium für Umwelt, Raumordnung und Landwirtschaft des Landes Nordrhein-Westfalen (1995), LEP NRW. Landesentwicklungsplan Nordrhein- Westfalen. Düsseldorf: MURL.
Naegele, G., V. Gerling, A. Reichert, G. Heinze, A. Helmer-Denzel, A. Franke und D. Wilde (2005), Demografischer Wandel im Ruhrgebiet. Auf der Suche nach neuen Märkten. Essen: Projekt Ruhr.
Neumann, U. and C.M. Schmidt (2006), Lichtblicke, aber keine Entwarnung – Ausmaß und Konsequenzen des demographischen Wandels im Ruhrgebiet Zeitschrift für Bevölkerungswissenschaft 31(3/4): 443-468.
O´Loughlin, J. and G. Glebe (1984), Intraurban migration in West German cities.
Geographical Review 74(1): 1-23.
Openshaw, S. (1984), The modifiable areal unit problem. Norwich: Geo Books.
Peach, C., V. Robinson and S. Smith (1981), Ethnic Segregation in Cities.
London: Croom Helm
RVR Regionalverband Ruhr (2009), Hintergrund. Demographischer Wandel.
Essen: RVR.
Sala-i-Martin (1996), Regional Cohesion: Evidence and Theories of Regional Growth and Convergence. European Economic Review 40(6): 1325-1352.
Schmid, S. and M. Kohls (2011), Generatives Verhalten und Migration - Eine Bestandsaufnahme des generativen Verhaltens von Migrantinnen in Deutschland.
Forschungsbericht 10. Nürnberg: Bundesamt für Migration und Flüchtlinge.
Schwartz, A. (1976), Migration, age, and education. Journal of Political Economy 84(4): 701 – 720.
Sethi, R. and R. Somanathan (2004), Inequality and segregation. Journal of Political Economy 112(6): 1296 – 1321.
Shevky, E. and W. Bell (1955), Social area analysis: theory, illustrative application and computational procedures. Stanford: Stanford UP
Smith, N. and P. Williams (ed.) (1986), Gentrification of the city. London: George Allen and Unwin.
Steinberg, H. (1978), Bevölkerungsentwicklung des Ruhrgebiets im 19. und 20.
Jahrhundert. Düsseldorfer Geographische Schriften 11. Düsseldorf:
Geographisches Institut.
Strohmeier, K.-P. (2002), Bevölkerungsentwicklung und Sozialraumstruktur im Ruhrgebiet. Demographischer Wandel im Ruhrgebiet. Essen: Projekt Ruhr.
Tivig, T., K. Frosch and S. Kühntopf (2008), Mapping regional demographic change and regional demographic location risk in Europe. Series on Sustainability and CSR 2. Rostock Center for the Study of Demographic Change.
U.S. Census Bureau (2011), Age and sex composition: 2010. Census Briefs 2010.
May 2011. Washington: U.S. Department of Commerce.
Wehling, H.-W. (2003), Industrielles Städtenetz Ruhrgebiet. Stadtforschung und Statistik 02/03: 57-65.
Yip, P.S.L. and E.W.K. Tsang (2007), Interpreting dummy variables and their interaction effects in strategy research. Strategic Organization 5 (1): 13-30.
Figures
Figure 1
Rhine-Ruhr conurbation
According to Regional Development Plan for North Rhine-Westphalia
Fine lines depict municipal boundaries ü
Figure 2 Net migration
Arrivals – departures in % of the total population
Author´s calculation based on data from IT. NRW (Statistics North Rhine-Westphalia). - Ruhr, big cities:
Bochum, Dortmund, Duisburg, Essen; Rhine, big cities: Bonn, Cologne, Düsseldorf
Figure 3
Age structure of cities in the Ruhr and Rhine subregions* in comparison with rest of North Rhine- Westphalia (NRW)
Share of age cohorts among total population, deviation from NRW average without respective group of cities in %
(2008, in %, average of NRW without Ruhr/Rhine cities = 0)
Author´s calculation based on data from IT.NRW (Statistics North Rhine-Westphalia). *Kreisfreie Städte;
Ruhr cities: Bochum, Bottrop, Dortmund, Duisburg, Essen, Gelsenkirchen, Hagen, Hamm, Herne, Mülheim/Ruhr, Oberhausen; Rhine cities: Bonn, Cologne , Düsseldorf, Krefeld, Leverkusen, Mönchengladbach, Remscheid, Solingen, Wuppertal
Figure 4
Projection of age structure in 2030 Age cohorts in % of the total population
Author´s calculation based on data from IT. NRW (Statistics North Rhine-Westphalia). – Ruhr, big cities:
Bochum, Dortmund, Duisburg, Essen; Rhine, big cities: Bonn, Cologne, Düsseldorf
Figure 5
Neighbourhood typology
Demographic neighbourhood types of Rhine-Ruhr conurbation in Düsseldorf, Duisburg and Essen, 2008
Author´s calculation based on data from AG KOSTAT and IT. NRW (Statistics North Rhine-Westphalia)
Tables
Table 1
Rhine-Ruhr cities in European comparison
Ranking among 329 cities taking part in the Urban Audit (2004)
City
rank among 329 cities by GDP/head
(in PPS)
patent intensity*
population
< 5 (in %)
population 35-45 (in %)
population > 60 (in %)
population change 2001-2004
(in %) Rhine
Bonn 49 26 99 4 65 101
Cologne 37 66 127 7 109 193
Düsseldorf 4 10 164 10 76 184
Ruhr
Bochum 103 128 241 22 44 227
Dortmund 115 83 163 70 59 210
Essen 68 69 215 89 24 231
Author´s calculation based on Urban Audit and PATSTAT. - *patent applications per 100,000 inhab.
Table 2
Factor analysis*of demographic neighbourhood characteristics in the Rhine-Ruhr conurbation 2008
variable communality*
*
factor loadings***
factor 1 factor 2 factor 3
foreign nationals 0.80 0.75 0.09 -0.48
under 18 age Group 0.88 0.20 0.91 0.00
18-30 age Group 0.78 0.83 -0.15 -0.27
30-40 age Group 0.80 0.85 -0.28 -0.04
40-50 age 0.94 -0.10 0.10 0.96
above 60 age Group 0.80 -0.82 -0.32 -0.14
household size 0.86 -0.32 0.86 0.14
explained variance (%) 33.6 27.5 25.0
Author´s calculation based on data from AG KOSTAT und IT.NRW - *principal component analysis, varimax rotation, **variance explained by factor model, values between 0 and 1 possible, ***correlation between variables and factors, 922 observations
Table 3
Optimised cluster centres* of demographic neighbourhood types of the Rhine-Ruhr conurbation 2008
Type
cluster centres
factor 1 factor 2 factor 3
1 1.48 -1.71 0.26
2 0.35 0.40 -0.47
3 -0.46 -0.08 0.52
4 -1.12 -0.65 -0.31
5 1.08 1.97 -1.09
6 0.28 1.15 1.9
Author´s calculation based on data from AG KOSTAT und IT.NRW.- 922 observations, *hierarchical cluster analysis using factor values, optimised by subsequent k-means clustering based on original cluster centres and correction by discriminant analysis
Table 4
Demographic characteristics of neighbourhood types of the Rhine-Ruhr conurbation 2008
Type
Rhine-Ruhr Germany
1 2 3 4 5 6
total
1,168,290 3,498,521 3,242,929 1,191,484 551,434 424,298 10,076,956 82,002,356 thereof (in %)
foreigners 18.3 13.8 7.8 7.3 24.3 7.4 11.9 8.8
under 18 12.7 17.6 16.8 14.3 21.4 19.6 16.7 16.7
18 – 30 18.9 14.4 12.4 11.9 16.4 12.2 14.0 14.4
30 – 40 18.4 12.7 11.6 11.1 13.5 12.3 12.9 12.6
40 – 50 16.1 16.3 17.6 15.8 14.9 19.6 16.7 17.0
50 – 60 11.7 13.5 14.4 13.9 12.4 13.9 13.6 13.8
over 60 22.2 25.4 27.3 31.6 21.3 22.4 26.0 25.6
persons per
household 1.6 2.1 2.1 2.0 2.2 2.3 2.0 2.0
Author´s calculation based on data from AG KOSTAT und IT.NRW - Typology: 1 = city centre, 2 = “urban mix”, 3 = ageing, 4 = high-age, 5 = migrants, 6 = families, 923 observations
Table 5
Characteristics of cities in the Rhine-Ruhr conurbation 2008
Colo- gne
Düssel- dorf Dort-
mund Duis-
burg Essen Smaller
Cities Outer Zone demography
total population 995,412 584,217 584,412 494,048 579,759 2,776,270 2,925,406 thereof (in %)
foreigners 17.1 18.4 12.6 15.1 10.3 11.9 9.1
< 18 15.7 14.8 16.3 16.9 15.7 17.1 17.5
30-40 15.9 16.3 13.2 12.6 12.6 12.2 11.9
> 60 23.2 25.2 25.9 26.6 27.6 26.7 26.0
in neighbourhood type..
1: city centre 40.5 44.8 16.7 14.5 19.1 3.8 0.0
2: “urban mix“ 23.2 27.3 24.6 35.8 28.1 40.9 38.5
3: “ageing“ 12.6 17.5 25.5 15.3 9.8 26.0 54.2
4: “high-age“ 7.1 5.6 19.8 19.3 36.0 17.4 0
5: foreigners 9.6 1.0 9.4 13.0 7.0 7.7 0
6: fringe: families 6.9 3.8 4.1 2.1 0.0 4.1 7.3
population change 1998-
2008 (in %) 2.6 2.3 -1.5 -5.7 -4.3 -3.9 -7.1
economy
GDP/head in % of NRW 146.0 234.2 102.6 100.8 122.7 94.2 80.2
services (in %) 82.1 82.9 80.0 66.6 78.0 66.9 63.9
∆ empl. serv. 80-2008 (in %) 45.4 35.6 36.3 18.3 26.0 35.0 80.2
unemployment rate (in %) 12.0 10.7 15.1 14.4 13.6 11.3 8.5
Author´s calculation based on data from AG KOSTAT and IT. NRW (Statistics North Rhine-Westphalia). – services = employment in services (at workplace); ∆ empl.serv. 1980-2008 (in %) = change of number of employees (at workplace) in service sector 1980-2008 in %; unemployment rate = annual average 2008
Table 6
Population change in neighbourhood types of the Rhine-Ruhr conurbation 1998-2008, in %
Type
1 2 3 4 5 6 Total
total 0.3 -2.8 -1.4 -3.6 -1.6 9.4 -1.6
foreigners -6.5 -6.4 -12.9 -4.0 -7.8 2.5 -7.8
under 18 -6.6 -10.3 -11.5 -12.6 -7.4 2.4 -9.8
18 – 30 10.1 -2.4 -5.1 -4.4 -0.6 5.7 -1.3
30 – 40 -10.0 -26.1 -32.4 -31.8 -16.3 -27.6 -26.1
40 – 50 20.4 13.5 18.2 9.9 9.6 41.1 16.3
50 – 60 -6.7 6.0 6.4 -2.6 3.3 18.7 4.0
over 60 -2.0 5.3 14.3 5.6 5.5 23.4 8.0
Author´s calculation based on data from AG KOSTAT und IT.NRW - Typology: 1 = city centre, 2 = “urban mix”, 3 = ageing, 4 = high-age, 5 = migrants, 6 = families, 923 observations
Table 7
Neighbourhood-level demographic change in the Rhine-Ruhr conurbation OLS regression coefficients1, pooled cross section (1998, 2003)
dependent variables population
change (in %) over five years
change over five years in share of ...
(in %-points)
foreigners < 18 30-40 >50
(1) (2) (3) (4) (5)
1998 • share (in %)
foreigners -0.152*** -0.0923*** 0.0281*** 0.0596*** -0.0611***
(0.0194) (0.00760) (0.00542) (0.00555) (0.00855)
age categories (base category: 18-50)
< 18 0.0412 0.00825 0.00496 -0.0623*** 0.0487*
(0.0621) (0.0238) (0.0172) (0.0176) (0.0271)
>50 -0.119*** 0.0277* 0.0827*** 0.0650*** -0.113***
(0.0417) (0.0159) (0.0115) (0.0117) (0.0181)
central city quarter -0.579* 0.737*** -0.0253 0.156* -0.630***
(dummy) (0.320) (0.124) (0.0892) (0.0912) (0.141)
dummies for subregion (base category: outer urban zone)
Bonn-Cologne- 2.152*** 0.710*** 0.114 1.315*** -1.249***
Düsseldorf (0.539) (0.208) (0.150) (0.154) (0.237)
Bochum-Dortmund- -2.157*** 0.122 -0.191 1.083*** -0.288
Duisburg-Essen (0.524) (0.204) (0.147) (0.150) (0.232)
smaller core cities -2.070*** 0.244 -0.226* 1.009*** -0.107
(0.466) (0.181) (0.131) (0.134) (0.206)
2003 • share (in %)
foreigners -0.0344 -0.0448*** 0.0256*** 0.0981*** -0.115***
(0.0215) (0.00834) (0.00602) (0.00615) (0.00949)
age categories (base category: 18-50)
< 18 -0.172*** 0.00535 -0.126*** 0.0508*** 0.114***
(0.0550) (0.0214) (0.0154) (0.0158) (0.0243)
>50 -0.0152 0.0248* 0.0676*** 0.101*** -0.137***
(0.0382) (0.0149) (0.0107) (0.0110) (0.0169)
central city quarter -0.277 0.279** 0.230** 0.579*** -0.715***
(dummy) (0.327) (0.127) (0.0919) (0.0940) (0.145)
dummies for subregion (base category: outer urban zone)
Bonn-Cologne- 2.124*** 0.439** 0.581*** -0.497*** -0.709***
Düsseldorf (0.540) (0.209) (0.151) (0.154) (0.238)
Bochum-Dortmund- -0.913* 0.708*** -0.0687 -0.588*** -0.618***
Duisburg-Essen (0.522) (0.203) (0.147) (0.150) (0.231)
smaller core cities -1.595*** 0.393** -0.137 -1.012*** -0.241
(0.465) (0.181) (0.131) (0.134) (0.206)
dummy for 2003 -2.605 -0.226 1.805* -3.455*** 1.462
(3.473) (1.341) (0.967) (0.989) (1.525)
constant 5.994** -1.020 -3.660*** -4.701*** 5.717***
(2.570) (0.986) (0.711) (0.727) (1.121)
adjusted R² 0.16 0.13 0.27 0.41 0.30
observations 1,825 1,842 1,843 1,843 1,843
Author´s calculation based on data from AG KOSTAT und IT.NRW. - standard errors in parentheses; */**/*** = significant at 10/5/1%-level