Magnetic Excitations in Iron-based Superconductors
I n a u g u r a l - D i s s e r t a t i o n zur
Erlangung des Doktorgrades
der Mathematisch-Naturwissenschaftlichen Fakultät der Universität zu Köln
vorgelegt von
Florian Tim Waßer
aus Solingen
Köln, 2018
Vorsitzender der Prüfungskommission: Prof. Dr. Simon Trebst
Tag der mündlichen Prüfung: 16. Okt. 2018
Contents
Page
1 Iron-based Superconductors 1
1.1 Crystal and Magnetic Structure . . . . 1
1.2 Nematicity in Iron-based Superconductors . . . . 4
1.3 Superconductivity and Spin Resonance Mode in FeSCs . . . . 7
2 Spin Reorientation Transitions and Magnetic Excitations in Ba
1−xNa
xFe
2As
211 2.1 Spin Reorientation Transitions . . . . 12
2.1.1 Section Introduction . . . . 14
2.1.2 Temperature Dependence of Elastic Bragg Scattering . . . 16
2.1.3 Suppression of Magnetic Intensity Below T
c. . . . 20
2.1.4 Polarisation Analysis . . . . 22
2.1.5 Profile Analysis of Magnetic Bragg Reflection . . . . 24
2.1.6 Temperature Dependence of the Orthorhombic Distortion in Ba
0.65Na
0.35Fe
2As
2. . . . 26
2.1.7 Section Summary . . . . 27
2.2 Magnetic Excitations in Ba
1−xNa
xFe
2As
2. . . . 29
2.2.1 Section Introduction . . . . 29
2.2.2 Results and Analysis . . . . 30
2.2.3 Section Summary . . . . 47
2.3 Discussion . . . . 51
2.4 Methods . . . . 55
2.4.1 M: Spin Reorientation Transitions . . . . 56
2.4.2 M: Magnetic Excitations in Ba
1−xNa
xFe
2As
2. . . . 57
2.4.2.1 Data Treatment Na25 . . . . 58
2.4.2.2 Data Treatment Na31 . . . . 58
2.4.2.3 Data Treatment Na35b . . . . 58
2.4.2.4 Data Treatment Na39 . . . . 58
2.4.2.5 Data Treatment Na40 . . . . 59
3 Magnetic Excitations in Ba(Fe
1−xCo
x)
2As
261
3.1 Introduction . . . . 62
3.2 Anisotropic Magnetic Excitations in Underdoped
Ba(Fe
1−xCo
x)
2As
2. . . . 64
3.3 Spin Resonance Mode in Ba(Fe
0.94Co
0.06)
2As
2. . . . 71
3.4 Summary and Discussion . . . . 77
3.5 Methods . . . . 80
4 Incommensurate to Commensurate Magnetic Excitations in LiFe
1−xCo
xAs 81 4.1 Introduction . . . . 81
4.2 Magnetic Excitations in LiFe
0.82Co
0.18As . . . . 85
4.3 Discussion . . . . 89
4.4 Methods . . . . 90
5 The Quest for the Resonance Mode in NdFeAsO
1−xF
x93 5.1 Introduction . . . . 93
5.2 Results . . . . 94
5.3 Summary and Discussion . . . 100
5.4 Methods . . . 101
6 Methods: Neutron Scattering 103 6.1 Basics . . . 103
6.2 Triple Axis Spectrometer . . . 104
6.3 Time-of-Flight Spectrometer, IN4 . . . 108
6.4 Absolute Unit Calculation . . . 108
6.5 Polarisation Analysis . . . 112
Appendix 117 A.1 Spin Reorientation transitions . . . 117
A.2 Magnetic Excitations in Ba
1−xNa
xFe
2As
2. . . 118
A.3 Spin Excitations in Na25 and Na31 . . . 123
A.4 Magnetic Excitations in Ba(Fe
1−xCo
x)
2As
2. . . 126
A.5 Incommensurate to Commensurate Magnetic Excitations in LiFe
0.95Co
0.05As . . . 128
A.6 List of Samples . . . 130
List of Figures 132
List of Tables 133
Bibliography 158
Danksagung 159
Contents
Abstract 161
Kurzzusammenfassung 163
Teilpublikationen 165
Erklärung 166
Definitions
Acronyms and Initials
AE alkaline earth metal (2
ndmain group) AFM antiferromagnet, -ic, -ism,(s)
AIST National Institute of Advanced Industrial Science and Technology AM alkaline metal (1
stmain group)
ARPES angle resolved photo emission spectroscopy BaCo45 Ba(Fe
0.955Co
0.045)
2As
2BaCo60 Ba(Fe
0.94Co
0.06)
2As
2BZ Brillouin zone
C
2two-fold rotation symmetry C
4four-fold rotation symmetry
c-AFM AFM with moments along the c -axis CF crystal field
CH chalcogenides
CuSC cuprate superconductors DFT density functional theory
EDX energy dispersive X-ray spectroscopy FeSC iron-based superconductor
FL Fermi liquid F R flipping ratio FS Fermi surface f.u. formula unit
gdos generalised (phonon) density of states HFSC heavy fermion superconductor
IFW Leibnitz Institut für Festkörper- und Werkstoffforschung Leibnitz Institute for Solid State and Materials Research ILL Institute Laue - Langevin
INS inelastic neutron scattering
IR infrared
LAMP large array manipulation program LDA local density approximation LiCo05 LiFe
0.95Co
0.05As
LiCo18 LiFe
0.82Co
0.18As
LLB Laboratoire Léon Brillouin
MEC magneto-elastic coupling Na25 Ba
0.75Na
0.25Fe
2As
2Na31 Ba
0.69Na
0.31Fe
2As
2Na35a Ba
0.65Na
0.35Fe
2As
2Na35b Ba
0.65Na
0.35Fe
2As
2Na39 Ba
0.61Na
0.39Fe
2As
2Na40 Ba
0.6Na
0.4Fe
2As
2NdF13 NdFeAsO
0.87F
0.13NFL non-Fermi liquid
NMR nuclear magnetic resonance NSF non-spin flip
OrgSC organic superconductors ORT orthorhombic
PDF pair distribution function
pINS polarised inelastic neutron scattering PM paramagnet, -ic, -ism,(s)
QCP quantum critical point QPI quasi-particle interference RE rare earth (element) RG renormalisation group rlu reciprocal lattice unit
SC superconduct -or, -ivity, -ive, -ing SF spin flip
SOC spin-orbit coupling
SQUID superconducting quantum interference device SRM spin resonance mode
TAS triple axis spectrometer TET tetragonal
TOF time-of-flight
WDX wave-length dispersive X-ray spectroscopy XRD X-ray diffraction
Mathematical Symbols
a lattice constant b lattice constant
b
scat(nuclear) scattering length
B magnetic field
B
wbandwidth of resonance mode
c velocity of light, lattice constant
δ ( ... ) delta-function
Contents
δ
αβKronecker delta
∆ four-dimensional difference vector in ( Q, E )-space e elementary charge
E transferred energy from the scattered neutron to the sample
|fi final state
f ( Q ) magnetic form factor F
cohBCS coherence factor
g Landé factor
g ( Q ) geometry factor
γ (= − 1 . 913) gyromagnetic ratio of the neutron
|ii initial state I ˆ unit matrix
I ( Q, E ) neutron intensity at ( Q, E ) k
ffinal neutron momentum k
iinitial neutron momentum
m mass
M total mass
m
emass of electronic m
nmass of neutron M ( Q, E ) resolution matrix
µ magnetic moment
µ absolute value of magnetic moment µ
emagnetic moment of electron µ
nmagnetic moment of neutron
n ( E ) Bose population factor (at fixed temperature) N number of unit cells
p (= ( γr
0/ 2)
2= 2 . 695 fm) scattering "length" ...
for a single magnetic moment of 1 µ
Bp momentum of electron
P neutron polarisation vector Π total neutron beam polarisation
Φ
scalescaling factor for absolute unit calculation Q scattering vector
Q absolute value of Q
R Gaußian approximation of TAS resolution r
0(= e
2/m
ec
2) classical electron radius
d2σ
dΩdE
double differential cross section T
modtemperature of neutron moderator U neutron interaction potential U ˆ interaction matrix
V volume of unit cell
W L bandwidth of the spin resonance mode ξ phonon polarisation vector
χ
0( Q, E ) real part of dynamic susceptibility χ
00( Q, E ) imaginary part of dynamic susceptibility χ
0( Q, E ) bare spin susceptibility
χ ( Q, E ) spin susceptibility
1 Iron-based Superconductors
Contents
1.1 Crystal and Magnetic Structure . . . 1 1.2 Nematicity in Iron-based Superconductors . . . 4 1.3 Superconductivity and Spin Resonance Mode in FeSCs . . . 7
1.1 Crystal and Magnetic Structure
Iron-based superconductors (FeSCs) are a fertile ground to study the interplay between structure, magnetism and superconductivity in a novel class of materials.
Correspondingly, this is the fourth big material class, next to the cuprate (CuSCs) [1–4], heavy fermion (HFSCs) [5–8] and organic superconductors (OrgSC) [9–11], where the mediation of superconductivity is not based on phonons [12]. In order to cultivate that ground many new materials, since their initial discovery [13, 14]
in 2006 respectively 2008, were synthesised. Chemically, the common build- ing blocks are always Fe P n
1or Fe CH
2layers which are more or less separated by an additional spacer layer, c.f. Fig.: 1.1. According to their stoichiometry four main material classes are formed; the 1111 RE Fe P n O
3[15–18], the 122 AE Fe
2As
24[19–23], the 111 AM FeAs
5[24–27] and the 11 Fe CH [28,29]. In this thesis compounds belonging to three of these four classes are investigated, in par- ticular Ba
1−xNa
xFe
2As
2in Chap. 2 and Ba(Fe
1−xCo
x)
2As
2in Chap. 3 of the 122 s, LiFeAs in Chap. 4 of the 111 s and NdFeAsO
1−xF
xin Chap. 5 of the 1111 s.
Superconductivity in FeSCs can be induced by adding or removing charges via dop- ing [19,22,23,30–32], by isovalent substitution [33–35] or by applying external pres- sure [36–38]. Thereby, the orthorhombic and antiferromagnetic (o-AFM) phase becomes suppressed while the tetragonal paramagnetic (t-PM) one is restored.
However, there is a regime in the phase diagram, called orthorhombic supercon- ducting (o-SC), where it microscopically coexists with AFM order [39–43], c.f. the schematic phase diagram for charge doping in Fig.: 1.2. In that context the highest
1P n= pnictogen e.g. P or As
2CH = chalcogenide e.g. S, Se, Te
3RE = rare earth e.g. La, Nd, Sm, Gd
4AE = alkaline earth metal e.g. Ba, Sr, Ca
5AM = alkali metal e.g. Li, Na
Figure 1.1: Room temperature crystal structures of FeSC families. The commonality of FeSCs are the edge-sharing FeAs-tetrahedrons, which are sep- arated by a spacer-layer or by no spacer-layer at all, as in iron-chalcogenides ( CH = Se, Te). From left to right the spacer-layer thickness decreases and is either composed of a rare earth ( RE = La, Ce, Pr, Nd), an alkaline earth ( AE
= Ba, Sr, Ca), or an alkaline metal ( AM = Na, Li).
T
cvalues are found close to the end-point of the o-AFM phase [19, 22, 23, 30–32], where the FeAs
4tetrahedra are most regular [30,51,52], and the three t
2gorbitals ( d
xy, d
zy, d
xz) are most degenerate due to the crystal field.
Furthermore, this observation inspired two different explanations for the pairing mechanism, whereas the first is based on spin fluctuations [53–64] and the second on phonon assisted orbital fluctuations [65–70]. This underlines the triangular relation between structure, magnetism and superconductivity, which are mani- festations of the same mechanism in the spin-driven nematic scenario c.f. Sec. 1.2.
Additionally, details of the SC pairing mechanism are outlined in Sec. 1.3.
In the o-AFM phase, magnetic moments of ∼ 1 µ
B6point along the a axis and are ferromagnetically aligned along b and antiferromagnetical along c and a [26,72,73], c.f. Fig.: 1.2 for a sketch. Consequently, magnetic Bragg peaks in neutron scat- tering are observed at Q = (1,0,L)
ort= (0.5,0.5,L)
tetin the orthorhombic or tet- ragonal notation, which both will by employed in this thesis. Iron-based super- conductors are layered magnets, due to their order, and the fact that they mech- anically cleave easily along the c axis.
6c.f. Lumsdenet al.[71] and references therein
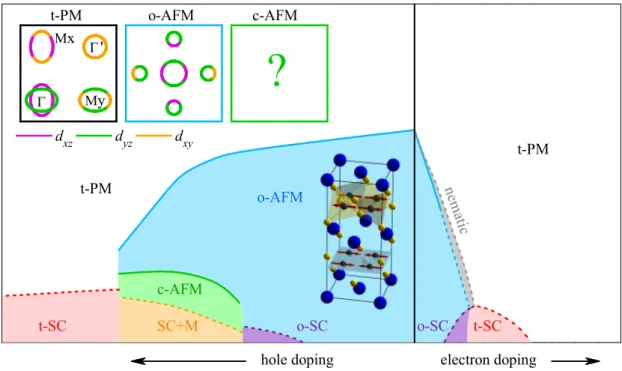
Figure 1.2: Generic phase diagrams of FeSCs. Solid lines denote first or- der phase transitions and dotted lines second order. Note that according to Kim et al. [44] the nature of T
Nchanges from first to second order in Ba(Fe
1−xCo
x)
2As
2. The phase diagram is based on various reports in the lit- erature [31, 45–47] and the Fermi surfaces are reproduced from Ref. [48–50].
Moreover, in the phase diagram, the T
Ntransition line is coupled closely to the T
sone, signalling the orthorhombic distortion due to strong magneto-elastic coupling
(MEC) [74]. With increasing hole doping both transition temperatures are always
identical, first order in nature and never split [30, 46, 75]. On the opposite, with
increasing electron doping, the T
N- T
stransition-lines are still coupled, but begin
to split and thus give place to the so-called nematic phase, which is described in
more detail in Sec. 1.2. Furthermore, the T
Ntransition character changes from
first to second order before SC emerges [44]. In any case, for underdoped FeSCs su-
perconductivity develops from an orthorhombic and antiferromagnetically ordered
state. This means that the SC gap opens on an already reconstructed and par-
tially gapped Fermi surface with an orbital polarisation [48–50,76,77]. The orbital
polarisation arises below T
s, as the degeneracy of the d
zyand d
xzorbitals is lifted
by the orthorhombic distortion [49]. A sketch of the FS in the t-PM and o-AFM
phase is given in the inset of Fig.: 1.2. Once more, this highlights the intimate
relation between lattice structure, magnetic order and superconductivity. In par-
ticular, this indicates that a complete description of the SC state needs to take
the details of an orbital-dependent band structure into account. The consequences when superconductivity emerges in the presence of strong AFM gaps are explored in Sec. 3.2.
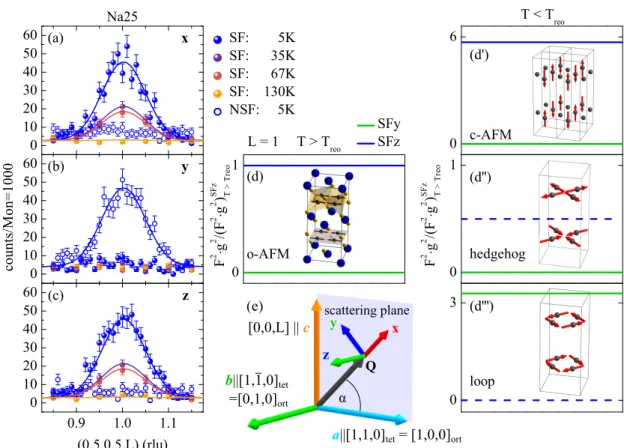
Another aspect was highlighted by polarised inelastic neutron (pINS) scatter- ing, where an intriguing spin-space-anisotropy was found, which indicates the importance of spin-orbit coupling (SOC). Although FeSCs are layered magnets the magnetic anisotropy gap for out-of-FeAs-layer excitations is smaller than the one for in-layer excitations [78–80]. In a recent theoretical calculation including the effect of SOC the gap anisotropy could be reproduced [81]. Moreover, the c polarised low-energy excitations can condense via a spin reorientation for at the AE -site hole doped 122s, while the associated c-AFM phase occupies a small fraction in the o-AFM dome in the corresponding phase diagram [45–47, 82–84].
This spin reorientation, where magnetic moments realign from their in FeAs-layer alignment towards the c axis via a first order phase transition, documents the role of SOC, again. Consequently, the transition will reconstruct the reconstructed Fermi surface and thus forms a new basis from which superconductivity emerges ultimately. Notably, hole-doping at the Fe-site in the 122 family also yields to a magnetic order with moments pointing along the c axis, but superconductivity is not induced [85–89]. However, the spin reorientation transition does not inflict a major penalty on the T
cvalues. This transition and the associated implications for superconductivity are explored in more detail in Chap. 2.
1.2 Nematicity in Iron-based Superconductors
The crystal and magnetic structure of FeSCs, i.e. the t-PM, o-AFM or c-AFM phase, form the basis from which superconductivity emerges, eventually, and as a consequence, understanding of these normal state properties is paramount to comprehend the SC one. From the advent of FeSC, a strong coupling between magnetic order and orthorhombic lattice distortion is observed, as the associ- ated ( T
s, T
N) transition lines follow each other in the ( T − x ) phase diagram, c.f. Fig.: 1.2. Thereby, early theoretical works proposed that the orthorhombic phase is not driven by the lattice degrees of freedom, i.e. phonons, but by elec- tronic ones [90,91]. In this context, large anisotropies along the two directions of the FeAs-layers were observed experimentally, e.g. in resistivity measurements in Ba(Fe
1−xCo
x)
2As
2, where it reaches a factor of two [92–94], in ARPES measure- ments d
zy/ d
xzorbitals split at temperature far above T
s[49], susceptibility [95]
and magnetic torque measurements [96] and in polarised inelastic neutron scat-
tering (pINS) where the magnetic signal in the spin flip (SF) channels y and
z split at 70 K > T
S= 33 K in Ba(Fe
0.952Ni
0.048)
2As
2[97]. Note that the or-
thorhombic distortion causes real crystals to form twin domains, whereas the
Figure 1.3: Schematic sketch of the spin-nematic and magnetic trans- ition. The rotational symmetry of the lattice and the time-reversal sym- metry can be broken in two consecutive steps. First, only the C
4lattice sym- metry is broken, no static magnetic order develops hM
ii = 0, but directed spin-fluctuations are formed hM
12i 6 = hM
22i 6 = 0. Second, static magnetic or- der sets in and time-reversal symmetry is broken, hM
1i 6 = 0, hM
2i = 0 and hM
12i 6 = hM
22i 6 = 0. This picture is reproduced from Fernandes et al. [99].
above listed experiments were predominantly conducted on detwinned samples realised by applying a small pressure, a few MPa, along one axis. Nonetheless, an orthorhombic distortion, where the corresponding a and b lattice constants deviate by just ∼ 0 . 5 % from each other, can hardly explain the observed aniso- tropies, in particular their doping dependence, as e.g. the resistivity anisotropy in Ba(Fe
1−xCo
x)
2As
2is largest at x ∼ 4 . 5 % Co doping and not at 0 %, where the orthorhombic distortion is largest [92,98].
The observed anisotropies are associated to an (electronic) order parameter, which breaks the rotational symmetry, but preserves the time-reversal symmetry [91,99].
By construction, this order parameter is similar to the one in liquid crystals, when rod-like molecules all point in one direction, and is hence termed by analogy as nematic [91]. Since the orthorhombic distortion in FeSCs force the order para- meter to point in one direction, a or b , it becomes Ising-like and associated phase is thus called Ising-nematic order [91,99].
Theoretical calculations emphasise that the origin of the nematic phase and the
SC pairing symmetry are consequences of the same scenario [91]. This implies
that a detailed knowledge of the normal state properties has direct consequences
on the superconducting one. However, the nematic transition can be driven by two electronic degrees of freedom, either charge/orbital or spin fluctuations. As a consequence, the charge/orbital scenario provides an SC state whose gap function preserve its sign on the hole and electron Fermi surface pockets, i.e. a s
++-wave, while the magnetic scenario induces a sign change of the gap on the corresponding pockets and thus yields a s
±-wave, c.f. next section for the SC pairing symmetry.
Although, both electronic degrees of freedom are strongly coupled to each other, meaning the divergence of one susceptibility causes the other’s also diverge, i.e.
magnetic order triggers orbital order and vice versa, a recent renormalisation group (RG) analysis could demonstrate that nematic order is caused by spin fluc- tuations [53].
In the following, the interplay between nematic and magnetic order is elucidated.
The o-AFM phase is doubly degenerate as spins can order in parallel stripes along the b axis, yielding a propagation vector Q
1= ( π, 0), or in parallel stripes along the a axis with Q
2= (0 , π ). Correspondingly, the magnetic orders are labelled as hM
1i and hM
2i , and either breaks the time-reversal symmetry and the rotational one of the lattice below T
N. However, (spin) fluctuations, labelled as hM
i2i , can separate both symmetry-breaks such that the rotational C
4lattice symmetry is broken to C
2at a higher temperature, than the time-reversal symmetry. Accord- ingly, as stated above, the nematic phase is characterised by broken C
4lattice symmetry due to directed spin fluctuations hM
12i 6 = hM
22i 6 = 0, while no static order is developed hM
ii = 0, yet. Moreover, at a lower temperature static mag- netic order sets in, e.g. hM
1i 6 = 0 and hM
2i = 0. The split transitions from the t-PM phase via the nematic one to the o-AFM state are summariesed in Fig.: 1.3.
Due to its direct connection to SC, nematicity in FeSCs is a hotly debated topic [98–102], while the most recent discussions are focussed on FeSe [28,29,103–108].
This compound displays the largest nematic region in FeSCs is observed so far,
as there is a structural phase transition at ∼ 90 K but no static magnetic order is
realised down to lowest temperatures, while SC emerges at ∼ 8 K. Additionally,
electronic nematicity is proposed to be realised in CuSCs [109] and HFSCs [110],
as well, hence it seems to be a more general property of high-temperature super-
conductors [111]. In this context a nematic SC state was recently discovered in
the topological superconductor Cu
xBi
2Se
3[112].
1.3 Superconductivity and Spin Resonance Mode in FeSCs
Superconductivity is one of the most mesmerising phenomena in solids. In this phase, electrons bind to Cooper pairs, and within BCS-theory this binding is based on an attractive interaction, which is mediated by an exchange boson [113].
In the early days before the advent of heavy fermion (HFSCs) and cuprate super- conductors (CuSCs) this exchange boson is a phonon, which naturally provides an easy explanation for the isotope effect
T
c∼ m
−12. Moreover, BCS theory as an electron-phonon weak-coupling approach yielded two fundamental equations to calculate the critical temperature T
cand the corresponding energy gap ∆
SC, which can be interpreted as the Cooper pair’s binding energy
k
BT
c= 1 . 13~ ω
D· exp
− 1 λ
, (1.1)
2∆
SC= 3 . 52 k
BT
c. (1.2)
ω
Dis the Debye frequency and λ the electron-phonon coupling parameter. By this reason the T
cvalue of today’s record holder H
3S with T
c(200 GPa) ∼ 200 K can easily be understood [114].
On the other hand and today not fully resolved is the emergence of superconduct- ivity in HFSCs, CuSCs, OrgSCs and FeSCs [3,11,60,115,116] where the interaction is mediated without phonons [117, 118]. In particular it was theoretically shown by density-functional perturbation theory that λ in LaFeAsO
1-xF
xis 5-6 times too small to account for the observed T
cvalues [12]. Moreover, the change in mag- netic exchange energy between the normal (NS) and the superconducting (SC) state in the CuSC compound YBa
2Cu
3O
6.95and the HFSC compound CeCu
2Si
2is respectively 15 or 20 times larger than the corresponding SC condensation en-
ergy [119,120]. Consequently, this observation supports the argument that super-
conductivity is driven by (residual) spin-spin interactions [5–7]. In view of BCS
theory the associated exchange-boson to mediate the electron-electron interaction
will be called paramagnon [121]; whereas in recent literature the rather unspe-
cific term spin fluctuation is mostly propagated. The importance of paramagnos
is demonstrated by time-of-flight (TOF) and resonant inelastic X-ray scattering
(RIXS) experiments, where their dispersions and spectral weights in the non-
magnetic and doped compounds resemble those of magnons in the corresponding
host compounds [4,122–124]. This observation connects the FeSCs to the CuSCs
and possibly to the HFSCs [125] as well. Furthermore, investigation of the spin
excitation spectra in the NS and SC state can provide information on the pair-
ing mechanism. Although, the pairing symmetry in CuSCs is d
x2−y2[126, 127],
in FeSCs it is broadly agreed on s
±[55–59, 128] and is still unsettled in HF-
SCs [115,129]; all these compounds share another experimental feature - the spin
resonance mode [120,130–135].
The spin resonance mode (SRM) is characterised by a divergence in the imagin- ary part of the dynamical susceptibility, which is observable in INS. Theoretically within an random-phase approximation (RPA) the dynamical spin susceptibility is given by
χ ( Q, E ) = h
I ˆ − U χ ˆ
0( Q, E ) i
−1χ
0( Q, E ) , (1.3) with unit and interaction
7matrices ˆ I and ˆ U respectively and the bare spin suscept- ibility χ
0( Q, E ) [8,56,57,59,116,118]. The emergence of a resonance (divergence) in this term is related to the BCS coherence factor for flipping the spin of a quasiparticle scattered from k to k + Q which is given by
F
coh= 1 2
1 − ∆ ( k ) ∆ ( k + Q ) E ( k ) E ( k + Q )
(1.4) on which χ
0( Q, E ) depends. Thereby, E ( k ) = p
ε
2( k ) + ∆
2( k ) is the SC qua- siparticle energy, ε ( k ) denotes the quasiparticle dispersion and ∆ ( k ) is the SC gap function. If the gap function possesses the same sign at ∆( k ) and ∆( k + Q ) the coherence factor vanishes and causes a smooth increase of the magnetic re- sponse above the threshold value Ω
c= min ( | ∆( k ) | + | ∆( k + Q ) | ), i.e. there is no resonance while a shift and accumulation of spectral weight could experimentally still be observable. On the other hand if sgn (∆( k )) = − sgn (∆( k + Q )) there is a divergence in χ
00( Q, E ) and the corresponding resonance peak is to be found at E
SRM, pushed below Ω
cby an amount which scales with ˆ U [116]. Consequently, the SRM is deeply related to the pairing symmetry and its exploration provides vital information on the corresponding mechanism. While the d -wave gap sym- metry in CuSCs [9,127,136] and HFSCs [8,120,137] naturally displays the required sign change for the SRM to appear, the situation is more challenging in FeSCs, due to their multi-band and -orbital Fermi surface. Phase-sensitive measurements showed that the gap symmetry in FeSCs is a s -wave [128,138–140], which can only be reconciled with the SRM when the gap function changes its sign on distinct pockets of the Fermi surface connected by Q . Accordingly, the SC gap symmetry is called s
±. At the Fermi surface of FeSCs the hole pockets located at the Γ -point and the electron pockets at the M -point fulfil that condition [77, 141–145], c.f.
Fig.: 1.4 (a).
Although this points to the potential importance of nesting, and indeed in the par- ent compounds AFM order is observed at Q , magnetic moments are neither fully itinerant nor local, but instead, a hybrid picture holds, c.f. Ref. [146] Chap. 10
7note that the interaction leading tos±superconductivity is repulsive, while the one leading tos++ superconductivity is attractive
0 2 4 -
-
- -
+ Q
(b)
+ +
+ +
+
(a') (a)
s
(b')
s ++
E ( )
Figure 1.4:
Pairing symmetry and spin resonance mode. (a) Typical FS in FeSCs when ∆
SCchanges sign, s
±-wave. (a’) corresponding SRM peaking below 2∆
SC. (b) same as in (a) for s
++-wave. (b’) corresponding SRM peaking above 2∆
SC. This sketch is based various reports in the literature [57,66]
and references therein. Moreover, the nesting condition is not crucial for supercon- ductivity to emerge as one of the electron bands e.g. sinks below the Fermi surface in Ba
0.1K
0.9Fe
2As
2( T
c∼ 9 K) [147], is badly nested in LiFeAs [148] ( T
c∼ 18 K) or is even absent in K
0.8Fe
1.7Se
2( T
c∼ 30 K) [149]. Although there is a broad consensus that superconductivity is driven by paramagnons [53–64] an alternative model based on para-orbitons
8is proposed [65–70]. In this model, there is no sign change on the hole and electron pockets of the Fermi surface and the cor- responding SC gap symmetry is labelled as s
++, c.f. Fig.: 1.4 (b). Consequently, there is no divergence in χ
00( Q, E ) and thus no SRM in the INS spectra. How- ever, a resonance-like mode can be mimicked as the spectral weight of low-energy excitations is shifted and accumulated above 2∆
SC. Therefore, the SRM can func- tion as means to distinguish between both pairing symmetries, i.e. in particular E
res< 2∆ ⇒ s
±indicates s
±pairing symmetry, while the opposite case E
res> 2∆
points towards s
++symmetry, c.f. Fig.: 1.4 (a’), (b’).
Recently Korshunov et al. [58] elaborated this condition in the case of two un- equal SC gaps and attached an extensive list of compounds found in the lit- erature. In short, the overwhelming majority of all listed compounds adhere to this condition and corroborate the s
±pairing symmetry mediated by para- magnons. Therefore, the SRM includes information on which low-energy para- magnons (spin-fluctuations) can contribute to the pairing, especially when super- conductivity emerges from an antiferromagnetically ordered state like in under- doped Ba(Fe
1−xCo
x)
2As
2, c.f. Chap. 3. Additionally, it also contains information on the paramagnon’s polarisation, in particular, when the ordered moments, and thus in a naive picture, the associated fluctuations concomitantly rotate from an alignment within the FeAs-layers to a perpendicular one, as it is the case in Ba
1−xNa
xFe
2As
2, c.f. Chap. 2. Since the SRM is based on the quasiparticle scat- tering processes at the Fermi surface, which is predominantly composed of the
8in view of BCS theory the para-orbiton is the associated boson to phonon assisted charge fluctuations in thet2g anddz2 orbital occupation to mediate SC
three t
2g( d
xy, d
xzand d
zy) orbitals [49, 50, 76, 150], it also retains information on the orbital dependence of the pairing mechanism itself. Notably an orbital and band selective pairing mechanism [151] is proposed to explain the split or double SRM in several FeSCs [61, 152–155]. Thereby the part at low energies is aniso- tropic in spin space while the one at higher energies is still isotropic [152,153,155], which already indicates the relevance of spin-orbit coupling (SOC). However, the energy at which the isotropic part of the SRM peaks scales with the corresponding T
clike in CuSCs [152,156–158] yielding
E
resk
BT
c≈
( 5 . 3 for CuSCs ,
4 . 3 for FeSCs . (1.5)
Until today there is still no overall theory on superconductivity in FeSCs, which
includes SOC, orbital selectivity, considers MEC effects, states how SC can emerge
from an AFM ordered state, and what happened when the underlying magnetic
ordering direction is changed. Accordingly, the study of magnetic excitations, in
particular, the SRM continues to contribute vital information to aid our under-
standing of superconductivity.
2 Spin Reorientation Transitions and Magnetic Excitations in Ba 1−x Na x Fe 2 As 2
Abstract
In iron-based superconductors the lattice degrees of freedom, magnetic order and
superconductivity are strongly coupled. This particular interplay is investigated
by X-ray, elastic and inelastic neutron scattering in Ba
1−xNa
xFe
2As
2. Over a
broad doping range 0 . 25 ≤ x ≤ 0 . 39 the magnetic moments undergo a second
transition and realign themselves from the ab plane along the c axis, before any
magnetic order terminates at 0 . 4 ≤ x . The spin reorientation documents the
importance of spin-orbit coupling in theses materials and defines an altered mag-
netic ground state from which superconductivity eventually emerges. The intuitive
picture of concomitantly rotated low-energy spin fluctuations (paramagnons) to
mediate superconductivity is not confirmed as these are equally polarised as in
the electron doped compound without a spin reorientation. Consequently, low-
energy spin fluctuations are decoupled from the underlying static order which puts
further constrains on a band and orbital selective pairing mechanism. Another
experimental fingerprint of the superconducting pairing mechanism is the spin
resonance mode. In Ba
1−xNa
xFe
2As
2this mode is split and, as shown by absolute
unit calculation, the intensity of the low-energy part is the recaptured amount of
the suppressed static magnetic moment below T
c. This provides a simple explan-
ation of the recently observed double spin resonance modes in various compounds
and should be reconsidered in the band and orbital selective pairing mechanism.
Contents
2.1 Spin Reorientation Transitions . . . 12 2.1.1 Section Introduction . . . 14 2.1.2 Temperature Dependence of Elastic Bragg Scattering . 16 2.1.3 Suppression of Magnetic Intensity Below Tc . . . 20 2.1.4 Polarisation Analysis . . . 22 2.1.5 Profile Analysis of Magnetic Bragg Reflection . . . 24 2.1.6 Temperature Dependence of the Orthorhombic Distor-
tion in Ba0.65Na0.35Fe2As2 . . . 26 2.1.7 Section Summary . . . 27 2.2 Magnetic Excitations in Ba1−xNaxFe2As2 . . . 29 2.2.1 Section Introduction . . . 29 2.2.2 Results and Analysis . . . 30 2.2.3 Section Summary . . . 47 2.3 Discussion . . . 51 2.4 Methods . . . 55 2.4.1 M: Spin Reorientation Transitions . . . 56 2.4.2 M: Magnetic Excitations in Ba1−xNaxFe2As2 . . . 57
2.1 Spin Reorientation Transitions
Info
The data presented in this section are already published in Waßer et al. ., physica status solidi (b), 254 , 1600181 (2017) [159] and partially in Waßer et al. ., Phys.
Rev B, 91 , 060505(R) (2015) [82]. This section is based on these publications.
Section Abstract
Hole doping on the alkaline earth metal side in 122 iron-based superconductors
induces a second magnetic phase within but at the end of the o-AFM dome. In
this phase, the moments are rotated from their previous alignment within the
FeAs-layers towards the c , and thus perpendicular to the layers concomitantly
with a reversion of the orthorhombic distortion. Accordingly, this novel mag-
netic phase is labelled as c-AFM and the properties of a prototypical compound
Ba
1−xNa
xFe
2As
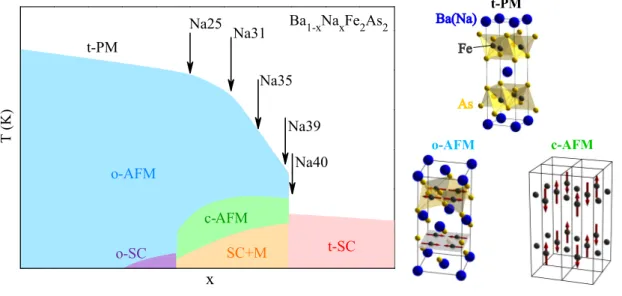
2with 25 % ≤ x ≤ 40 % are presented. Increasing the Na doping
from 25 % to 39 % reduces T
Nfrom 120 K to 61 K, while the transition temper-
ature for the c-AFM phase T
reoremains rather stable between 35 K and 46 K,
while any magnetic order vanishes abruptly at x = 40 %. The second magnetic
transition is exclusively attributed to the reorientation and first order in nature,
while it is only complete at x ∼ 35 %. Moreover, in the superconducting and AFM
coexistence phase, the ordered magnetic moment’s suppression increases with T
c.
In particular, when both magnetic configurations coexist the c-AFM alignment
is stronger suppressed than the o-AFM one, indicating that the former is less
compatible with superconductivity than the latter.
Ba(Na) Fe
As t-PM
o-AFM c-AFM
Figure 2.1: Schematic phase diagram of Ba
1−xNa
xFe
2As
2. Ba
1−xNa
xFe
2As
2hosts at least six different phases like tetragonal paramagnetic (t-PM), or- thorhombic antiferromagnetic (o-AFM), orthorhombic antiferromagnetic and superconducting (o-SC), a spin reoriented phase with moments along the c axis (c-AFM), c-AFM with superconductivity (SC+M) and a purely super- conducting tetragonal phase (t-SC). The corresponding crystal and magnetic structure for the t-PM, o-AFM and c-AFM are shown on the right-hand side.
2.1.1 Section Introduction
Doping holes on the AE (Alkaline Earth metal) in AE Fe
2As
2stabilises a pe- culiar second magnetic phase within the o-AFM dome [45, 46, 83]. It emerges at intermediate doping levels and is a phase, where the moments reorient from their alignment within the FeAs-layers towards a perpendicular orientation [82].
Consequently this magnetic phase is labelled c-AFM and a schematic phase dia-
gram of Ba
1−xNa
xFe
2As
2and the corresponding crystal/magnetic structures are
presented in Fig.: 2.1. The spin reorientation is in line with the low- T AFM gap
anisotropy of the host compound BaFe
2As
2. There pINS experiments showed that
it is easier to rotate the spins out of the FeAs-layers than within, counter-intuitive
to a layered magnet [78]. A similar spin space anisotropy is reported for the 111
system NaFeAs [80,160], however a spin reorientation has not been observed since
it is impossible to hole-dope this system on the Na-site, most likely. In the 1111
FeSC compounds the spin space anisotropy is uncharted territory as it is a chem-
ical non-bested challenge to synthesise large single crystals. However, spin space
anisotropy indicates the importance of spin-orbit coupling (SOC) as it is the nat-
ural origin to pin magnetic moments along certain crystallographic axes, i.e. here
along [1 , 1 , 0]
tet(tetragonal notation) or equivalent along [1 , 0 , 0]
ort(orthorhombic
notation). A recent theoretical study explores the influence of SOC on the mag- netic anisotropy and can reproduce the experimental observations albeit neglected magneto-elastic coupling (MEC) [81].
Due to strong MEC, the spin reorientation leads to a reduction of the orthorhombic phase with C
2symmetry and thus to a recovery of the tetragonal phase with C
4symmetry. Since the reorientation can be viewed as a spin-flop, it is necessarily a first-order transition, which allows phase coexistence of both magnetic orders. An early study on Ba
1−xNa
xFe
2As
2reported the recovery of C
4symmetry coexisting with a doping dependent orthorhombic C
2fraction, reaching up to 40 % [45]. In the related compound Ba
1−xK
xFe
2As
2, thermal expansion measurements observed a full recovery of C
4symmetry in the c-AFM
1phase [46], in contrast to X-ray and neutron diffraction studies on polycrystalline samples where a phase fraction of only ∼ 10 % is reported [84]. Note, the c-AFM phase in Ba
1−xK
xFe
2As
2occupies a much smaller volume in the phase diagram than in Ba
1−xNa
xFe
2As
2, but it can be expanded under hydrostatic pressure [161, 162]. In a simple hard-ball model of atoms, the smaller ionic radius of Na in comparison to K induces chemical, equivalent to external, pressure and thus enlarges the c-AFM phase.
Single- vs. Double-Q Structure
Although, neutron scattering can unambiguously determine the spin reorienta- tion it cannot distinguish between a single- and a double- Q structure. In the former, moments simply rotate out of the FeAs-layers, but the overall lattice symmetry is still orthorhombic; while in the latter a superposition of the two or- dering vectors ( π, 0) (horizontal AFM stripes) and (0 , π ) (vertical AFM stripes) is observed, which results in tetragonal lattice symmetry with half of the Fe-sites carrying a doubled magnetic moment while the rest is non-magnetic. The double- Q structure is compatible with the thermal expansion measurements [46] and has been confirmed by infra-red spectroscopy [163,164], muon spin rotation [164,165]
and Mößbauer spectroscopy [166]. However, a recent pair distribution function (PDF) analysis indicated that the short-range local symmetry around 20 Å ∼ 5 lattice constants, is still orthorhombic while on larger length scales the system is tetragonal [167]. To reconcile this observation with the highly local results from Mößbauer [166] the authors concluded that the orthorhombic regions in the c-AFM phase are fluctuating on time-scales between 10
−7s to 10
−13s [167]. Since Mößbauer can sense phenomena on time-scales up 10
−7s, the overall magnetic/lattice struc- ture appears to be double- Q /tetragonal in this technique. On the other side, the deviation from the data for the tetragonal model is only slightly larger than for the orthorhombic one and a phase coexistence of c-AFM and o-AFM regions is
1due to their macroscopic measurement the authors labelled this phase C4 phase, contrary to the notation here. Moreover, the label C4 for this phase is more widespread than c-AFM in the literature.
not discussed [167]. Here, by using large single crystals of Ba
1−xNa
xFe
2As
2, it will be shown that the spin reorientation is only complete in the middle of the c-AFM dome and that otherwise a mixture of c-AFM and o-AFM can be found, as consequence of the first order phase transition.
2.1.2 Temperature Dependence of Elastic Bragg Scattering
The structural and magnetic transition temperatures, T
s, T
Nand T
reo, can be eas- ily identified by neutron scattering. Therefore, the intensity at fixed Q -positions was traced as a function of temperature. In particular, since the orthorhombic distortion is expected to be small in the doping range 25 % ≤ x , the tetragonal notation is employed meaning the magnetic Bragg peaks are found at (half-integer, half-integer, odd integer) as HKL values. Ba
1−xNa
xFe
2As
2samples are referred according to their EDX-determined Na composition, e.g. Ba
0.61Na
0.39Fe
2As
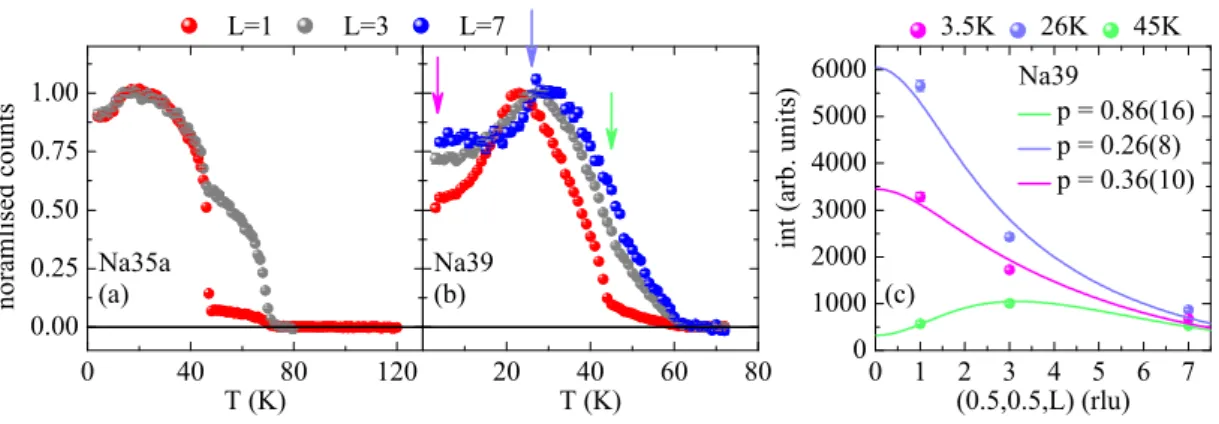
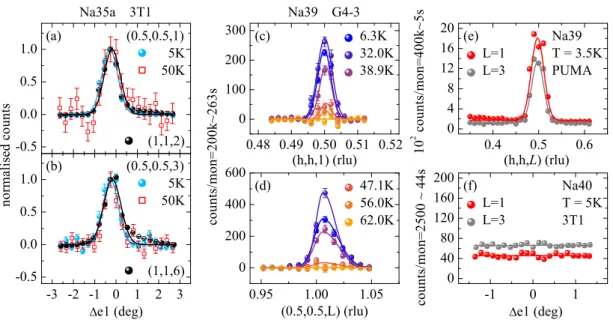
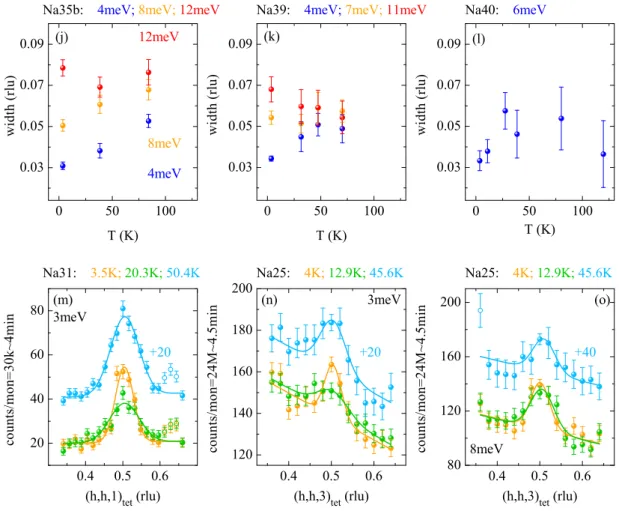
2is Na39. Figure 2.2 summarises the data at the nuclear Bragg peaks for Na25, Na31, Na35a, Na39 and Na40 in (a)-(e), respectively, while the data for the mag- netic Bragg peaks are shown in (a’)-(e’). Furthermore, the extracted transition temperatures are listed in Tab.: 2.1. Note that there are two 35 % Na-doped samples labelled as Na35a and Na35b, while the former is used exclusively in this section, the latter is employed for the inelastic studies in Sec. 2.2 due to its bigger mass. Although they should be stoichiometrically identical within EDX error, Na35b displays a slightly higher T
Nof 79 K than Na35a as can be seen in Fig.: 2.14(e). However, the (normalised) temperature vs. intensity curves of the (0 . 5 , 0 . 5 , 1) magnetic Bragg peaks fall on top of each other at T & 60 K and display an identical T
reoas well as the intensity suppression below T
c. Since the slope of the T
N-transition line in this region of the phase diagram is steep, c.f.
Fig.: 2.1 and Ref. [45], even a very small variation of x will cause this shift of T
Nbut will leave T
reoand T
cunaffected, as the corresponding slopes of the transition lines are gradual to flat. A comparison of the temperature dependence for both samples is given in Fig.: A.1.1 of the appendix.
Identically to Ba
1−xK
xFe
2As
2the T
s- T
N-transition line does not split with doping throughout the phase diagram and is always first order in nature [30, 46, 47, 75].
Even small orthorhombic distortions have a strong impact on the nuclear Bragg peaks, as the resulting (twin) domain formation drastically reduces extinction and multiple scattering events. Therefore, the structural transition at T
scan be easily observed as an intensity increase for all studied samples, except for Na40 which shows no structural/magnetic transition down to 3 K
2. When the system enters the c-AFM phase the magnetic moments rotate out of the FeAs-layers [82] reducing the orthorhombic splitting and hence recovering the extinction and multiple scat-
2most likely there is no magnetic order below that temperature, as it would realise a very rare scenario: magnetic order develops deep in the superconducting phase.
0.8 1.0
0 40 80 120 -0.2
0.2 0.6 1.0
0 40 80 120 0 30 60 90 0 20 40 60 0 30 60 90 120
40 60 (a)
(1,1,2)
normalised counts
(a') Na25
L=1, SFz
L=3, SFz
T (K)
(b) Na31
(b')
(0.5,0.5,1) (0.5,0.5,3) (0.5,0.5,5) (0.5,0.5,7)
T (K)
(c)
Na35a (0,0,2)
(c')
T (K)
(d) Na39
(d')
T (K)
(e) Na40
(e')
T (K)
Figure 2.2: Temperature dependence of the nuclear and magnetic Bragg peaks in Ba
1−xNa
xFe
2As
2. In order to define the two magnetic transition temperatures the nuclear (a)-(e) and magnetic (a’)-(e’) Bragg peak intensit- ies were scanned, respectively for Na25, Na31, Na35a, Na39 and Na40. Open symbols in (a’) result from a polarised neutron scattering at 4F1 spectrometer and are rescaled. In particular, the spin reorientation transition in Na25 and Na31 is incomplete as the intensity at L = 3 is stronger or only slightly weaker than at L = 1. The coloured areas correspond to the phases defined in Fig.: 2.1 and the presented data are published in [159].
tering events, which ultimately lead to an intensity decrease of the nuclear Bragg peaks. By this reason the nuclear Bragg peak intensity for Na35a and Na39 drops
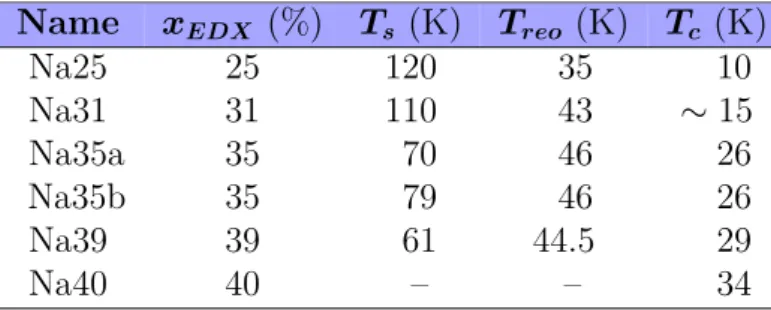
Table 2.1: Transition temperatures of the Ba
1−xNa
xFe
2As
2samples.
The structural and magnetic transitions temperatures rely on the data from Fig.: 2.2, while T
cresults from magnetisation measurements conducted at the IFW.
Name x
EDX(%) T
s(K) T
reo(K) T
c(K)
Na25 25 120 35 10
Na31 31 110 43 ∼ 15
Na35a 35 70 46 26
Na35b 35 79 46 26
Na39 39 61 44.5 29
Na40 40 – – 34
to the continuously extrapolated
3values of the t-PM phase. For Na25 and Na31 the temperature dependence is a bit more complicated, as the intensity originates from a composite effect of the orthorhombic splitting. On the one hand side, the intensity increases below T
sdue to the formation of orthorhombic domains; on the other hand, with decreasing temperature the orthorhombic splitting increases, the fixed Q -position is not the centre anymore, and intensity decreases. Clearly, the latter effect overcompensates the former in Na25. When Na25 and Na31 enter the c-AFM phase, the orthorhombicity is reduced due to the spin reorientation, and the peak intensity increases again. This can be reconciled with the behaviour of Na35a and Na39 by looking at the magnetic Bragg peak intensity of Na25/Na31.
In Na25 the intensity at (0 . 5 , 0 . 5 , 3) is always higher than at (0 . 5 , 0 . 5 , 1), which clearly demonstrates that the spin reorientation is only realised in a small fraction of the sample. Therefore, the intensity reduction of the orthorhombic splitting is compensated by reducing the orthorhombicity itself, while a residual fraction re- mains and thus prevents the recovery of extinction and multiple scattering events.
Ultimately this is the reason for an intensity increase instead of a decrease at T
reo. In Na31 the situation is similar. Here the (0 . 5 , 0 . 5 , 1) magnetic Bragg peak is only marginally more intense than (0 . 5 , 0 . 5 , 3), which demonstrates an incomplete spin reorientation, although the c-AFM volume fraction is larger than in Na25.
A complete spin reorientation would render (0 . 5 , 0 . 5 , 1) ∼ 2 . 7 times more intense than the (0 . 5 , 0 . 5 , 3). However, the most progressed spin reorientation is observed in Na35a, where only a small fraction of 13 % of the o-AFM phase remains [82].
Measuring the temperature dependence of the magnetic Bragg peaks by neutron scattering cannot resolve the issue whether there is a phase separation of o-AFM and c-AFM or the magnetic moments rotate by an arbitrary angle towards the c direction. The latter scenario seems unlikely as a mixture o-AFM and c-AFM phases were directly observed in powder experiments [45, 84] and by symmetry considerations
4. A magnetic configuration where the rotated moments point at an intermediate direction corresponds to a lower symmetry as in either the c-AFM and o-AFM phases. Moreover, in Ba
1−xK
xFe
2As
2the spin reorientation induces an elongation of the FeAs-tetrahedra [46] similar to a martensitic transition
5. Again this fact highlights the strength of MEC and is further the natural explanation of the c-AFM and o-AFM phase separation. In a local picture, the FeAs-tetrahedra elongation causes a shear force on the Fe-Fe-planes, which will stabilise the o-AFM phase. This is evidenced by strain experiments on BaFe
2As
2where T
sshifts to higher temperatures [168]. Therefore, this picture helps to understand why the spin reorientation is only complete in the middle of the c-AFM dome, where the
3constant extrapolation at (1,1,2) and linear at (0,0,2)
4the phase with moments along the c axis cannot be a subgroup of a phase where the moments are aligned within the plane
5first order structural transition. Most famous example is the transition in Fe from non- magneticf ccto magneticbcc.
0.0 0.1 0.2 0.3 0.4 0.5 0.6 0.7 3.84
3.86 3.88 3.90 3.92 3.94 3.96 3.98
0.0 0.1 0.2 0.3 0.4 0.5 0.6 0.7
13.02 13.04 13.06 13.08 13.10 13.12 13.14
Avci et al., PRB 88,
094510 (2013)
Cortes-Gil et al.,
Chem. Mater. 22, 4304 (2010)
a (Å)
Na content x (a)
our work
neutron
X-ray Ba
1-x Na
x Fe
2 As
2
c (Å)
Na content x (b)
300K