Test for English to the CEFR:
The Standard-Setting Process
Technical Documentation – Standards-based Proficiency Test in English, 8
thgrade, 2013
Roman Freunberger Claudia Bazinger
Ursula Itzlinger-Bruneforth
www.bifie.at
Linking the Austrian Standards-Based Test for English to the CEFR: The Standard-Setting Process Technical Documentation – Standards-based Proficency Test in English, 8th grade, 2013
BIFIE I Department Bildungsstandards & Internationale Assessments (BISTA), Salzburg 2013
Der Text sowie die Aufgabenbeispiele dürfen für Zwecke des Unterrichts in österreichischen Schulen sowie von den Pädagogischen Hochschulen und Universitäten im Bereich der Lehrer aus-, Lehrerfort- und Lehrerweiterbildung in dem für die jeweilige Lehrveranstaltung erforderlichen Umfang von der Homepage (www.bifie.at) heruntergeladen, kopiert und verbreitet werden. Ebenso ist die Vervielfältigung der Texte und Aufgabenbeispiele auf einem anderen Träger als Papier (z. B. im Rahmen von Power-Point-Präsentationen) für Zwecke des Unterrichts gestattet.
3 1 General Introduction 4 1.1 The Austrian Level-System
5 1.2 Relevant Standard-Setting Procedures 5 1.2.1 The Contrasting-Groups Method 6 1.2.2 The Bookmark Method
8 1.2.3 The Item-descriptor Matching method (IDM) 8 1.2.4 The Basket method
9 1.3 Familiarisation and Training of the Panelists
11 2 Productive Skills: CEFR-Linking for Writing 11 2.1 Workshop Schedule and Participants
11 2.2 Familiarisation
12 2.3 Script Selection and Rating Process 14 2.4 Definition of Cut-Scores
15 2.5 Conclusion and Final Cut-Scores 16 2.6 Evaluation
17 3 Productive Skills: CEFR-Linking for Speaking 17 3.1 Workshop Schedule and Participants
17 3.2 Familiarisation
17 3.3 Video Selection and Rating Process 19 3.4 Definition of Cut-Scores
20 3.5 Conclusion and Final Cut-Scores 20 3.6 Evaluation
21 4 Receptive Skills: CEFR-Linking for Reading and Listening 21 4.1 Workshop Schedule and Participants
21 4.2 Item Selection
22 4.3 Methodological Considerations 22 4.4 Familiarisation and Training 24 4.5 Standard-Setting Rounds 25 4.6 Rater Analyses
26 4.7 Final Cut-Scores for the Receptive Skills 27 4.8 Evaluation
28 5 Summary and Conclusion 30 References
33 6 Annexes
1 General Introduction
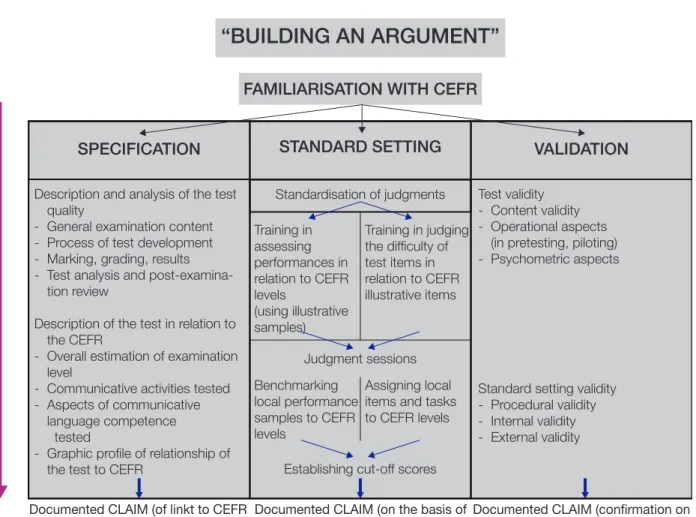
This technical documentation1 provides information on the process of linking the Austrian standards-based proficiency test in English for the 8th grade2 to the Common European Framework of Reference for Languages (CEFR). The imple- mentation of the linking process is primarily based on the suggestions of the manual of the Council of Europe (Council of Europe, 2009). The CEFR-linking process involves – as proposed in the manual – five steps or activities. These steps encompass the whole process of test development and are not necessarily in a hierarchical or chronological order (cf. Figure 1):
1. Familiarisation: This step circumscribes a set of activities for item-writers and standard-setting judges to familiarise with the CEFR and the national standards test. In the standard-setting workshop, it is necessary for participants to share a common knowledge of CEF-levels, information of test and item develop- ment and their task in the standard-setting.
2. Specification: The content analysis of the examination to elaborate a linking claim of how the tests relate to the CEFR. This step needs to be performed prior to the standard-setting and involves internal and external validation of the test.
This process is strongly inherent during item development. We conducted several trials and a pilot study to examine the psychometric quality of the test and its items (details of this process are not part of this technical report).
3. Standardisation training / benchmarking: For standardizing the understanding of CEF-levels and for training of the task required during standard-setting, par- ticipants received several materials, for example, calibrated test-items and bench- mark performances.
4. Standard-setting: The main focus of this report is on the the standard-setting. In general, standard-setting circumscribes a multidisciplinary decision-process en- compassing people from a broad range of professional fields (stakeholders, didac- ticians, test-developers, psychometricians, politicians, teachers, etc.). One thing that all of the standard-setting methods have in common are workshop meetings of expert judges (Cizek & Bunch, 2007; Cizek, Bunch & Koons, 2004). Within these workshops, the judges try to reach consensus about setting cut-off-scores (or cut-scores) between performance levels by application of standardized meth- ods (standard-setting methods). Thus, the primary goal of a standard-setting workshop is to establish cut-scores that enable the allocation of student’s per- formances to discrete performance levels (Cizek & Bunch, 2007; Hartig, 2007).
5. Validation: This phase involves all steps of validating the complete process of CEFR-linking and also the validation of the test itself. With respect to the stand- ard-setting this includes rater-analysis, quantitative and qualitative evaluation of the appropriateness of the cut-scores.
1 A preliminary version of this manuscript was reviewed by Dr. Neus Figueras, Departament d‘Educació, Generalitat de Catalunya, Spain.
2 English as first foreign language only.
Figure 1: CEFR – Linking Framework (Council of Europe, 2009)
1.1 The Austrian Level-System
The Austrian standards test for English as first foreign language assesses the four subskills writing, speaking, listening and reading in three-year intervals. The first nation-wide assessment started in April 2013. In the writing test, students are asked to produce one short (40–70 words) and one long script (120–180 words) in 30 minutes (Gassner, Mewald, Brock, Lackenbauer & Siller, 2011). The speak- ing test is only administered to a sample of eighth grade students in 120 Austrian schools. The students are tested in randomly selected pairs and the tasks include one monologue and two dialogues. The tests for the receptive skills listening and read- ing mainly involve closed-format items3. More detailed information on the item- development process and test specifications can be found in Gassner et al. (2011) and BIFIE and ÖSZ (2011).
3 Sample items can be found on the BIFIE-website: www.bifie.at.
“BUILDING AN ARGUMENT”
FAMILIARISATION WITH CEFR
SPECIFICATION VALIDATION
Description and analysis of the test quality
- General examination content - Process of test development - Marking, grading, results - Test analysis and post-examina-
tion review
Description of the test in relation to the CEFR
- Overall estimation of examination level
- Communicative activities tested - Aspects of communicative
language competence tested
- Graphic profile of relationship of the test to CEFR
Test validity - Content validity - Operational aspects
(in pretesting, piloting) - Psychometric aspects
Standard setting validity - Procedural validity - Internal validity - External validity
STANDARD SETTING
Standardisation of judgments
Judgment sessions
Establishing cut-off scores
Documented CLAIM (on the basis of specification and standardisation) Documented CLAIM (of linkt to CEFR
on the basis of specification)
Documented CLAIM (confirmation on basis of empirical verification) Training in
assessing performances in relation to CEFR levels
(using illustrative samples)
Training in judging the difficulty of test items in relation to CEFR illustrative items
Benchmarking local performance samples to CEFR levels
Assigning local items and tasks to CEFR levels
Recommended procedures encourage alignment of examinations to CEFR at differing degrees of rigour appropiate to different testing contexts and to the extent permitted by resources and expertise available.
For the standard-setting, we followed a compensatory, in contrast to a conjunctive strategy (Haladyna & Hess, 2000) within each language skill. Usually, the reliability of total test-scores is increased in compensatory models under the assumption that the total score best reflects the test construct. As a consequence, the standard-setting was based on the total score metric within the four different language skills, reading, listening, writing, and speaking. Hence, CEFR-linking for subskills within those skills was not being approached.
The Austrian national educational standards for English are primarily based on A2 and B1 descriptors of the CEFR (BIFIE & ÖSZ, 2011, p. 11). As a consequence, a competency model with three levels was proposed with levels A1 or below, A2 and B1 or above. Performance level descriptors (PLDs) were developed by our consultancy groups and the BIFIE for levels A2 and B1 or above. The contents of the PLDs were cross-validated by ditacticians from the BIFIE and external consultants. In regard to the standard-setting workshop, two cut-scores needed to be established, between A1 or below vs. A2 and A2 vs B1 or above.
1.2 Relevant Standard-Setting Procedures
Methods for standard-setting can either be categorized as examinee-centered or test- centered (Kane, 1998)4. Examinee-centered approaches contain the rating of student‘s work (e.g., scripts, dialogues), whereas decision processes within test- centered ap- proaches are focused on the test-items. On the basis of such expert- ratings (either of items or student‘s work), the determination of cut-scores is grounded.
In the Austrian standards-based performance test, we decided to use test-centered approaches to link to the CEFR-levels for the receptive skills reading and listening.
This line of reasoning is simply due to the fact that most of the items used in these domains are closed-format items (e.g., multiple-choice items). For the productive skills writing and speaking, on the other hand, we applied an examinee-centred approach, as student‘s work is directly available.
Based on either examinee- or test-centered approaches, there are different methods to choose from for arriving at cut-scores. The contrasting-groups method is adequate for an examinee-centered approach, whereas the bookmark method, the item- descriptor matching method and the basket method are suitable for a test-centered approach. In the following, these methods are described in more detail.
1.2.1 The Contrasting-Groups Method
As we needed an examinee-centered approach for establishing a cut-score in writing and speaking, we used the contrasting-groups method (Bechger, Kuijper & Maris, 2009; Berk, 1976; Cizek & Bunch, 2007; Council of Europe, 2009). In the simplest case where one cut-off-score has to be determined (e.g., between pass and fail or B1 and B2), the judges are asked to indicate for each piece of student‘s work (e.g., a script) to which of the two groups it belongs to. For example, if a cut-score between B1 and B2 was the goal, the question posed to the judges would be “To which performance level would you assign the student‘s work?“. Each script would thus receive an individual mark from a respective judge (or some judges, depending on the rating design) relat- ing to the respective competence group (B1 vs. B2). Next, two frequency distribu- tions of total test scores, representing either the group members rated B1 or B2, can
4 Kaftandjieva (2010) lists 62 different standard-setting methods, extensive reviews on standard-setting methods are provided by Cizek and Bunch (2007); Cizek et al. (2004); Hambleton (2001, 2000).
be plotted. Figure 2 is adopted from the COE manual and shows hypothetical data of two groups rated B1 and B2, respectively. Here, the judges rated student‘s work on a test where a maximal test score of 50 was possible. Two frequency distributions can be generated representing the two performance groups. As can be seen, the distribu- tions show a clear overlap, this means, some students scoring higher receive a rating belonging to the lower performance group and vice versa. To determine a cut-score, one could calculate the mean of each group distribution and subsequently the mean of these two group means. In this example, a score near 25 would best reflect the cut-score. However, using this score generates misclassifications, as can be seen in the table of Figure 2. For example, 4 students with a test score of 27 were classified as B1 (false positive) and 6 with a score of 23 as B2 (false negative). 19 false negatives (FNs) and 18 false positives (FP) would result in a total of 9.3 % misclassifications.
One primary goal of standard-setting could be to find a cut-score that best reduces the sum of false positives and false negatives and thus the percentage of misclassifica- tions.
It is noteworthy to mention that the method of reducing the total percentage of misclassification to define a cut-score is not appropriate for every testing purpose. It is important to challenge the question of the potential impact of classifying pupils as either false negatives or positives. Alternative approaches for finding the cut- scores are presented in the manual of the COE and also by Bechger et al. (2009).
In our approach, we did not use a special adjustment (e.g., weighting) of cut- scores to control for misclassifications. This means that FNs and FPs were regarded as equally critical. The methods (e.g., ROC, logistic regression) we implemented for the standard-setting of the productive skills, implicitly search for an optimal classification of cut-scores, but we did not a priori define a criterium for reducing either FNs or FPs.
1.2.2 The Bookmark Method
The main feature of the bookmark method, which was used for setting cut-scores for the receptive skills, is an Ordered Item Booklet (OIB), a booklet where all items are arranged in increasing order of their difficulty (Mitzel, Lewis, Green & Patz, 1999;
Mitzel, Lewis, Patz & Green, 2001). This indicates that items that have already been pilot-tested are required for this procedure. Item-difficulty can be derived from concepts of classical test theory as well as item response theory. On every single page of the booklet a single item is depicted. Scale location (i.e., item-difficulty), answer- keys, notes, etc. can be printed additionally along with the item-text.
The bookmark method incorporates the concept of borderline knowledge or border- line persons. The task of the panel members is to imagine a group of pupils at the border of two proficiency levels that would answer a given test-item with a certain chance or probability. Usually, people are asked to imagine a group of pupils that would answer a question in two out of three possibilities, corresponding to a proba- bility of 2/3. This so-called Response Probability (RP) can be defined arbitrarily, but, most critically, the final cut-scores will be affected by the choice of the RP (Wyse, 2011). Hence, it is inevitable that panel members show a clear understanding of the concept of the RP, which has to be considered for training of the participants in the standard-setting workshop.
Figure 2: The contrasting groups method. A) Judges are asked to rate student‘s work as either B1 or B2 performances. Two performance groups, plotted as frequency distributions, result from this rating process. To define a cut-score the midpoint of the two distributions can be calculated re- flected by the mean of both group-means. B) The cut-score defined in A) lies at a test-score value of 24, for example. This cut-score leads to 19 false negatives (FNs) and 18 false positives (FP) and a total of 9.3 % misclassifications. Figure adapted from the COE manual.
A)
B)
0 0 5 10 15 20 25
5 10 15 20 25 30 35 40 45 50
frequency
testscore
‘B1’
‘B2’
Mean 1 Mean 2
Mean [Mean1, Mean2] = CUT SCORE
False Positive False Negative ∑ = 19
∑ = 18
Test Score Score
0–20 21 22 23 24 25 26 27 28–50
FP + FN = 37
37/400*100 = 9.3 % misclassified 63
5 1 1 0 4 1 4 9
9 2 2 6 8 14 16 8 247
B1 B2
Expert Judgement
CUT SCORE
If panelists are asked to set a cut-score between level A1 and A2, they work through the OIB, constantly answering the question whether a minimally-qualified person (at the border between the two levels) would show a correct response in 2 out of 3 cases (RP = 2/3). If the goal is to establish a cut-score between level A1 and A2, the question asked to the panel members is “Can a borderline student – between A1 and A2 – answer this item correctly in 2 out of 3 cases?“. If the answer is yes on a single item, they proceed to the next item, if the answer is no, the panel members place a bookmark on the previous item, that is, the last item that the student could master.
Note that in some procedures, as it was the case for this standard-setting, the book- mark is placed on the first item that the borderline student could not give a correct response to (and strictly speaking, the bookmark would be between the last item a student could master and the first item he could not master, Cizek & Bunch, 2007).
Regardless of the instructions, it is important to make it clear to the participants of the standard-setting, that up to this bookmark-item a border line student would answer the items correctly with the respective RP (or higher). After the bookmark is placed for a certain cut-point, the panelists move on to the next cut-score region.
Usually, cut-scores (or bookmarks) are set in two to three consecutive rounds, between the rounds, feedback is provided to the panel members. Feedback includes descriptive statistics of cut-score placements and frequency distributions of perform- ance data (impact data).
An advantage of the bookmark method is the relatively simple task, on the other hand, the concept of the RP is sometimes not easily understood and requires some time for training (Karantonis & Sireci, 2006).
1.2.3 The Item-descriptor Matching method (IDM)
The IDM is very similar to the bookmark method. But the full understanding of the concept of a response probability is not a necessary requirement for panel members to perform the task (Ferrara, Perie & Johnson, 2002). It has to be noted that the concept of the RP is relevant during calibration of items, but it is not for undergoing the task. The task in the IDM is to rate every item by matching the cognitive demands of an item that are relevant for a correct solution to the descriptions of the perform- ance levels. Hence, it is not relevant to imagine a group of students handling the item demands in 2 out of 3 cases.
The items are also presented in OIBs, ordered by increasing item difficulty. The task for the participants is usually to match items to the performance levels. The IDM is easy to implement and the cognitive load for a panel member to undergo this task is manageable. Otherwise, the evaluation of the ratings is not straight forward and bears some technical as well as practical problems (e.g., the concept of the threshold regions, Cizek & Bunch, 2007). A modified version of the IDM was also implemented for the Mathematics standard-setting (Freunberger, 2013).
1.2.4 The Basket method
The question asked to the panel members in the Basket method is “At what CEFR level can a test taker already answer the following item correctly?“ The task is quite similar to the task in the IDM, whereas in the Basket method no difficulty-ordering of the items takes place (Kaftandjieva, 2010). Each item is placed in a basket that relates to a specific CEFR level. For example, items in basket A2 should be answered correctly by students at (or above) performance level A2.
Given that the difficulty-ordering of items (along with the numerical item- difficulties) in the IDM method can easily confuse participants of standard-setting workshops, it is advisable to not present items in an ordered-item-booklet or at least to omit the numerical values of item-difficulties (Council of Europe, 2009). Thus, the basket-method seems a very easy-to-implement method, but in its application, it is also one of the most lenient methods. For example, the cut-scores between each performance level are calculated by summing up the number of items put in the respective baskets. If there are four items in the level-1-basket and six in the level- 2-basket, the cut-score between level 2 and level 3 would be the sum of basket one and two (4 + 6 = 10 items). A student on level 3 should at least answer 11 (10 + 1) items correctly. Hence, this method provides minimal-standards for each level. But, a student on level 3 is probably also able to answer some questions on higher levels.
So, this method considers minimal requirements only. Another problem arises if no items are placed in some of the baskets. In such a case, no cut-scores can be set between certain levels.
According to Kaftandjieva (2010), some of the main advantages of the method are:
Its economic use because of usually only one round of judgment; its simplicity; it does not require complex statistical analyses for setting cut-scores; its wide range of applicability; its clear interpretability; and it can be applied prior to test admin- istration. Because it does not incorporate empirical test data, this can be equally regarded as disadvantage. This means that there exists no link between empirical item-difficulty and judgements made by the panelists (which usually should be taken into account as validity argument).
Alternatives to the Basket method are the Compound Cumulative method and the Cumulative Cluster method. Both methods are similar in their judgment processes but the calculations of the cut-scores are more complex and they both take empirical data into account, which increases the validity of these methods as compared to the original Basket method.
1.3 Familiarisation and Training of the Panelists
Familiarisation refers to the process where judges become familiarised with the CEFR, training is more related to the rating process of the standard-setting. This phase will generally be similar for productive and receptive skills, although several modifications are specific for certain skills (e.g., rating of videos for speaking, rating of scripts for writing).
The familiarisation activities, suggested in the manual, are presented in four main categories from which we chose the following, with some modifications tailored to our test-purposes (see the Appendix for exemplary activities and tasks performed during the familiarisation phase):
1. Preparatory activities before the seminar:
Material was sent to participants five weeks prior to the workshops. This included section 3.6 of the CEFR, a link to the CEFTrain website5 and some instruction for familiarising with the CEFR. The training on the CEFTrain homepage inclu- ded scale training (e.g., ‘ball game’) and assessment training (rating of texts and vi- deos). With respect to section 3.6. of the CEFR manual, participants were asked to elaborate the differences among the CEFR-descriptors.
5 http://www.helsinki./project/ceftrain
2. Introductory activities at the seminar:
A brief introduction was given on the CEFR in general, presenting its main fea- tures, and most activities mentioned in point 1 above were repeated in this phase.
A brief discussion on salient features of CEFR levels was included and partici- pants were asked to assign a set of different PLDs selected from several scales to the CEFR levels. The participants also received aggregated feedback on rating performances as basis for further discussions.
3. Qualitative activities of the CEFR scales:
The relevant CEFR descriptors were discussed for the test under consideration and for the respective dimensions.
4. Preparation for rating: productive skills.
Ratings on exemplar scripts or videos had to be performed. For example, for wri- ting, several scripts (from the COE or DIALANG homepages) had to be judged.
Participants made use of can-do- statements (CDS) for A2 and B1. They rated a set of five scripts by using A2 CDS and set of three scripts by using the B1 CDS.
The 6 CDS for writing and speaking were developed by our consultancy team and should best cover the Austrian standards test. For speaking, four videos (two for each level, downloaded from the CIEP – Centre international d‘études péd- agogiques – homepage6) had to be rated using either A2 or B1 CDS developed for the speaking standard-setting.
5. Preparation for rating: receptive skills.
Participants had to rate items according to the descriptors. The standard-setting method was explained and ratings on exemplar items from the national standards test had to be performed.
6 http://www.ciep.fr
2 Productive Skills:
CEFR-Linking for Writing
2.1 Workshop Schedule and Participants
The CEFR-linking workshop for writing took place at the BIFIE Salzburg from 5th–7th of November 2012. One half-day was spent with a familiarisation phase, the rest of the workshop time was spent on judging of students’ performances and discussions. The group of expert judges consisted of 14 people with professional back- ground in the fields of language testing, teaching and psychometrics. The most strongly represented expert’s group (7 persons) was teacher trainers (e.g. lecturer at college of education). 4 out of 7 participants were teachers at schools, 2 participants had a profes- sional background solely as teachers, and 2 participants were employees from the BIFIE.
More than half of the respondents had an additional occupation within the framework of educational standards in Austria or were involved in test development. More details on participants’ background can be found in (Zuber, in press). The workshop language was English.
2.2 Familiarisation
The familiarisation phase was supervised and conducted by our external consultants, Otmar Gassner and Rainer Brock, all materials and analyses were provided by the local organizers. Prior to the workshop meeting, participants received training activities that included working on the CEFtrain homepage. During the workshop the first half-day was spent on familiarising with the CEFR. This included a presentation to the CEFR with specific emphasis on the scales for writing, training activities and group discus- sions. Five different familiarisation activies helped to maximise the degree of familiar- ity with the CEFR and prepared participants for the task of the standard-setting.
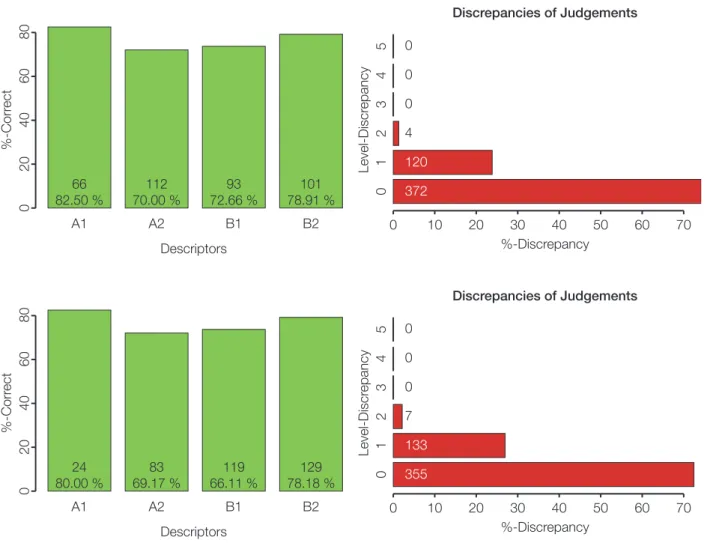
To evaluate the degree of familiarity with the CEFR-scales, two training activities asked for assigning CEFR-levels to performance descriptors selected from different writing scales. The ratings were then evaluated by local organizers and the results presented to the expert-panel. Two additional activities focused on the rating of 8 sample scripts, and specific emphasis was put on the distinction between levels A1, A2 and B1. Then, the standard-setting rating task was introduced and trained with the sample scripts. The results from the second training activity (assignment of CEFR-levels to descriptors) are shown in Figure 3 and Figure 4.
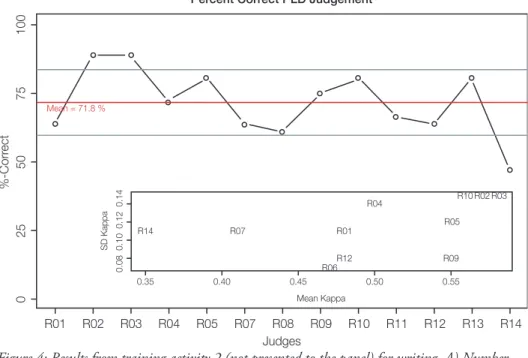
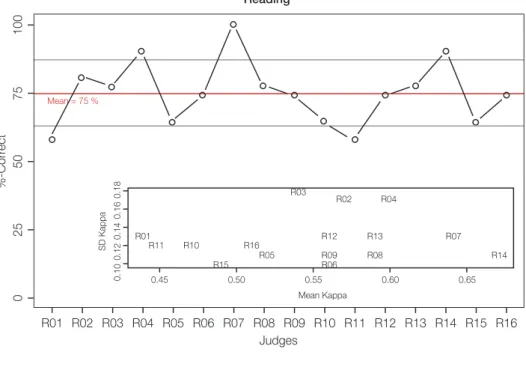
Figure 3 shows two plots that were also presented for feedback within the familiari- sation phase. Here, the group performance is shown, whereas in Figure 3 (left) the correct assignment per level is depicted, Figure 3 (right) provides information about discrepant rating behaviour (i.e., when an A2 descriptor is rated as A1 or B1, this results in a discrepancy of 1). Both figures show that the group performance was high, especially for A1 descriptors (85.9 % correct assignment). Figure 4 was not pre- sented as feedback to the panel members, it provides information of rating behaviour for each judge with average correct assignments of 71.8 %. Figure 4 (inlet) shows mean Kappa-coefficients for each judge contrasted with the standard deviations. A low mean value indicates low agreement of one judge with all the other judges.
The scatter-plot contrasts mean-Kappas with their standard-deviations (SDs). A low mean-Kappa value and a low SD would indicate anomalous rating behaviour, where a respective judge would consistently disagree with the group.
Figure 3: Results from training activity 2 (presented to the panel) for writing. Number of correct assignments per CEFR-level (left) and level-discrepancies (right).
2.3 Script Selection and Rating Process
We used the contrasting-groups method (described above) to determine cut-scores.
The experts’ task was to judge 120 scripts produced by students in a pre-pilot trial in two consecutive rating rounds. Each student received two writing tasks, one aiming at level A2 (short prompt) and one aiming at level B1 (long prompt). The scripts were separately scaled by using many-facet Rasch measurement (Eckes, 2011;
Linacre, 1994) and scores were transformed onto the PISA score metric with a mean of 500 and a standard-deviation of 100. We chose to use the PISA score metric as participants were more familiar with this metric than with the traditional Rasch logit metric.
For the cut-score A1/A2, judges rated 60 scripts (from 3 short prompts and 1 long prompt) by using 6 can-do-statements (CDS, cf. Table 1). Each statement had to be answered with Yes or No. The ratings of the videos (in speaking) and scripts (writing) were performed online using a web-based computer software (see the Appendix for an example). The script performances were selected in a way that lower performances were over-represented. In a second round, judges were asked to rate another set of 60 scripts (from 3 long-prompts) using CDS for B1 (Table 1). Here, we selected scripts with performances that spread evenly across the proficiency scale, with a slight over- representation of higher performances.
Descriptors
A1 A2 B1 B2 C1 C2
67 85.90 %
80 68.38 %
57 73.08 %
50 76.92 %
38 58.46 %
44 67.69 %
02040%-Correct Level-Discrepancy
%-Discrepancy Discrepancies of Judgements
0
0 10 20 30 40 50 60 70
0 1 0 8 123 336
12345
6080
Figure 4: Results from training activity 2 (not presented to the panel) for writing. A) Number of correct assignments per judge (red line represents the group mean, grey lines the standard- deviation). B) Mean-Kappa (top) and mean-Kappa contrasted with standard-deviations (bot- tom) per judge.
Table 1: Can-do-statements for writing used in the contrasting-groups method.
Percent Correct PLD Judgement
R01 R02 R03 R04 R05 R07 R08 R09 R10 R11 R12 R13 R14 02550%-Correct 75100
Judges
SD Kappa 0.08
0.35
R14 R07 R01
R06R12
R04 R10 R02 R03
R05
R09
0.40 0.45 0.50 0.55
0.100.120.14
Mean Kappa Mean = 71.8 %
A2 B1
1 Can write a series of simple phrases and sentences about their family, living conditions, educational background, events, past activi- ties and personal experiences.
Can write straightforward, detailed texts on a range of familiar subjects.
2 Can expand learned phrases through simple recombinations of their elements and commu- nicate simple information.
Can convey simple, straightforward infor- mation and exploit a wide range of simple language flexibly to express much of what he/
she wants.
3 Can link groups of words and simple senten- ces with simple connectors like „and“, „but“
and „because“ and possibly other frequently occurring connectors.
Can link a series of shorter, discrete simple elements into a connected, linear sequence of points.
4 Has a (limited) repertoire of basic language and sentence patterns, which enables him/
her to deal with simple everyday situations with predictable content, though he/she will generally have to compromise the message.
Has enough language to get by, with some restrictions, but lexical and structural limita- tions may cause repetition and even difficulty with formulation at times.
5 Uses some simple structures correctly, but (may) still systematically make basic mistakes;
nevertheless, it is usually clear what he/she is trying to say.
Uses a generally sufficient range of structures correctly and communicates with reasonable accuracy. Errors may occur, but it is mostly clear what he/she is trying to express.
6 Can control a sufficient vocabulary for the expression of basic communicative needs and can cope with simple survival needs.
Can control a sufficient vocabulary to express him/herself on most topics pertinent to his/her everyday life. Spelling is accurate enough to be followed most of the time.
2.4 Definition of Cut-Scores
For each student‘s performance (script) we yielded 6 ratings (yes-no-statements for each CDS) per judge (cf. Table 1). The next step was to define a criterion that allowed us to classify a student‘s performance – on basis of the CDS ratings – as either being an A2 performance or not (in case of the first cut-score). From our ratings, we calculated the sum across ratings for each judge; a certain script can thus have a maximum score of 6 (all CDS were endorsed) and a minimum score of 0 (no CDS was endorsed). These steps were performed after the workshop due to time constraints, and therefore, cut-scores and impact data were not reported to the participants.
The sum scores were then categorized into 2 categories: scripts with sum scores between 0 and 3 were defined as being below the respective CEFR-level (e.g., be- low A2, below B1), scripts with sum scores between 4 and 6 were defined as being performances at a respective level (e.g., at A2 or at B1). The categorization was per- formed on a sinlge-judge-level.
To define cut-scores on the proficiency scale, we applied three different procedures:
(i) midpoint analysis, (ii) logistic regression, and (iii) receiver operator character- istics. The midpoint-procedure (Cizek & Bunch, 2007) is easy to implement and the cut-score is defined as the mean of the two group means from the two proficiency distributions (e.g. A2 vs. not-A2).
Logistic regression can be used to determine the point of intersection of two distri- butions (Cizek & Bunch, 2007, p.109). The common definition of logistic regres- sion enables to find a score point where the probability of belonging to a certain category is p = .50 (Gelman & Hill, 2007; Sireci & Clauser, 2001). This is given as
where p is the probability of belonging to category k and x is the cut-score. After estimating the regression coefficients α and β the equation can be solved for x which yields the cut-score, i.e., the intersection point of the two group distributions. If we assume a probability of p = 0.50, ln( ) = ln(1) = 0, so x = which is the point where above that score the likelihood of belonging to the category (e.g. A2 vs. A1) is higher than 50 %.
Receiver operating characteristics (ROC) graphs are mainly used in medical research for optimal decision making in diagnostic testing (Fawcett, 2006; Kaftandjieva, 2010). A ROC graph usually contrasts the true positive rate with the false positive rate and provides information about the optimal score that best controls for false positives and true positives. We adopted this method for every single judge in a way that every latent score could reflect a potential cut-score. As we used 60 scripts, we could gain 60 different cut-scores. For example, the method selects a potential cut- score and calculates the true positive rate (e.g., scripts rated as being at A2 and also classified by that cut-score as A2) and false positive rate (e.g., scripts rated as being below A2 and classified by that cut-score as A2). The true positive rate is usually termed sensitivity and the false positive rate 1-specificity. The area under an ROC curve (AUC) gives an index of the performance of a certain classifier (i.e, the quality of the judgements). To find the optimal cut-score we used the Youden index imple- mented in the R-package pROC (R Core Team, 2012; Robin et al., 2011). Figure 5 shows ROC curves for one rater and for both cut-scores.
2.4 Definition of Cut-Scores
For each student’s performance (script) we yielded 6 ratings (yes-no-statements for each CDS) per judge (cf. Table 1). The next step was to define a criterion that allowed us to classify a student’s performance—on basis of the CDS ratings—as either being an A2 performance or not (in case of the first cut-score). From our ratings, we calculated the sum across ratings for each judge, a certain script can thus have a maximum score of 6 (all CDS were endorsed) and a minimum score of 0 (no CDS was endorsed). These steps took place only after the workshop due to time constraints, and therefore, cut-scores and impact data were not reported to the participants.
The sum scores were then categorized into 2 categories: scripts with sum scores between 0 and 3 were defined as being below the respective CEFR-level (e.g., below A2, below B1), scripts with sum scores between 4 and 6 were defined as being performances at a respective level (e.g., at A2 or at B1). The categorization was performed on a sinlge-judge-level.
To define cut-scores on the proficiency scale, we applied three different procedures: (i) midpoint analysis, (ii) logistic regression, and (iii) receiver operator characteristics:
The midpoint-procedure (Cizek & Bunch, 2007) is easy to implement and the cut-score is defined as the mean of the two group means from the two proficiency distributions (e.g.
A2 vs. not-A2).
Logistic regression can be used to determine the point of intersection of two distributions (Cizek & Bunch, 2007, p.109). The common definition of logistic regression enables to find a score point where the probability of belonging to a certain category is p=.50 (Gelman
& Hill, 2007; Sireci & Clauser, 2001). This is given as ln( pk
1−pk) =α+βx, (1)
where p is the probability of belonging to category k and x is the cut-score. After es- timating the regression coefficients αand β the equation can be solved forx which yields the cut-score, i.e., the intersection point of the two group distributions. If we assume a probability of p= 0.50, ln(1−0.50.5) =ln(1) = 0, so x = αβ which is the point where above that score the likelihood of belonging to the category (e.g. A2 vs. <A2) is higher than 50%.
Receiver operating characteristics (ROC) graphs are mainly used in medical research for optimal decision making in diagnostic testing (Fawcett, 2006; Kaftandjieva, 2010). A ROC graph usually contrasts the true positive rate with the false positive rate and provides in- formation about the optimal score that best controls for false positives and true positives.
We adopted this method for every single judge in a way that every latent score could reflect a potential cut-score. As we used 60 scripts, we could gain 60 different cut-scores.
For example, the method selects a potential cut-score and calculates the true positive rate (e.g., scripts rated as being at A2 and also classified by that cut-score as A2) and false positive rate (e.g., scripts rated as being below A2 and classified by that cut-score as A2). The true positive rate is usually termed sensitivity and the false positive rate 1-specificity. The area under an ROC curve (AUC) gives an index of the performance of a certain classifier (i.e, the quality of the judgements). To find the optimal cut-score we used the Youden index implemented in the R-package pROC (R Core Team, 2012; Robin et al., 2011). Figure 5 shows ROC curves for one rater and for both cut-scores.
13 2.4 Definition of Cut-Scores
For each student’s performance (script) we yielded 6 ratings (yes-no-statements for each CDS) per judge (cf. Table 1). The next step was to define a criterion that allowed us to classify a student’s performance—on basis of the CDS ratings—as either being an A2 performance or not (in case of the first cut-score). From our ratings, we calculated the sum across ratings for each judge, a certain script can thus have a maximum score of 6 (all CDS were endorsed) and a minimum score of 0 (no CDS was endorsed). These steps took place only after the workshop due to time constraints, and therefore, cut-scores and impact data were not reported to the participants.
The sum scores were then categorized into 2 categories: scripts with sum scores between 0 and 3 were defined as being below the respective CEFR-level (e.g., below A2, below B1), scripts with sum scores between 4 and 6 were defined as being performances at a respective level (e.g., at A2 or at B1). The categorization was performed on a sinlge-judge-level.
To define cut-scores on the proficiency scale, we applied three different procedures: (i) midpoint analysis, (ii) logistic regression, and (iii) receiver operator characteristics:
The midpoint-procedure (Cizek & Bunch, 2007) is easy to implement and the cut-score is defined as the mean of the two group means from the two proficiency distributions (e.g.
A2 vs. not-A2).
Logistic regression can be used to determine the point of intersection of two distributions (Cizek & Bunch, 2007, p.109). The common definition of logistic regression enables to find a score point where the probability of belonging to a certain category is p=.50 (Gelman
& Hill, 2007; Sireci & Clauser, 2001). This is given as ln( pk
1−pk) =α+βx, (1)
where p is the probability of belonging to category k and x is the cut-score. After es- timating the regression coefficients αand β the equation can be solved forx which yields the cut-score, i.e., the intersection point of the two group distributions. If we assume a probability of p = 0.50, ln(1−0.50.5) =ln(1) = 0, so x = αβ which is the point where above that score the likelihood of belonging to the category (e.g. A2 vs. <A2) is higher than 50%.
Receiver operating characteristics (ROC) graphs are mainly used in medical research for optimal decision making in diagnostic testing (Fawcett, 2006; Kaftandjieva, 2010). A ROC graph usually contrasts the true positive rate with the false positive rate and provides in- formation about the optimal score that best controls for false positives and true positives.
We adopted this method for every single judge in a way that every latent score could reflect a potential cut-score. As we used 60 scripts, we could gain 60 different cut-scores.
For example, the method selects a potential cut-score and calculates the true positive rate (e.g., scripts rated as being at A2 and also classified by that cut-score as A2) and false positive rate (e.g., scripts rated as being below A2 and classified by that cut-score as A2). The true positive rate is usually termed sensitivity and the false positive rate 1-specificity. The area under an ROC curve (AUC) gives an index of the performance of a certain classifier (i.e, the quality of the judgements). To find the optimal cut-score we used the Youden index implemented in the R-package pROC (R Core Team, 2012; Robin et al., 2011). Figure 5 shows ROC curves for one rater and for both cut-scores.
13
__ α β ____1–050,5 α __ β ____1–050,5
Figure 5: ROC (Receiver Operating Characteristics) curves for one rater. The cut-scores are repre- sented as the optimal coordinates reflecting maximal sensitivity and specificity. The AUC provides information about the rating quality.
Figure 6 depicts the overall cut-scores (i.e., averages over all judges with standard- errors) comparing the three different methods. A repeated measures ANOVA with factors method (log. regression, midpoint analysis, ROC) and cut-score (two cut- scores) was applied to compare the different methods. Results showed significant effects for factors method (F(2,24) = 13.30; p < .01) and cut-score (F(1,12) = 409.16;
p < .001) and a significant method x cut-score interaction (F(2,24) = 26.79; p < .001).
Figure 6: Average cut-scores with standard errors for three different analysis approaches.
0 20 40 60 80 100
020406080100
100 – Specificity (%)
Sensitivity (%)
Cut-Score 1 500.3 (87.0 %, 89.2 %)
AUC: 91.2 %
0 20 40 60 80 100
020406080100
100 – Specificity (%)
Sensitivity (%)
Cut-Score 2
554.1 (79.3 %, 78.6 %)
AUC: 85.9 %
600 500 400 300 200 100
0
Log. Regression Midpoint-Analysis ROC-Methode
A1 or below / A2 A2 / B1 or above
2.5 Conclusion and Final Cut-Scores
A major issue in discussing the most adequate procedure for cut-score determina- tion is the concept of misclassifications (cf. section 1.2.1). Especially in large-scale assessments where stakeholders would like to initiate washback-effects, the standards should be more conservative and in consequence more stringent. Also, the main fo- cus of the Austrian national educational standards is system monitoring and school development, and, hence not single student competency diagnostics. Thus, we pref- erentially apply a method that equally weighs types of misclassifications. The logistic regression approach seems here the most adequate method, as well as the midpoint- analysis. Logistic regression is frequently used in the contrasting groups method and highly accepted, therefore the cut-scores obtained from this procedure define the cut-scores for English writing. But, it has to be noted that since the use of differ- ent methods yielded highly different cut-scores (see section 2.4), the outcomes of standard-settings must be treated very cautiously.
By using the cut-scores from the logistic regression approach, the cut-score between A1 or below and A2 is 464.46 and the cut-score between A2 and B1 or above is 559.67. Cut-scores (and also impact data) could not be presented to the participants because cut-scores were calculated after the workshop meeting.
2.6 Evaluation
For every standard-setting process, evaluation is important to check whether partici- pants understood the task, had comments for improving the process or were unsure about the results (Morgan & Perie, 2004; Raymond & Reid, 2001). For this, participants received several questionnaires during the process; we report only the most important and notable results. A detailed evaluation report about the standard- setting process can be found in Zuber (in press).
Regarding necessary prerequisites before the actual rating-rounds, most participants were familiar with the CEFR, and most of them were confronted with it in their jobs, which is a good prerequisite for the standard-setting. All participants thought that the familiarisation phase was helpful for the method as well as for the process.
The feedback after the workshop was favorable in general, and some participants made suggestions for future workshops: One person remarked that more discussion phases during the rating process would have been helpful, another one asked for impact data and feedback.
3 Productive Skills:
CEFR-Linking for Speaking
3.1 Workshop Schedule and Participants
The CEFR-linking workshop for speaking took place at the BIFIE Salzburg from 4th–6th of December 2012. Regarding the background of the participants, 7 persons were teacher trainers (e.g., lecturer at college of education), 3 were teachers at schools.
2 participants had a professional background solely as teachers. 4 participants worked at research institutions. 3 persons also participated in the writing workshop. The workshop language was English.
3.2 Familiarisation
The familiarisation phase was supervised and conducted by external consultants, Claudia Mewald and Fiona Lackenbauer. All materials and analyses were provided by the local organizers. Prior to the workshop meeting, participants received train- ing activities that included working on the CEFtrain homepage. During the work- shop the first half-day was spent on familiarising with the CEFR. This included a presentation to the CEFR with special emphasis on the scales for speaking, training activities and group discussions. As for writing, there were five different familiarisa- tion activies in order to establish the degree of familiarity with the CEFR and to prepare partici pants for the procedure of the standard-setting. Three training activi- ties asked for assigning CEFR-levels to performance descriptors selected from dif- ferent speaking scales. The ratings were then evaluated by local organizers and the results presented to the participants. An additional activity focused on the rating of 4 sample videos, specific emphasis was put on the distinction between levels A1, A2 and B1. These videos included non-native students speaking about various topics in English, and were therefore similar to those in the standard-setting itself. Discussion among the participants concentrated on the distinction of the CEFR-levels. Then, the standard-setting rating task was introduced here and trained with these videos.
The results from the second training activity (assignment of CEFR-levels to descrip- tors) are shown in Figure 7 and Figure 8.
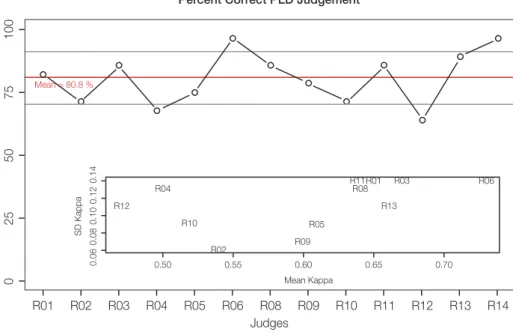
Figure 7 shows two plots that were also presented for feedback within the familiarisa- tion phase, similarly to the feedback in writing (section 2.2). In Figure 7, the group performance is shown, as well as the correct assignment per level is depicted, and in addition, it provides information about discrepant rating behaviour (i.e., when an A2 descriptor is rated as A1 or B1, this results in a discrepancy of 1). Both figures show that the group performance is generally high. Figure 8 was not presented as feedback to the panel members. Figure 8 provides information of rating behaviour for each judge with average correct assignments of 80.8 %. Figure 8 (inlet) shows mean Kappa-coefficients contrasted with the standard-deviations.
3.3 Video Selection and Rating Process
We used the contrasting-groups method (described above) to determine cut-scores.
The experts‘ task was to judge 44 videos of students’ performances, recorded in a pre-pilot trial, in two consecutive rating rounds. The selection of the videos ensured to enable an overview of the proficiency scale. The performances were scaled by using
many-facet Rasch measurement (Eckes, 2011) and scores were transformed onto the PISA score metric with a mean of 500 and a standard-deviation of 100.
For the cut-score <A2/A2, judges rated 22 videos by using 6 can-do-statements (CDS, cf. Table 2). Each statement had to be answered with Yes or No. Similarly to writing, the ratings of the videos were performed online using a web-based computer software. The video performances were selected in a way that lower performances were over-represented. In a second round, judges were asked to rate another set of 22 videos using CDS for B1 (Table 2). Here, we selected videos with performances that were evenly spread across the proficiency scale, with a slight over-representation of higher performances.
Figure 7: Results from training activity 2 (presented to the panel) for speaking. Number of correct assignments per CEFR-level (left) and level-discrepancies (right).
Figure 8: Results from training activity 2 (not presented to the panel) for speaking. Number of correct assignments per judge (red line represents the group mean, grey lines the standard-devia- tion). The inlet shows mean-Kappas contrasted with standard-deviations per judge.
Descriptors
A1 A2 B1 B2 C1 C2
21 80.77 %
85 81.73 %
93 89.42 %
47 90.38 %
24 61.54 %
24 61.54 %
02040%-Correct Level-Discrepancy
%-Discrepancy Discrepancies of Judgements
0
0 20 40 60 80
0 0 0 8 62 294
12345
6080
Percent Correct PLD Judgement
R01 R02 R03 R04 R05 R06 R08 R09 R10 R11 R12 R13 R14 02550%-Correct 75100
Judges
SD Kappa 0.06 0.50
R12 R04
R05 R02
R10
R09
R11R01 R03 R08
R13
R06
0.55 0.60 0.65 0.70
0.080.100.120.14
Mean Kappa Mean = 80.8 %
Table 2: Can-do-statements for speaking used in the contrasting-groups method.
3.4 Definition of Cut-Scores
For each of the 44 videos (22 for each cut-score) we yielded 6 ratings (yes-no-state- ments for each CDS) per judge (cf. Table 2). We followed a similar procedure as we did in writing for establishing whether a video would be classified at a certain level: we calculated the sum across ratings for each judge – a video could have a score ranging from 0 to 6, then the sum scores were categorized into 2 categories:
videos with sum scores between 0 and 3 were defined as being below the respective CEFR-level (e.g., below A2, below B1), videos with sum scores between 4 and 6 were defined as being performances at a respective level (e.g., at A2 or at B1). The categorization was performed on a single-judge-level. As in writing, these steps took place after the workshop, therefore, cut-scores and impact data were not reported to the participants.
To define cut-scores on the proficiency scale, we used the aforementioned midpoint analysis (i.e., calculating the mean of the two groups mean, see Figure 2). For this, we applied the procedure for every judge, and calculated a mean cut-score from these individual scores. For determining the cut-scores for speaking, we proposed two other methods (i.e., logistic regression and receiver operator characteristics).
While it is important to consider alternative approaches, the number of videos in this standard-setting was rather small due to time-constraints (22 videos per cut-score), leaving logistic regression and receiver operator characteristics as rather unjustified choices due to the small number of ratings per judge. As the midpoint analysis is presented in the COE manual (Council of Europe, 2009), is easy to apply and also easily communicated to the public, this method was selected.
A2 B1
1 Can communicate limited information in a
simple list of points. Can convey simple, straightforward informati- on as a linear sequence, getting across main points comprehensibly.
2 Can use simple questions to start, maintain,
or end conversations. Can initiate, maintain and close simple face- to-face conversations.
3 Can make himself understood in short contri- butions despite very noticeable hesitation and false starts.
Can keep going in longer stretches with some pausing for grammatical and lexical planning and repair.
4 Pronunciation is generally clear enough to be
understood despite a possible foreign accent. Pronunciation is clearly intelligible even if a foreign accent is sometimes evident and occasional mispronunciations occur.
5 Can use basic sentence patterns and a reper- toire of basic phrases, groups of words and formulae. He/she may have to compromise the message and search for words.
Has sufficient language to express himself/
herself with some hesitations and circumlo- cutions, but lexical or structural limitations may cause repetition and even difficulty with formulation at times.
6 Can control a narrow repertoire of simple structures and vocabulary correctly, but still systematically makes basic mistakes. The message is usually clear.
Can control a repertoire of simple structures and vocabulary with reasonable accuracy.
Errors may occur, but the message is clear.
3.5 Conclusion and Final Cut-Scores
As already mentioned (see section 2.5), the focus of the Austrian national educa- tional standards test is on system monitoring and school development rather than diagnostics of single student competencies, therefore, we used a method that equally weighs different types of misclassifications. The midpoint-analysis (unweighted for misclassifications) seems an adequate method here, therefore, the cut-scores obtained from this procedure defined the cut-scores for speaking. However, it has to be noted that the alternative methods are possible, that could lead to different cut-scores (see section 2.4).
By using the cut-scores from the midpoint analysis the cut-score between A1 or below and A2 is 468.60 and the cut-score between A2 and B1 or above is 550.70.
3.6 Evaluation
Similarly to writing, participants received several questionnaires during the process;
we report only the most important and notable results, more details can be found in the evaluation report (Zuber, in press).
All participants reported to be familiar with the CEFR in general as well as with the specific levels A1-B2. All participants reported that their job required a general or even more a specific knowledge of the CEFR. Moreover, all but one participant were familiar with the CEFR linking process prior to the standard-setting workshop.
Again, most participants thought that the familiarisation phase was helpful for the method as well as for the process. The feedback after the workshop was favorable, with only minor suggestions for improvement.
4 Receptive Skills: CEFR-Linking for Reading and Listening
4.1 Workshop Schedule and Participants
For the receptive skills reading and listening a four-day workshop meeting (two days were assigned for each skill) was organised at the BIFIE Salzburg from 20th–23rd of November 2012. One half-day was spent with familiarisation, the rest of the workshop time was spent on rating and discussing items. The first half of the work- shop was spent on reading, the second half on listening. Both skills required the rating of items and for both skills, we conducted the standard-setting in 4 rating rounds. Between each round, different feedbacks were given and group discussions were engaged. The group of expert judges consisted of 16 people with professional background in the fields of language testing, teaching and psychometrics, 3 persons also participated in the standard-setting for writing. The most strongly represented group (7 persons) is teacher trainers, 2 participants also work as teachers at school.
4 participants are employees at the BIFIE. More than half of the respondents have an additional occupation within the framework of educational standards in Austria or are involved in test development (see Zuber, in press). One person had to leave early and is thus not included in the data for listening. The workshop language was English.
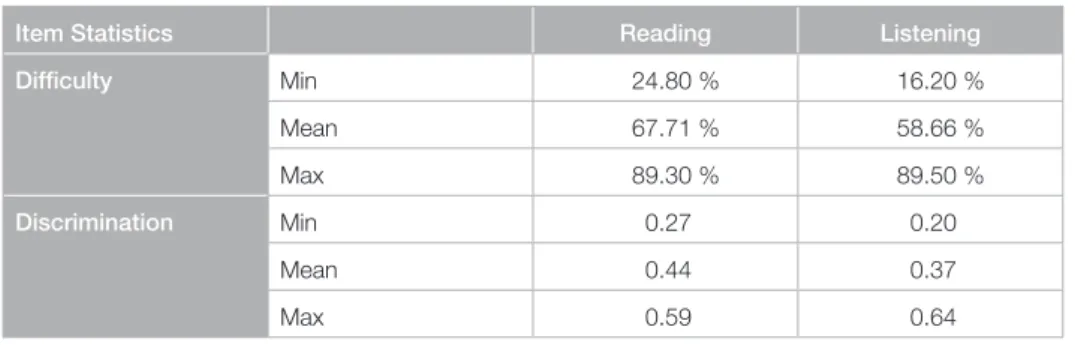
Table 3: Item quality of the selected item-pool.
4.2 Item Selection
The reading and listening items were calibrated using the Rasch-model (Rasch, 1960), and values were subsequently transformed onto the PISA-metric with a mean of 500 and a standard-deviation of 100.
For both skills 80 items were selected, descriptive statistics of item quality are pre- sented in Table 3. For item-selection, the following criteria were defined (see also Harsch, Pant & Köller, 2010):
Only items with good psychometric quality (e.g., discrimination indices, difficulty indices) were considered.
Empirical item difficulty should be spread evenly across the latent scale.
All item formats should be represented (one item format was not included due to incompatible characteristics with the standard-setting method).
Good coverage of the test-construct.
Item Statistics Reading Listening
Difficulty Min 24.80 % 16.20 %
Mean 67.71 % 58.66 %
Max 89.30 % 89.50 %
Discrimination Min 0.27 0.20
Mean 0.44 0.37
Max 0.59 0.64
4.3 Methodological Considerations
For the standard-setting for the Mathematics standards-test by the BIFIE Salzburg, a modified version of the IDM was implemented (Freunberger, 2013; Freunberger
& Yanagida, 2012). The modified version of the IDM was in parts also used for the English standard-setting.
The appropriate methods should be economic in use and easy to handle (i.e., feed- back data, impact data, etc., should be quickly available and not dependent on complex analysis procedures). Also, the cognitive load for the participants should be held as low as possible. Additionally, we also wanted to implement two slightly different methods to be able to present diverse feedback to the participants. There- fore, a rating process similar as in the IDM or basked method was implemented and used to facilitate ratings and discussions on a single-item level. For determination of cut-scores a bookmark method was used. The bookmark as well as the IDM technique are methodologically related to item-mapping procedures, thus, prior determination of item-parameters (i.e., item-difficulties) is inevitable (Ferrara et al., 2002; Zwick, Senturk, Wang & Loomis, 2001). Interestingly, previous studies have shown that inter-judge consistency and also inter-rater-agreement is higher in item-mapping methods when compared to traditional Angoff procedures (Wang, 2003).
We implemented a rating-process that is similar to judgments performed in the IDM, where participants are asked to relate each item to the specific performance- level. Here, we asked: “What is the lowest level at which a test taker can answer the following item correctly?“, in round one and two. Subsequently, in round three and four, panelists were asked to place bookmarks between the different CEFR-levels.
This blended procedure bears several advantages. First of all, for validating a standard- setting process, it is important to evaluate the rating behaviour of judges ( Congdon &
McQueen, 2000; Eckes, 2005; Engelhard & Stone, 1998; Engelhard, 2011; Kozaki, 2004; Lynch & McNamara, 1998; Nichols, Twing, Mueller & O‘Malley, 2010).
Using a method like the IDM allows to derive clear assumptions about the rater decisions or the rating behaviour. For example, as every item is rated, we can provide bar-charts as feedback to the panelists showing for each item the category frequency of the whole panel (e.g., item 1 was rated by 70 % of the participants with A2, and by 30 % as B1 item). This information supports the discussions after the first rating round, the panel can easily spot homogeneously rated items and heterogeneously rated ones. Also, the post-standard-setting process allows more statistical analyses about rater-agreement than this would be the case when using the original bookmark procedure solely.
4.4 Familiarisation and Training
For the receptive skills, judges received material and instructions prior to the work- shop meeting (e.g., CEFTrain, section 3.6 of the CEFR, etc.). During the work- shop, a brief presentation introduced the goal of the standard-setting and general information on the national standards tests was given. Additional presentations from our external consultancy group NILE (Norwich Institute for Language Education;
Dave Allan, Keith Morrow, Thom Kiddle) introduced the CEFR and the reading and listening test. The participants were then asked to assign CEF-levels (from A1 to B2) to descriptors taken from the respective reading and listening scales. The results of these tasks are presented in Figure 9. Based on the feedback critical aspects of the descriptors and features, characteristics and keywords specific for the different levels were discussed. For the training of the rating process, six sample items from the item-