Distinct Genetic Risk Profile of the Rapidly Progressing Diffuse-Trickling Subtype of Geographic Atrophy in Age- Related Macular Degeneration (AMD)
Monika Fleckenstein,
1Felix Grassmann,
2Moritz Lindner,
1Maximilian Pfau,
1Joanna Czauderna,
1Tobias Strunz,
2Claudia von Strachwitz,
3Steffen Schmitz-Valckenberg,
1Frank G. Holz,
1and Bernhard H. F. Weber
21Department of Ophthalmology, University of Bonn, Bonn, Germany
2Institute of Human Genetics, University of Regensburg, Regensburg, Germany
3Eye Center Southwest, Stuttgart-Vaihingen, Germany
Correspondence: Bernhard H. F. We- ber, Institute of Human Genetics, University of Regensburg, Franz- Josef-Strauss-Allee 11, D-93053 Re- gensburg, Germany;
bweb@klinik.uni-regensburg.de.
MF, FG, and ML contributed equally to the work presented here and should therefore be regarded as equivalent authors.
Submitted: November 5, 2015 Accepted: March 25, 2016
Citation: Fleckenstein M, Grassmann F, Lindner M, et al. Distinct genetic risk profile of the rapidly progressing diffuse-trickling subtype of geographic atrophy in age-related macular degen- eration (AMD).Invest Ophthalmol Vis Sci. 2016;57:2463–2471.
DOI:10.1167/iovs.15-18593
PURPOSE.To genetically characterize a subphenotype of geographic atrophy (GA) in AMD associated with rapid progression and a diffuse-trickling appearance on fundus autofluores- cence imaging.
METHODS.Patients from the Fundus Autofluorescence in Age-Related Macular Degeneration Study were phenotyped for diffuse-trickling GA (dt-GA; n¼ 44). DNA was analyzed for 10 known AMD-associated genetic variants. A genetic risk score (GRS) was calculated and compared with patients with nondiffuse-trickling GA (ndt-GA;n¼311) and individuals from the 1000 genomes project (1000G;n¼267). Given the phenotypic overlap between diffuse- trickling and late-onset retinal degeneration (LORD), all C1QTNF5 exons and their exon/
intron boundaries were sequenced.
RESULTS.A statistically significant difference in allele frequencies between dt-GA and ndt-GA were found for CFH:rs1061170 and CFH:rs800292 (Pcorrected ¼ 0.03). The ARMS2 variant rs10490924 was significantly more frequent in dt-GA than in 1000G individuals (Pcorrected<
0.01). The GRS of dt-GA patients was in-between the score of the 1000G individuals and that of patients with ndt-GA, significantly differing from both (Pcorrected<0.01). Sequencing of C1QTNF5 revealed 28 unique variants although none showed a statistically significant association with dt-GA when compared with 1000G individuals.
CONCLUSIONS. The dt-GA phenotype shows a remarkably different genetic risk profile from other GA phenotypes secondary to AMD. Disease-associatedC1QTNF5 mutations were not identified. Together, these results suggest that the dt-GA phenotype is associated with a genetic background substantially different from other GA phenotypes and underlines the necessity to refine the clinical phenotyping, specifically when aiming for individualized therapies in AMD.
Keywords: AMD, fundus autofluorescence imaging, diffuse-trickling phenotype, late-onset retinal degeneration, C1QTNF5 gene, genetic risk factors
G
eographic atrophy (GA) represents a morphologic end- stage in various retinal diseases including advanced AMD.While choroidal neovascularization (CNV) is the most common cause of severe visual loss in late stage AMD, approximately 20% of AMD-patients who are legally blind have lost central vision due to GA.1–3
Geographic atrophy in AMD usually develops in the presence of early disease alterations at the level of the retinal pigment epithelium (RPE) and Bruch’s membrane with funduscopically visible drusen and/or pigmentary alterations.4,5 Histologically, areas of GA are characterized by loss of RPE cells, of outer layers of the neurosensory retina, and the choriocap- illaris. The precise pathomechanisms of GA development secondary to AMD are yet to be determined.
Age-related macular degeneration is a complex disease influenced by both, genetic and environmental risk factors with estimates of heritability varying from 45% to 71%.6 In a
recent effort, 52 independent signals representing 34 suscep- tibility loci were identified to be associated with risk of late stage AMD.7 Among those, several loci harbor genes of the complement cascade, highlighting the crucial role of comple- ment associated pathology in AMD.8Additionally, signals were found near genes of lipid and cholesterol metabolism as well as extracellular matrix genes.9,10
To predict the genetic risk in complex diseases, testing of single susceptibility variants is generally of limited value. In contrast, genotyping and evaluation of a series of independent disease-associated variants, a process also known as genetic profiling, is more appropriate.11,12This can be facilitated by a genetic risk score (GRS) representing the sum of common risk associated variants found in each individual, weighted by the respective effect size (log-odds ratio) to account for differences in risk modulation.
iovs.arvojournals.orgjISSN: 1552-5783 2463
Recent developments in retinal imaging technologies allow for a more refined phenotyping of various retinal diseases and have been shown useful to discriminate subphenotypes of GA.13,14 In the context of the prospective natural history Fundus Autofluorescence in Age-Related Macular Degeneration (FAM) Study (ClinicalTrials.gov Identifier: NCT00393692) the so-called diffuse-trickling GA (dt-GA) variant was identified by comparative fundus autofluorescence imaging (FAF) and was classified as a subtype of AMD.15,16 Several characteristic features discriminate this distinct GA phenotype from other AMD-related GA subtypes including (1) a significantly faster disease progression (i.e., enlargement rates of atrophic areas), (2) a lobular configuration of the atrophic patches, that exhibit a grayish FAF signal, (3) a significantly thinner choroid, and (4) a marked separation of the RPE/Bruch’s membrane complex in spectral-domain optical coherence tomography (SD-OCT) imaging, which was interpreted as excessive diffuse accumu- lation of sub-RPE deposits (Fig. 1). Besides the morphologic characteristics, patients with the dt-GA subtype differ from patients with other AMD-related GA phenotypes by a significantly younger age at first presentation and a higher prevalence of cardiovascular comorbidity.15,17,18 These dis- criminating findings have led to the hypothesis that a differential pathogenesis is underlying the dt-GA phenotype and have challenged the diagnosis of AMD.
In fact, there is phenotypic overlap with disease entities other than AMD.19–21Extensive macular atrophy with pseudo- drusen-like appearance (EMAP) exhibits a very similar or even the same phenotype and there is high resemblance with characteristics described in age-related choroidal atrophy (ARCA). Furthermore, there are striking similarities of the dt- GA phenotype with the retinal degeneration described in patients with late-onset retinal degeneration (LORD) (Fig. 1).
While no genetic causes have been identified for EMAP and ARCA so far, autosomal-dominant inheritance is well estab- lished for LORD (OMIM: 605670),22,23which was found to be associated with a single Ser163Arg missense mutation in the globular C1q domain of the C1q and TNF-related protein 50 (C1QTNF5) gene.24C1QTNF5 is a membrane-associated and secretory protein in the RPE and ciliary body and the S163R mutation of C1QTNF5 impairs its secretion and appears to displays a significant reduction in implementing RPE cellular adhesion.25–27 A key pathologic feature in LORD is a diffuse thick extracellular sub-RPE deposit.26–28
In the present work, we aimed to determine the genetic background of the dt-GA subphenotype and GA of other phenotypes secondary to AMD. Due to phenotypic overlap between dt-GA and LORD we additionally performed a candidate gene approach by analyzing theC1QTNF5gene.
M
ETHODSEthics Statement
The study followed the tenets of the Declaration of Helsinki and was approved by the local Ethics Review Board at the University of Bonn, Bonn, Germany (ID: 082/04 and 197/12), and the Department of Ophthalmology, University of
W¨urzburg, W¨urzburg, Germany (ID: 78/01). Informed written consent was obtained from each patient after explanation of the nature and possible consequences of the study.
Study Characteristics
Study characteristics are summarized in Table 1. Forty-four patients with the dt-GA subphenotype were recruited as part of the FAM study (in the public domain, www.clinicaltrials.gov:
NCT00393692), and its extension trial, the Directional Spread in Geographic Atrophy (DSGA) study (NCT02051998). Both have been described in detail elsewhere.16,17,29Briefly, patients needed to be above 50 years of age (55 years for DSGA) at the time of inclusion and had to exhibit GA in at least one eye.
Clear ocular media that allowed for good-quality imaging had to be present. Exclusion criteria included any history of retinal surgery, laser photocoagulation, and radiation therapy or other retinal disease in the study eye, including diabetic retinopathy.
Furthermore, 311 patients with GA but without the dt-GA subtype were recruited in W¨urzburg11,30and Bonn, equally as part of the FAM study.16,29Blood samples were taken from each patient after informed consent was given.31Additionally, we included data from a total of 267 European subjects (Utah Residents with Northern and Western European Ancestry [CEU], British in England and Scotland [GBR], and Finnish in Finland [FIN]) from the 1000 Genomes project (1000G;
Release 20110521, in the public domain, http://www.
1000genomes.org, accessed May 2, 2012).
Definition of GA due to AMD
Geographic atrophy was defined funduscopically as one or more well-defined, usually more or less circular patches of partial or complete depigmentation of the RPE, typically with visualization of underlying large choroidal blood vessels.32,33In the FAM and DSGA-studies, GA due to AMD was further defined as sharply demarcated lesions with clearly reduced fundus autofluorescence (FAF) signal of an extend of greater than or equal to 0.05 mm2(approximately 178lm in diameter) that is not caused by masking effects of exudative retinal changes (e.g., bleeding, exudation, fibrotic scar). Additionally, the affected eye should have funduscopically visible soft drusen and/or retinal pigment abnormalities consistent with AMD.34
Definition of the dt-GA Phenotype
Phenotyping of GA was described in detail elsewhere.16,18In brief, the previously introduced classification of GA based on abnormal FAF patterns,16was used to identify the specific FAF phenotype of each eye by two independent graders (MF, SSV) and a third reader (FGH) in case of discrepancy.
The dt-GA phenotype was characterized in FAF images by coalescent lobular atrophic lesions with an atrophic area appearing rather grayish compared with the dark black appearance of outer retinal atrophy seen in other GA subtypes.
Adjacent to atrophic patches, the FAF signal is markedly enhanced with a diffuse trickling FAF signal toward the periphery. Funduscopically, eyes with the FAF pattern charac- teristic of dt-GA exhibit dense granular hyperpigmentation in the central macula and the border areas of the atrophic lesions appear hyperpigmented. Furthermore, adjacent to the atrophic lesions, there are small yellowish spots. Reticular pseudodru- sen are present, whereas soft drusen are rather infrequent in this phenotype.15 Spectral-domain OCT imaging shows an obvious separation of the RPE/Bruch’s membrane complex (Fig. 1).15,16If there was suspicion of exudative AMD based on funduscopy (SD-OCT or FAF-imaging), fluorescein angiography TABLE1. Study Characteristics
dt-GA 1000G EUR ndt-GA
Number of individuals 44 267 311
Mean GRS (SD) 0.82 (1.69) 0.00 (1.36) 1.63 (1.34) Mean age (SD) 67.20 (11.28) NA 78.76 (6.57)
Fraction of males, % 36.36 NA 34.49
To Characterize a Subphenotype of GA in AMD IOVSjMay 2016jVol. 57jNo. 6j2464
FIGURE1. Fundus autofluorescence imaging and OCT imaging of eyes classified as dt-GA. There is variable extent of degeneration and variability in age of patients ([A] 69-year-old male, [B] 71-year-old male, [C] 50-year-old female, and [D] 58-year-old female). Common findings are coalescent lobular atrophic lesions with an atrophic area appearing grayish on FAF imaging. Optical coherence tomography imaging reveals a thin choroid and a marked separation of the RPE/Bruch’s membrane complex. Eyes classified with dt-GA may phenotypically overlap with ARCA, EMAP, and LORD.
was performed. Eyes were excluded from the analysis if a neovascular phenotype was verified.
Genotyping and GRS
Genotyping was performed as described previously.11,30 Briefly, genomic DNA was extracted from peripheral blood leukocytes by established methods. Genotyping was per- formed by TaqMan SNP genotyping (Applied Biosystems, Foster City, CA, USA) or by PCR followed by restriction enzyme digestion (New England Biolabs, Ipswich, MA, USA) and subsequent restriction fragment length analysis (RFLP).
The resulting genotypes were coded as the number of AMD risk increasing alleles (0, 1, or 2), that is alleles, which are more frequent in cases than in controls (Table 2).11 From these variants, we computed the GRS according to Grassmann et al.11by including the weights obtained from the parsimonious model based on 10 single nucleotide polymorphisms (SNPs;
Table 2). We only genotyped variants of the parsimonious 10 SNP model because it exhibited comparable classification accuracy as the 13 SNP model proposed by Grassmann et al.11 Furthermore, recent studies showed that additional inclusion of novel AMD-associated risk variants in such risk models contributes only marginally to classification accuracy and explained heritability.7We subtracted 9.05 from all GRS values to center the distribution on zero for the 1000G samples.
In addition, we estimated the variance explained by the 10 common variants on disease risk according to the liability threshold model.35 We estimated the individual variance explained for each variant and calculated the sum of those measures to calculate the full variance explained. Because the estimation of the explained variance is largely dependent on the disease prevalence or the life time risk for the disease, we assumed a lifetime disease risk for both diseases of 5%. This allowed us to compare the explained variance for both diseases.
Sequencing of the C1QTNF5 Gene and Data Analysis
To minimize a potential bias by faulty inclusion of patients with autosomal dominant LORD, we sequenced the coding position c.489 (p.Asn131) in all patients and verified bi-allelic presence of the wild type allele (C). Patients with the LORD associated mutation (C1QTNF5:c.489C>G) were excluded from further analysis (one case). To assess if other, possibly less severe, mutations in the LORD-associated gene could be causative for the dt-GA phenotype we amplified the 15 exons of C1QTNF5
(RefSeq: NM_015645.4) and their immediate flanking intronic sequences. PCR fragments were generated for each exon (Supplementary Table S1). The PCR fragments of each patient were pooled equimolar and processed using the Ion Xpress Plus Fragment Library kit (Life Technologies, Carlsbad, CA, USA) according to the manufacturer’s protocol. We used the Ion Xpress Barcode Adapters 1-96 to allow for multiplexing of DNA libraries from different individuals. The resulting DNA libraries were purified with AMPure beads (Beckman Coulter, Brea, CA, USA), and their concentrations and sizes were determined on an Agilent BioAnalyzer DNA high-sensitivity Chip (Agilent Technologies, Santa Clara, CA, USA). Between 20 and 24 libraries were simultaneously sequenced by emulsion PCR. Enrichment of cDNA-conjugated particles with the Ion OneTouch 400 Template Kit v2 DL (Life Technologies) was done according to the manufacturer’s protocol. The final particles were loaded on an Ion 316 chip and sequenced with a Personal Genome Machine (Ion Torrent) with 400-bp read length (Life Technologies).
Reads were aligned to the C1QTNF5 reference sequence (NM_015645.4) using the CLC Genomics Workbench (Qiagen, Venlo, The Netherlands) and standard settings. To assure sufficient power to detect heterozygous variants, the minimum coverage threshold of an exonic base was set to 20 reads.
Fragments failing this threshold were resequenced with the classical Sanger sequencing chain termination method. Variants were called with the Probabilistic Variant Caller in CLC with standard settings. A genotype was coded as the number of minor alleles at a given variant (0, 1, or 2) for each identified variant. To compare allele frequencies with a larger reference sample, we extracted the genotypes of all identified variants for 267 EUR samples in 1000G (Interim Release 2011/05/21) and coded the genotype according to the number of minor alleles.
Statistical Analyses and Visualization
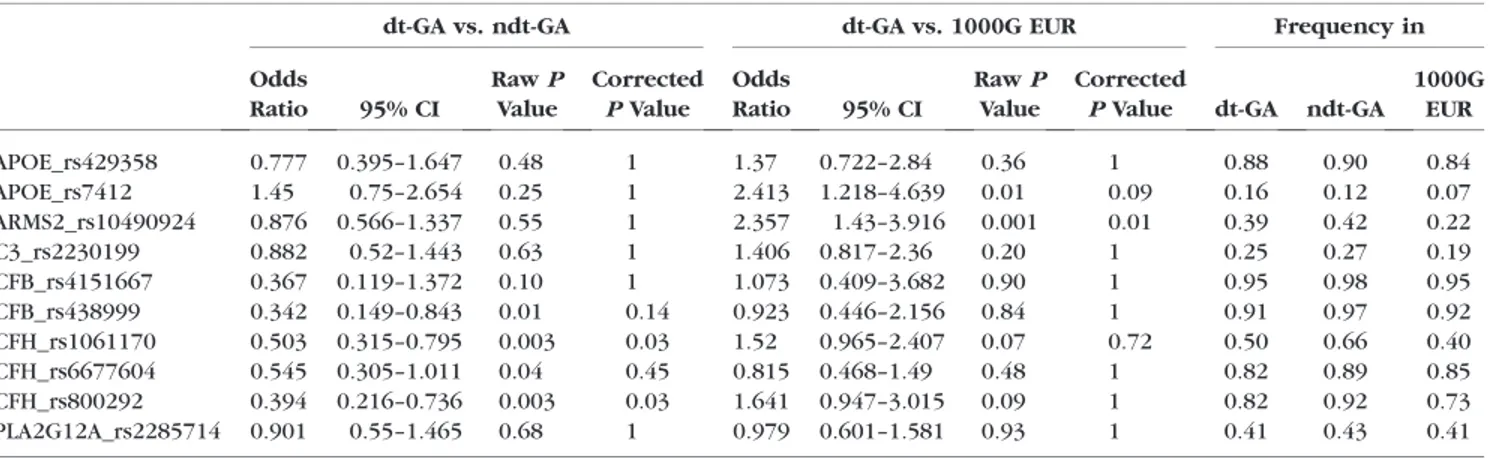
We computed means and 95% confidence intervals (CIs) of the GRS in different groups and used theggplotfunction from the ggplot236package in R37 to draw jitterplots. The Student’st- test was used as implemented in R to evaluate differences in the GRS between groups. Additionally, univariate logistic regression was applied as implemented in R to evaluate the association of single variants with dt-GA. Furthermore, we used a Sequencing Kernel Association Test (SKAT) as implemented in the package ‘SKAT’ in R to assess the overall burden of rare and common variants on disease risk.38,39The obtained rawP values were adjusted by a conservative Bonferroni correction TABLE2. Frequency of Genetic Risk Variants in the Cohorts Investigated
dt-GA vs. ndt-GA dt-GA vs. 1000G EUR Frequency in
Odds
Ratio 95% CI
RawP Value
Corrected PValue
Odds
Ratio 95% CI
RawP Value
Corrected
PValue dt-GA ndt-GA 1000G
EUR
APOE_rs429358 0.777 0.395–1.647 0.48 1 1.37 0.722–2.84 0.36 1 0.88 0.90 0.84
APOE_rs7412 1.45 0.75–2.654 0.25 1 2.413 1.218–4.639 0.01 0.09 0.16 0.12 0.07
ARMS2_rs10490924 0.876 0.566–1.337 0.55 1 2.357 1.43–3.916 0.001 0.01 0.39 0.42 0.22
C3_rs2230199 0.882 0.52–1.443 0.63 1 1.406 0.817–2.36 0.20 1 0.25 0.27 0.19
CFB_rs4151667 0.367 0.119–1.372 0.10 1 1.073 0.409–3.682 0.90 1 0.95 0.98 0.95
CFB_rs438999 0.342 0.149–0.843 0.01 0.14 0.923 0.446–2.156 0.84 1 0.91 0.97 0.92
CFH_rs1061170 0.503 0.315–0.795 0.003 0.03 1.52 0.965–2.407 0.07 0.72 0.50 0.66 0.40
CFH_rs6677604 0.545 0.305–1.011 0.04 0.45 0.815 0.468–1.49 0.48 1 0.82 0.89 0.85
CFH_rs800292 0.394 0.216–0.736 0.003 0.03 1.641 0.947–3.015 0.09 1 0.82 0.92 0.73
PLA2G12A_rs2285714 0.901 0.55–1.465 0.68 1 0.979 0.601–1.581 0.93 1 0.41 0.43 0.41
To Characterize a Subphenotype of GA in AMD IOVSjMay 2016jVol. 57jNo. 6j2466
by multiplying thePvalues with the number of (independent) tests performed.
R
ESULTSGenetic Risk of AMD in dt-GA Patients
To evaluate the genetic risk, we genotyped 10 known AMD associated genetic variants in 44 dt-GA patients and 311 patients with ndt-GA. Additionally, we extracted the genotypes for the 10 variants from 267 European individuals as given in the 1000G (Table 2). We found a statistically significant difference in the allele frequencies between dt-GA and ndt- GA for CFH_rs1061170 (PCorrected¼0.035) and CFH_rs800292 (PCorrected ¼ 0.026) after adjustment for multiple testing.
Strikingly, only a single variant (APOE_rs7412) had a higher frequency in dt-GA patients than in ndt-GA patients. Converse- ly, we performed a similar analysis and compared dt-GA cases with 1000G controls and found a nominally significant
assoc i at i on of t wo SNP s, A RMS2 _r s1 04 90 92 4 a nd APOE_rs7412 with disease. After adjustment for multiple testing, only ARMS2_rs10490924 remained statistically signif- icant (PCorrected¼0.008).
To summarize the genetic risk, we computed the GRS11for the 1000G European individuals, for dt-GA patients and for patients with ndt-GA and found mean GRS values of 0.00 (95%
CI:0.16 to 0.16), 0.82 (95% CI: 0.32–1.32), and 1.63 (1.48–
1.78), respectively (Fig. 2). The mean GRS in dt-GA patients was significantly lower than the mean GRS of ndt-GA patients (PCorrected¼0.01) but also significantly higher than the mean GRS of control subjects (PCorrected¼0.01). As expected, the mean GRS for ndt-GA patients was significantly higher than the GRS of control subjects (PCorrected<131016). Because two variants in theCFHgene were significantly different between dt-GA and ndt-GA, we recalculated a GRS based on eight variants (excluding CFH_rs1061170 and CFH_rs800292). We found a nominally significant difference (P¼0.049) between the risk scores of dt-GA (mean: 0.53, 95% CI: 0.16–0.90) and FIGURE2. Genetic risk score distribution in cases and controls. The GRS was calculated according to the parsimonious model based on 10 variants proposed in Grassmann et al.11and centered on zero for control individuals. Each point represents one individual. We included 267 European individuals from 1000G, 44 patients with dt-GA, and 311 patients with ndt-GA.Horizontal barsrepresent 95% confidence intervals for each mean.
Significant differences between means are indicated with anasterisk: *PCorrected<0.01, ***PCorrected<0.001.
ndt-GA patients (mean: 0.94, 95% CI: 0.81–1.06), suggesting that the observed GRS differences are due to the combined effect of the individual variants.
Next, we estimated the variance explained by the 10 variants on disease risk in a liability threshold model40,41using the odds ratios obtained from comparing dt-GA and ndt-GA cases to 1000G controls. Assuming a life time risk for ndt-GA and dt-GA of 5%, we estimate the variance explained by those 10 variants for ndt-GA to be 43.4% and 14.5% for dt-GA, indicating that other variants or environmental factors are responsible for dt-GA risk.
Next Generation Sequencing of the C1QTNF5 Gene and Association Testing
We sequenced the 15 exons and immediate flanking intronic regions of C1QTNF5 and obtained on average 135,984 (SD6 85,610) reads per individual/library. The average read length was 182 bp (SD651 bp) and the average coverage was 6541 (SD65634) reads. In total, we found 28 unique variants in the C1QTNF5 gene in 44 dt-GA patients. We compared the
frequencies of these variants with the frequencies observed in the 1000G samples (Table 3). We fitted univariate logistic regression models for each variant and found three variants with nominally significant association with dt-GA. After adjustment for multiple testing none of the variants remained statistically significant.
To test whether the dt-GA phenotype could result from distinct mutations within the C1QTNF5 gene, we compared the total frequency of variants in the gene between dt-GA individuals and the 1000G samples. We found a total of 182 variants in the dt-GA group and 1.254 variants in the group of 1000G individuals. This corresponds to an average of 4.14 (SD 61.77) and 4.70 (SD61.89) variants per person, respectively, and is not significantly different in the two groups (P>0.05).
To assess the overall burden of genetic variation in the C1QTNF5 gene in dt-GA risk, we analyzed all identified variants in a SKAT by comparing the genotypes of dt-GA patients with the genotypes obtained from the 1000G in the C1QTNF5 gene. We found no statistically significant different genetic burden of variants in C1QTNF5 (P>0.05).
TABLE3. Statistical Analysis of C1QTNF5 Variants Ordered by AscendingPValues
Variant
(hg19 position) rs–ID
Major Allele
Minor Allele
Effect of Variant (on C1QTNF5)
Odds
Ratio 95% CI
RawP Value
Corrected PValue
Minor allele Frequency in
dt–GA
1000G EUR chr11:119211409 rs185696769 G C 50UTR variant 25.900 2.606–396.8 0.006 0.175 0.023 0.002 chr11:119210380 rs146971652 C A Missense variant
(p.N131K)
25.230 1.941–3536 0.013 0.357 0.023 0 chr11:119215046 rs35885438 G A 50UTR variant 0.237 0.026–0.915 0.034 0.957 0.011 0.079
chr11:119217311 rs883245 G A 50UTR variant 0.645 0.391–1.048 0.077 1 0.409 0.502
chr11:119210884 – G A Intron variant
(þ9)
10.680 0.556–1574 0.113 1 0.011 0
chr11:119216231 rs2510143 T C 50UTR variant 0.400 0.078–1.300 0.139 1 0.023 0.058
chr11:119216832 rs138913508 T C 50UTR variant 6.556 0.330–979.8 0.216 1 0.011 0
chr11:119217254 rs883247 C T 50UTR variant 0.758 0.451–1.251 0.28 1 0.375 0.431
chr11:119212363 rs138370910 G A 50UTR variant 2.069 0.327–8.619 0.353 1 0.011 0.007
chr11:119209979 rs9640 A T 50UTR variant 0.735 0.353–1.414 0.369 1 0.125 0.165
chr11:119213441 rs142533439 C T Intron variant (4)
4.876 0.033–97.73 0.408 1 0 0.002
chr11:119210582 rs141429422 G A Intron variant (24)
4.121 0.028–81.37 0.452 1 0 0.002
chr11:119216539 rs142584359 G A 50UTR variant 3.747 0.025–73.45 0.478 1 0 0.002
chr11:119216169 rs141474039 C T 50UTR variant 2.889 0.020–55.74 0.558 1 0 0.002
chr11:119214525 rs145719998 C A 50UTR variant 2.340 0.016–44.80 0.631 1 0 0.002
chr11:119215007 rs185451482 A G Intron variant (þ19)
2.035 0.014–28.25 0.678 1 0 0.004
chr11:119212213 rs184075096 G A 50UTR variant 2.056 0.014–39.25 0.68 1 0 0.002
chr11:119216504 rs3814762 G A 50UTR variant 0.903 0.543–1.468 0.685 1 0.307 0.326
chr11:119217288 rs883246 G A 50UTR variant 0.609 0.005–5.515 0.721 1 0 0.013
chr11:119216279 rs36015759 C T 50UTR variant 1.094 0.646–1.797 0.73 1 0.25 0.232
chr11:119216142 rs150902999 G T 50UTR variant 1.225 0.115–6.741 0.839 1 0.011 0.011
chr11:119216274 rs200251814 G A 50UTR variant 1.411 0.010–26.95 0.839 1 0 0.002
chr11:119213303 rs11217241 G A Intron variant (þ3)
0.950 0.360–2.151 0.909 1 0.068 0.082
chr11:119210583 rs1135258 C A Intron variant (25)
1.026 0.640–1.629 0.914 1 0.398 0.401
chr11:119217098 rs143351376 – TAC Intron variant (16)
0.887 0.007–9.500 0.936 1 0 0.006
chr11:119217267 rs79836575 C T 50UTR variant 0.887 0.007–9.500 0.936 1 0 0.006
chr11:119217280 rs139821533 G A 50UTR variant 1.111 0.008–14.12 0.947 1 0 0.004
chr11:119216121 rs189840088 G A Intron variant (þ9) 1.046 0.008–11.07 0.976 1 0 0.007
To Characterize a Subphenotype of GA in AMD IOVSjMay 2016jVol. 57jNo. 6j2468
D
ISCUSSIONHere, we demonstrate that the dt-GA phenotype in late stage AMD shows remarkable genetic differences from other FAF- defined GA phenotypes. In addition, despite clinical similarities between dt-GA and autosomal dominant LORD such as excessive accumulation of hyperreflective material between the RPE and Bruch’s membrane,15,21,42 no disease-associated variants were detected in the LORD-associatedC1QTNF5gene.
From 10 prominent variants known to be strongly associ ate d wi th AM D r isk , two of the se, n ame ly CFH_rs1061170 and CFH_rs800292, revealed a statistically significant difference in their allele frequencies between dt-GA and ndt-GA. Furthermore, there was a single variant, ARMS2_rs10490924, significantly associated with dt-GA when comparing the frequency with 1000G individuals. Calculating a GRS as previously described11revealed a genetic risk profile of dt-GA individuals significantly different from both, ndt-GA and 1000G individuals. With a GRS of 0.88 the genetic risk of dt-GA was in-between that of 1000G and ndt-GA individuals.
Together, these findings suggest that genetic factors, which may act in dt-GA are likely distinct from those responsible for other phenotypes of GA secondary to AMD, especially because those known factors only explain a small proportion of the observed disease risk variance in dt-GA. These findings are in line with recent findings, which provide evidence for substantial clinical differences between dt-GA and ndt- GA.15,16,18,43
The question arises whether variant ARMS2_rs10490924, previously reported to significantly influence the progression rate of GA lesions,33could account for the faster GA growth in dt-GA versus ndt-GA patients.15,17,18 Our data show, however, that the frequency of the ARMS2_rs10490924 variant in dt-GA patients is similar to the frequency in ndt-GA patients. This is also true for the C3_rs2230199 variant, also known to be a risk factor for GA lesion growth.33These findings suggest that the two variants associated with disease progression likely have no role in the differences in lesion growth rate between dt-GA and ndt-GA patients. Other so far unknown factors, genetic or environmental, appear to play a role in the different pathologies of DT-GA and NDT-GA.
The molecular analysis of the C1QTNF5 gene in DT-GA patients was stimulated by the phenotypic overlap of DT-GA with the retinal degeneration in patients diagnosed with LORD.
Most strikingly, the two disease pathologies share an excessive accumulation of hyperreflective material between the RPE and Bruch’s membrane as visualized by SD-OCT imaging.15,21,42 Nevertheless, genetic variants in C1QTNF5 were not signifi- cantly associated with DT-GA when comparing with 1000G individuals. To test for statistical power in our rather small group of dt-GA patients, we conducted a post hoc power analysis. Assuming there is a strong contribution to dt-GA risk (odds ratio > 2.0) from one of the six common variants (frequency >10% in 1000G individuals) in the transcribed region of C1QTNF5, statistical power would be greater than 92% to find such an association with a P value smaller than 0.05. Alternatively, the combination of rare variants may contribute to the disease risk jointly and lead to the development of dt-GA. The present study, however, is underpowered to investigate the latter possibility. Neverthe- less, the C1QTNF5 protein and/or related proteins still attract attention as candidates involved in the pathomechanism of dt- GA, specifically as known AMD risk variants explain only a small percentage of the variance of disease risk observed in DT- GA patients.
A phenotypic overlap of two diseases may not necessarily reflect a shared etiology but may be expression of a common final pathway of different pathogeneses. Therefore, dt-GA,
LORD, EMAP, and ARCA may be unrelated diseases with a similar unspecific end-stage phenotype. On the other hand, it cannot be excluded that these diseases share a common etiology with slightly differing end-stage manifestation. It is noteworthy that patients who were classified to exhibit the dt- GA phenotype show variable extend of degeneration and a relatively high variability in age of onset. Therefore, the diffuse- trickling phenotype may comprise patients with EMAP, ARCA, and LORD. Indeed, one diffuse-trickling patient had been excluded from the current analysis because of detection of the LORD associated mutation C1QTNF5:c.489C>G.
Whether the diffuse-trickling phenotype can be classified as AMD remains debatable. There are distinct characteristics that discriminate the diffuse-trickling phenotype from typical AMD.
Here, we additionally demonstrate that dt-GA genetically differs from other GA subtypes secondary to AMD. Together, these findings strongly suggest that differential pathogenetic path- ways are operative in distinct clinical phenotypes of GA, at least between dt-GA and ndt-GA. This underscores the importance of refined phenotyping particularly in the context of designing interventional clinical trials for AMD targeting specific pathways.
It is anticipated that with the ongoing development of retinal imaging techniques, further subtypes of AMD will be identified with differential pathogeneses when compared with typical AMD. The concept where AMD represents a disease spectrum rather than a homogenous entity appears appeal- ing.44
To the best of our knowledge, this study demonstrates for the first time a difference in the genetic profile between dt-GA and other GA subtypes due to AMD. The candidate gene approach examining the C1QTNF5 gene as an excellent candidate gene due to phenotypic overlaps in disease pathology failed to further elucidate the genetic background of dt-GA. Further approaches to identify the true genetic cause of dt-GA will include refined clinical phenotyping and possibly further analysis ofC1QTNF5and related genes.
Acknowledgments
Supported by grants by the Deutsche Forschungsgemeinschaft (DFG-Germany Research Foundation, Bonn, Germany): Ho1926/3- 1 (FGH), FL 658/4-1 (MF), and WE 1259/19-2 (BHFW), and the BONFOR program of the University of Bonn: O-137.0020 (ML;
Bonn, Germany).
Disclosure:M. Fleckenstein, Bayer, (R), Heidelberg Engineering, (R), Novartis (R), P; F. Grassmann, None; M. Lindner, Heidelberg Engineering (R), Alimera Sciences (R);M. Pfau, Bayer (R);J. Czauderna, None;T. Strunz, None;C. von Strachwitz, None;S. Schmitz-Valckenberg, Alcon (R), Alimera (R), Heidel- berg Engineering (R), Novartis (R), Optos (R);F.G. Holz, Acucela (R), Alcon (R), Allergan (R), Bayer (R), Boehringer Ingelheim (R), Genentech (R), Heidelberg Engineering (R), Novartis (R), Optos (R), Roche (R);B.H.F. Weber, Alcon (C), Novartis (S), Allergan (F)
References
1. Klein R, Klein BEK, Knudtson MD, Meuer SM, Swift M, Gangnon RE. Fifteen-year cumulative incidence of age-related macular degeneration: the Beaver Dam Eye Study. Ophthal- mology. 2007;114:253–262.
2. Friedman DS, O’Colmain BJ, Mu˜noz B, et al. Prevalence of age- related macular degeneration in the United States. Arch Ophthalmol. 2004;122:564–572.
3. Klaver CC, Assink JJ, van Leeuwen R, et al. Incidence and progression rates of age-related maculopathy: the Rotterdam Study.Invest Ophthalmol Vis Sci. 2001;42:2237–2241.
4. Holz FG, Wolfensberger TJ, Piguet B, et al. Bilateral macular drusen in age-related macular degeneration. Prognosis and risk factors.Ophthalmology. 1994;101:1522–1528.
5. Sarks SH. Ageing and degeneration in the macular region: a clinico-pathological study.Br J Ophthalmol. 1976;60:324–341.
6. Seddon JM, Cote J, Page WF, Aggen SH, Neale MC. The US twin study of age-related macular degeneration: relative roles of genetic and environmental influences. Arch Ophthalmol.
2005;123:321–327.
7. Fritsche LG, Igl W, Bailey JNC, et al. A large genome-wide association study of age-related macular degeneration high- lights contributions of rare and common variants.Nat Genet.
2016;48:134–143.
8. Johnson LV, Ozaki S, Staples MK, Erickson PA, Anderson DH. A potential role for immune complex pathogenesis in drusen formation.Exp Eye Res. 2000;70:441–449.
9. Grassmann F, Fauser S, Weber BHF. The genetics of age-related macular degeneration (AMD) - novel targets for designing treatment options?Eur J Pharm Biopharm. 2015;95(pt B):
194–202.
10. Fritsche LG, Fariss RN, Stambolian D, Abecasis GR, Curcio CA, Swaroop A. Age-related macular degeneration: genetics and biology coming together. Annu Rev Genomics Hum Genet.
2014;15:151–171.
11. Grassmann F, Fritsche LG, Keilhauer CN, Heid IM, Weber BHF.
Modelling the genetic risk in age-related macular degeneration.
PLoS One. 2012;7:e37979.
12. Grassmann F, Heid IM, Weber BHF. Genetic risk models in age- related macular degeneration. Adv Exp Med Biol. 2014;801:
291–300.
13. Boon CJF, Jeroen Klevering B, Keunen JEE, Hoyng CB, Theelen T. Fundus autofluorescence imaging of retinal dystrophies.
Vision Res. 2008;48:2569–2577.
14. Boon CJF, Klevering BJ, Cremers FPM, et al. Central areolar choroidal dystrophy.Ophthalmology. 2009;116:771–782. 782, e1.
15. Fleckenstein M, Schmitz-Valckenberg S, Martens C, et al.
Fundus autofluorescence and spectral-domain optical coher- ence tomography characteristics in a rapidly progressing form of geographic atrophy. Invest Ophthalmol Vis Sci. 2011;52:
3761–3766.
16. Holz FG, Bindewald-Wittich A, Fleckenstein M, Dreyhaupt J, Scholl HPN, Schmitz-Valckenberg S. Progression of geographic atrophy and impact of fundus autofluorescence patterns in age-related macular degeneration. Am J Ophthalmol. 2007;
143:463–472.
17. Lindner M, Bezatis A, Czauderna J, et al. Choroidal thickness in geographic atrophy secondary to age-related macular degen- eration.Invest Ophthalmol Vis Sci. 2015;56:875–882.
18. Fleckenstein M, Schmitz-Valckenberg S, Lindner M, et al. The
‘‘diffuse-trickling’’ fundus autofluorescence phenotype in
geographic atrophy. Invest Ophthalmol Vis Sci. 2014;55:
2911–2920.
19. Spaide RF. Age-related choroidal atrophy.Am J Ophthalmol.
2009;147:801–810.
20. Querques G, Blanco R, Puche N, Massamba N, Souied EH.
Extensive macular atrophy with pseudodrusen-like appear- ance.Ophthalmology. 2013;120:429, e1–e2.
21. Soumplis V, Sergouniotis PI, Robson AG, et al. Phenotypic findings in C1QTNF5 retinopathy (late-onset retinal degener- ation).Acta Ophthalmol. 2013;91:e191–e195.
22. Milam AH, Curcio CA, Cideciyan AV, et al. Dominant late- onset retinal degeneration with regional variation of sub- retinal pigment epithelium deposits, retinal function, and photoreceptor degeneration. Ophthalmology. 2000;107:
2256–2266.
23. Kuntz CA, Jacobson SG, Cideciyan AV, et al. Sub-retinal pigment epithelial deposits in a dominant late-onset retinal degeneration.Invest Ophthalmol Vis Sci. 1996;37:1772–1782.
24. Hayward C, Shu X, Cideciyan AV, et al. Mutation in a short- chain collagen gene, CTRP5, results in extracellular deposit formation in late-onset retinal degeneration: a genetic model for age-related macular degeneration.Hum Mol Genet. 2003;
12:2657–2667.
25. Mandal MNA, Vasireddy V, Reddy GB, et al. CTRP5 is a membrane-associated and secretory protein in the RPE and ciliary body and the S163R mutation of CTRP5 impairs its secretion.Invest Ophthalmol Vis Sci. 2006;47:5505–5513.
26. Shu X, Tulloch B, Lennon A, et al. Disease mechanisms in late- onset retinal macular degeneration associated with mutation in C1QTNF5.Hum Mol Genet. 2006;15:1680–1689.
27. Shu X, Tulloch B, Lennon A, et al. Biochemical characterisation of the C1QTNF5 gene associated with late-onset retinal degeneration. A genetic model of age-related macular degen- eration.Adv Exp Med Biol. 2006;572:41–48.
28. Borooah S, Collins C, Wright A, Dhillon B. Late-onset retinal macular degeneration: clinical insights into an inherited retinal degeneration.Br J Ophthalmol. 2009;93:284–289.
29. Scholl HPN, Fleckenstein M, Fritsche LG, et al. CFH, C3 and ARMS2 are significant risk loci for susceptibility but not for disease progression of geographic atrophy due to AMD.PLoS One. 2009;4:e7418.
30. Grassmann F, Friedrich U, Fauser S, et al. A candidate gene association study identifies DAPL1 as a female-specific susceptibility locus for age-related macular degeneration (AMD).Neuromolecular Med. 2015;95(pt B):194–202.
31. Lindner M, B¨oker A, Mauschitz MM, et al. Directional kinetics of geographic atrophy progression in age-related macular degeneration with foveal sparing.Ophthalmology. 2015;122:
1356–1365.
32. Lindblad AS, Lloyd PC, Clemons TE, et al. Change in area of geographic atrophy in the Age-Related Eye Disease Study:
AREDS report number 26.Arch Ophthalmol. 2009;127:1168–
1174.
33. Grassmann F, Fleckenstein M, Chew EY, et al. Clinical and genetic factors associated with progression of geographic atrophy lesions in age-related macular degeneration. PLoS One. 2015;10:e0126636.
34. Fleckenstein M, Schmitz-Valckenberg S, Adrion C, et al.
Progression of age-related geographic atrophy: role of the fellow eye.Invest Ophthalmol Vis Sci. 2011;52:6552–6557.
35. So H-C, Li M, Sham PC. Uncovering the total heritability explained by all true susceptibility variants in a genome-wide association study.Genet Epidemiol. 2011;35:447–456.
36. Wickham H. ggplot2: Elegant Graphics for Data Analysis.
Springer, New York; 2009.
37. R Development Core Team. R: A Language and Environment for Statistical Computing. 2010. Available at: http://www.
r-project.org/. Accessed August 8, 2015.
38. Seunggeun, Lee, Miropolsky Larisa, Wu M. SKAT: SNP-set (Sequence) Kernel Association Test. 2013. Available at: http://
cran.r-project.org/package¼SKAT. Accessed August 8, 2015.
39. Wu MC, Lee S, Cai T, Li Y, Boehnke M, Lin X. Rare-variant association testing for sequencing data with the sequence kernel association test.Am J Hum Genet. 2011;89:82–93.
40. So H-C, Yip BHK, Sham PC. Estimating the total number of susceptibility variants underlying complex diseases from genome-wide association studies.PLoS One. 2010;5:e13898.
41. So H-C, Gui AHS, Cherny SS, Sham PC. Evaluating the heritability explained by known susceptibility variants: a survey of ten complex diseases.Genet Epidemiol. 2011;35:
310–317.
To Characterize a Subphenotype of GA in AMD IOVSjMay 2016jVol. 57jNo. 6j2470
42. Jacobson SG, Cideciyan AV, Sumaroka A, Roman AJ, Wright AF.
Late-onset retinal degeneration caused by C1QTNF5 mutation:
sub-retinal pigment epithelium deposits and visual conse- quences.JAMA Ophthalmol. 2014;132:1252–1255.
43. Moussa K, Lee JY, Stinnett SS, Jaffe GJ. Spectral domain optical coherence tomography-determined morphologic predictors of
age-related macular degeneration-associated geographic atro- phy progression.Retina. 2013;33:1590–1599.
44. Fritsche LG, Fleckenstein M, Fiebig BS, et al. A subgroup of age-related macular degeneration is associated with mono- allelic sequence variants in the ABCA4 gene.Invest Ophthal- mol Vis Sci. 2012;53:2112–2118.