E SSAYS IN B EHAVIORAL AND E XPERIMENTAL
E CONOMICS
Inauguraldissertation zur
Erlangung des Doktorgrades der
Wirtschafts- und Sozialwissenschaftlichen Fakultät der
Universität zu Köln
2018
vorgelegt von
Katharina Laske M.Sc.
aus Ludwigsfelde
Referent: Professor Dr. Dirk Sliwka Korreferent: Professor Dr. Matthias Heinz Tag der Promotion: 29.05.2019
Danksagung
Mein allererster und wichtigster Dank geht an meinen Doktorvater Dirk Sliwka für seine außergewöhnliche Betreuung, die sich durch fachliche Exzellenz, große Unterstützung und ständige Verfügbarkeit ausgezeichnet hat. Sein kritischer Geist gepaart mit konstruktiver Kritik, sein genuines Interesse an Erkenntnis und das damit verbundene Selbstverständnis dieses immer wieder zu hinterfragen sowie seine integre, gradlinige Haltung haben mich in meinem akademischen Werdegang geprägt.
Äußerst dankbar bin ich Matthias Heinz für die Übernahme des Koreferats, der nicht nur im übertragenen Sinne stets eine offene Tür hatte und mir während meiner gesamten Promotionszeit immer hilfsbereit zur Seite stand. Den offenen Meinungsaustausch mit Matthias und seinen guten Rat, wenn ich ihn brauchte, habe ich sehr geschätzt.
Von zentraler Bedeutung für das Anfertigen dieser Arbeit war die große Unterstützung meiner Koautorin Marina Schröder, die mich von Beginn an mit viel positiver Energie ermutigt, gefördert und begleitet hat. Vieles von dem, was ich in meiner Promotion gelernt habe, habe ich von Marina gelernt. Ihr gilt mein ganz besonderer Dank.
Zudem möchte ich mich sehr bei meiner Koautorin und Freundin Silvia Saccardo bedanken;
sie machte meine Zeit in San Diego unvergesslich. Ein herzliches Dankeschön geht auch an Uri Gneezy, der meinen Forschungsaufenthalt in San Diego erst ermöglichte und mich von Beginn an aufgeschlossen und kollegial im Team aufnahm.
Des Weiteren möchte ich mich bei meinen tollen jetzigen und ehemaligen Arbeitskollegen Jesper Armouti-Hansen, Jakob Alfitian, Sebastian Butschek, Lea Cassar, Razi Farukh, Anastasia Danilov, Mira Fischer, Christoph Große-Bölting, Patrick Kampkötter, Felix Kölle, Kathrin Manthei, Lea Petters und Timo Vogelsang für die sehr gute Zusammenarbeit und positive Arbeitsatmosphäre bedanken. Ein großer Dank geht natürlich auch an unsere studentischen Hilfskräfte allen voran Sarah Adelfang, Julia Bohne, Emanuel Castillo Ruiz, Tobias Danzeisen, Markus Hartmann, Christine Herter, Annalena Holterhoff, Jonathan Holzbach, Leonie, Kern, Tarek Khellaf, Andrew Kinder, Ruth Neeßen, Miriam Reetz, Eva-
Maria Scheurenbrandt, Julia Schmidt, Sophia Schneider, Carolin Wegner, Paula Wetter und Sandra Wüst für ihr Engagement und ihre große Einsatzbereitschaft.
Und weil Leben nicht nur aus Arbeit besteht, bin ich meinen Freunden außerordentlich dankbar, die meine Freizeit während der letzten Jahre bereichert haben. Ganz besonders erwähnen möchte ich an dieser Stelle Caro und Ramona, Anja und Jako sowie die „Minions“
David, Johanna, Johannes, Marina und Sonja für viele schöne Abende und die gemeinsam verbrachte Zeit, in der ich mich erholen und Energie aufladen konnte.
Ein großer Dank gilt meinen Eltern und meinem Bruder Tobias, die mich auf meinem Weg durch das Studium und die Promotion begleitet und stets unterstützt haben.
Mein letzter und größter Dank geht an meinen Freund Cornelius. Für seine grenzenlose Unterstützung und seinen starken Rückhalt, durch den sich vieles sehr viel leichter angefühlt hat. Für sein Interesse, sich in meine Forschungsfragen reinzudenken und diese mit seinem unvoreingenommenen Blick kritisch zu hinterfragen. Für seinen Humor, mit dem er mich so häufig zum Lachen bringt und der das Leben so viel schöner macht! Ich bin sehr glücklich, dass es ihn gibt.
i
Contents
1 Introduction 1
2 Quality through Quantity – The Effects of Piece-Rate Incentives on Creative
Performance 6
2.1 Introduction 6
2.2 Experimental Design and Procedure 9
2.2.1 The Task 9
2.2.2 Treatments 12
2.2.3 Procedural Details 13
2.3 Results 14
2.4 Conclusion 20
2.5 Appendix to Chapter 2 22
3 Creative Solutions: Expertise versus Crowd Sourcing 27
3.1 Introduction 27
3.2 Experimental Design and Procedure 29
3.2.1 Procedural Details 29
3.2.2 Treatments 31
3.2.3 The Task 31
3.3 Results 32
3.4 Discussion and Conclusion 35
3.5 Appendix to Chapter 3 37
4 Do Fines Deter Unethical Behavior? The Effect of Systematically Varying the
Size and Probability of Punishment 42
4.1 Introduction 42
4.2 Experimental Design 46
4.2.1 The Game 46
4.2.2 Treatments 47
ii
4.2.3 Procedure 50
4.3 Predictions 51
4.4 Results 53
4.4.1 Varying Fines and Probabilities: Between-Participant Data 53 4.4.2 Varying Fines and Probabilities: Within-Participant Data 59
4.5 Decisions from Experience 63
4.5.1 Experimental Design 64
4.5.2 Results 65
4.6 Discussion 67
4.7 Appendix to Chapter 4 70
Bibliography 98
iii
List of Figures
2.1 Set of Materials and Experimental Setup 10
2.2 Examples of Illustrations 11
2.3 Number of High Quality Ideas by Treatment 14
2.4 Number of High Quality Ideas by Treatment (Subjective Quality Measure) 22
3.1 Click Rates by Treatment 33
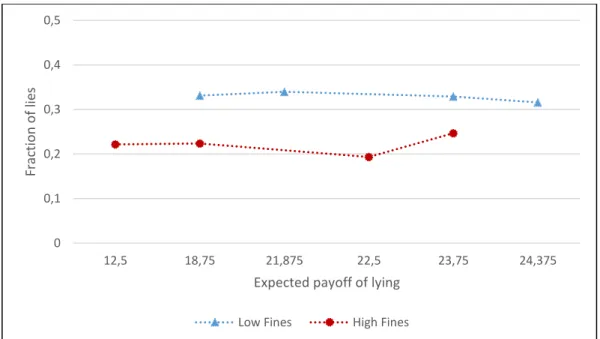
4.1 Fraction of Lies by Probability of Being Audited and by Fine Size 54 4.2 Fraction of Lies by Expected Payoff from Lying (Between-Participant
Treatments) 57
4.3 Fraction of Lies by Probability of Being Audited and by Fine Size (Within-Probability
Treatments) 60
4.4 Fraction of Lies by Expected Payoff if Lied (Within-Probability Treatments) 61 4.5 Fraction of Lies by Probability of Being Audited and by Fine Size (Within-Fine
Treatments) 62
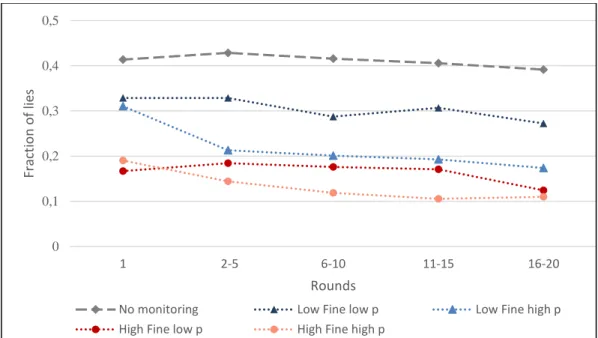
4.6 Lying Over Time – Fraction of Lies by Rounds 66
4.7 Decision Maker’s Strategies by p and δ – High-Fine Treatments 78 4.8 Fraction of Lies by Ambiguous Probabilities auf Being Audited and by Ambiguous
Fine Size (Between-Participant Treatments) 78
4.9 Lying Over Time – Fraction of Lies Round-by-Round 92
iv
List of Tables
2.1 Experimental Treatments 13
2.2 Effect of Piece-Rates on Separate Dimensions of Creativity 19 2.3 Effect of Piece-Rates on Number of High Quality Illustrations 20
3.1 Experimental Treatments 31
3.2 Examples of the Three Best and Worst Titles 32
3.3 Regression Analysis of Expertise on Quality, Time and Productivity 34
3.4 All Titles with Scores 38
3.5 Sample Characteristics 41
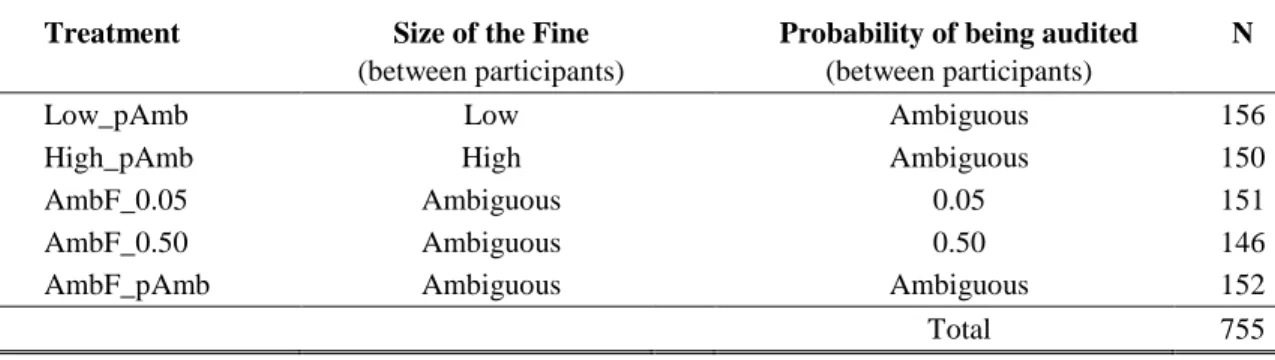
4.1 Experimental Treatments 48
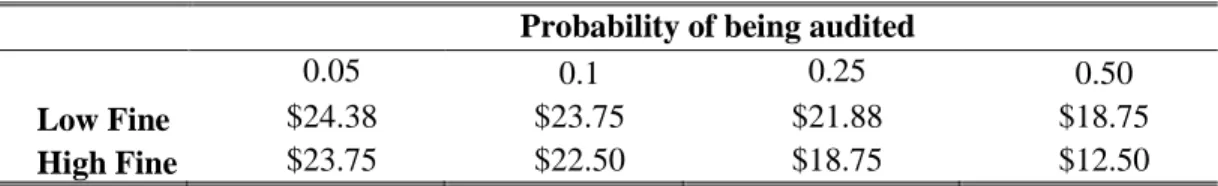
4.2 Expected Payoffs from Lying 52
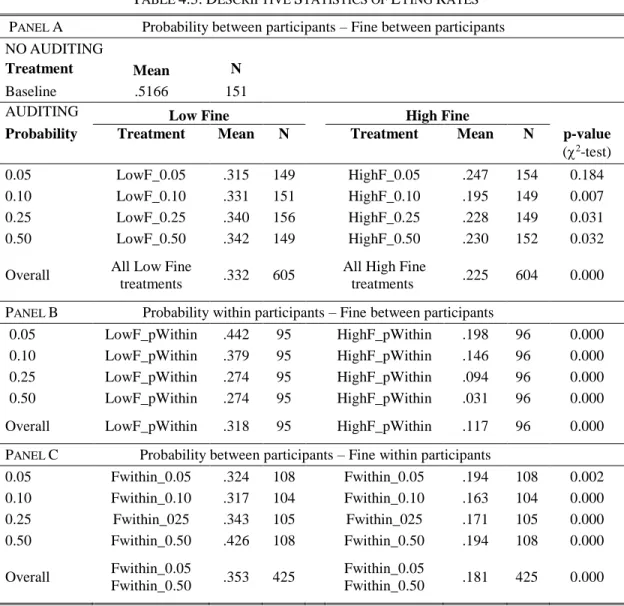
4.3 Descriptive Statistics of Lying Rates 55
4.4 Effect of Fine and Probability on Lying 56
4.5 Descriptive Statistics of Lying Rates – Treatments Decisions From Experience 65
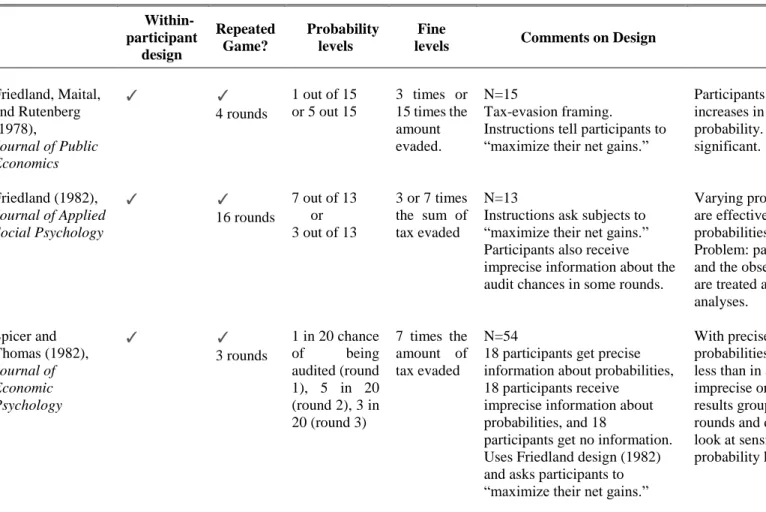
4.6 Review of Experimental Work on Deterrence 70
4.7 Experimental Treatments with Ambiguous Fines and/or Probabilities 77 4.8 Effect of Fine and Probability on Lying with Ambiguity Treatments 79 4.9 Effect of Fine and Probability on Lying with Female 80 4.10 Effect of Fine and Probability on Lying – Restricted Sample I 81 4.11 Effect of Fine and Probability on Lying – Restricted Sample II 82 4.12 Effect of Fine and Probability on Lying with Treatment Dummies 83 4.13 Effect of Fine and Probability on Lying – Within-Probability Treatments 84 4.14 Effect of Fine Probability on Lying – Within-Fine Treatments 85 4.15 Lying over Time – Effect of Fine and Probability on Lying 86 4.16 Lying over Time – Effect of Fine and Probability on Lying with Treatment
Dummies 88
4.17 Lying over Time – Effect of Fine and Probability on Lying By Round 90
1
Chapter 1 Introduction
People frequently break rules. Such rule-breaking behavior is manifold. Not only does it manifest itself in unethical behavior, such as the violation of legal or moral standards, but also in innovating behavior, when e.g., existing conventions and habits are overcome. Consequently, depending on the situation and environment, rule-breaking may be either strictly condemned or highly socially approved. This thesis deals with the investigation and identification of the behavioral mechanisms underlying these two distinct classes of rule-breaking behavior.
In today’s economy, innovation is an essential determinant of an organization’s competitiveness and economic success. Hence, generating creative ideas and finding unorthodox approaches to existing problems is becoming increasingly relevant and understanding how to facilitate this idea generation process is clearly important. We therefore study how creative performance can be fostered, in particular focusing on two factors – incentives and expertise – and their role in individual creative performance (chapter 2 and 3).
However, in many other situations breaking the rules is not associated with productivity enhancements and carries a negative connotation. Examples include tax evasion or lying to achieve a personal advantage. In these cases, rule violating behavior is considered detrimental, because individuals, organizations or society as a whole may be harmed. Since such unethical behavior is prevalent in many economic transactions, policy-makers undertake considerable efforts to minimize it. We contribute to these endeavors by investigating the effectiveness of two deterrent mechanisms in reducing unethical behavior. In particular, we systematically vary the size of the fine and the probability of punishment and study their effects on decision-making in the context of lying (chapter 4).
2 Neoclassical economic theory assumes individuals to behave rationally at all times, i.e. they know their preferences, are perfectly informed and maximize their personal benefit. With the help of insights from psychology, sociology and, more recently, neuroscience behavioral economics identifies systematic deviations from these behavioral assumptions of decision-making and incorporates those findings into economic models. The goal is to provide a more realistic foundation of human decision-making in order to increase the explanatory power of economic analyses.
Empirical investigations of human behavior have been at the heart of behavioral economics and typically involve the use of experiments. Experiments are one widely applied methodology within the social sciences and can be regarded as a major source of knowledge that complements other sources such as theory or field data (Falk and Heckmann 2009). Experiments can be roughly divided into three categories. Laboratory experiments, field experiments and experiments on Amazon’s Mechanical Turk marketplace (Mturk) (for a more detailed taxonomy see Harrison and List 2004). Laboratory experiments allow for a tight control of the decision environment, a fact that is hard to obtain in natural occurring settings. This is important because together with the exogenous assignment to treatment and control conditions, it allows to draw inference about the causal relationship of interest. In recent years, experiments on the internet platform Mturk have become increasingly popular as a source for recruiting participants for experiments. Compared to laboratory experiments, experiments on Mturk have the disadvantage that control of the decision environment is less tight. However, the subject pool is typically more diverse and due to technical ease a high number of subjects can be recruited within a short time period. Field experiments have the great benefit that they occur in the natural environment of the participants where they do not know that they are part of an experiment. Therefore, the external validity is highest in field experiments. In all chapters of this thesis we use experiments as a common element. However, depending on the best fit for answering our research questions we apply different experimental approaches and use either laboratory experiments, field experiments or experiments on Mturk.
In Chapter 2 we are interested in the effect of piece-rate incentives on idea generation.1 While recent economic research has made great advancements in understanding the effect of incentives on performance in routine tasks (see e.g., Prendergast 1999, Lazear 2000), we know surprisingly little about the effectiveness of incentives on performance in creative tasks. There are some indications that the assumptions traditionally made in economic theory regarding the effect of
1 Chapter 2 is joint work with Marina Schröder and based on Laske and Schröder (2018).
3 incentives on performance may not hold for creative tasks. For example, one important difference between both task types is their quality requirement: in routine tasks, quality is typically defined by the usefulness of a product for its predefined purpose. For these tasks, firms try to design incentives such that they achieve a high number of output units that meet a certain usefulness threshold. Creative products, however, in addition to being useful must also be original. Thus, for creative tasks the quality dimension is multi-dimensional involving both a usefulness and an originality dimension. To study whether the effect of piece-rate incentives may play out differently for creative tasks compared to routine tasks, we developed a new real-effort task that allows us to objectively measure three different dimensions of creative performance separately. These dimensions are quantity, usefulness and originality of the generated ideas. Between treatments, we vary whether piece-rate incentives are implemented and whether these are weighted by a quality component which either rewards usefulness or originality. We compare the results to a baseline with a fixed payment.
We observe that piece-rate incentives per se - whether weighted or not - result in an increase in the number of good (useful and original) ideas compared to a fixed wage. This positive effect of incentives is due to an increase in the overall number of ideas and to an increase in the variance of the quality of ideas. The higher the variance, the more likely it is that an individual comes up with an extraordinarily good idea. However, adding a usefulness-weighting component to the incentive scheme (paying workers according to how useful an idea is) reduces the positive effects of piece-rate incentives, because it leads to inefficient distortions of effort provision. Workers then focus too much on usefulness at the cost of quantity and originality of their ideas. Adding an originality-weighting to the incentive scheme (paying workers only for ideas that no one came up with before) simply adds complexity to the incentive system without being associated with any benefit.
Our findings provide interesting insights for organizations seeking to incentivize creativity.
They imply that the most efficient way to incentivize idea generation may simply be by paying per idea without any ‘judgement’ regarding the originality or the usefulness of these ideas - even though they desire employees pay attention to multiple dimensions.
Besides heterogeneity in incentives, another factor that may be associated with the creative outcome is the level of an individual’s expertise in the focal field. Some researchers argue that creativity needs knowledge as a source of ideas from which original products can then be generated (Amabile 1998, Cropley 2006). They conclude that people who are familiar with the focal field will be more successful in finding good solutions. A different view, however, argues
4 that experts rely on accustomed habits and think in familiar patterns which may block divergent thinking and reduce average creative performance (Wiley 1998). In chapter 3 we consider the case of outsourcing a creative task in a marketing context and study what is the most efficient way in terms of cost-benefit calculations when a company is in search of a creative solution: hire few expensive experts or many less costly non-experts? Our argument is as follows: even if, on average, experts produce a more creative outcome, average outcome is not the right measure. Since only the best ideas - the positive outliers - matter in creative tasks, it might be better to have more solutions and hire many non-experts than few experts. We explore this hypothesis by conducting a field experiment in which we use a new real-effort task that allows us to derive an objective measure for the quality of ideas. The difference between the two treatments is that experts were obtained via the world’s largest freelancing platform upwork, where independent professionals from all of the world offer their expertise to potential customers and that non-experts consist of members from the platform Mturk.
We observe that for a given budget, hiring many non-experts instead of a few experts is more efficient in our setting. Although experts put significantly more effort into the task, as measured by time, this effort does not translate into better performance. This finding is consistent with the literature on creativity suggesting that creative performance is likely a probabilistic function of quantity (Laske and Schröder 2018). Our results provide a rationale for why an increasing number of firms have chosen to utilize crowdsourcing for idea generation purposes.
In chapter 4, we switch our attention to investigating factors that help to reduce rule violations in situations in which individuals, organizations or society as a whole may be negatively affected.2 Several work has explored ways to prevent unethical behavior focusing on the intrinsic costs to individuals’ self-image that arise from behaving unethically (e.g., Mazar, Amir, and Ariely 2008, Gneezy, Saccardo, Serra-Garcia, and van Veldhuizen 2015). In this paper we take a different approach and study how individuals react to interventions that focus on the extrinsic costs of unethical behavior. The standard economic model of crime (Becker 1968) assumes that the decision whether to perform a crime is similar to a choice of a lottery. There are three possible outcomes: the decision maker can choose not to commit a crime. If she chooses to commit a crime, then either she is successful, or she is caught and punished. In this model, the decision maker calculates her expected utility, weighs the utility of each outcome and the associated probabilities, and commits the crime if the expected utility of doing it is higher than the utility of not performing
2 Chapter 4 is joint work with Silvia Saccardo and based on Laske and Saccardo (2018).
5 the crime. In order to identify what kind of policy would deter unethical behavior effectively, we use a systematic approach based on Becker’s model. We investigate a situation in which participants can lie at another participants’ cost to achieve an economic advantage and vary the size (high or low) and probability (5%, 10%, 25% or 50%) of punishment to study how these two factors affect unethical behavior in everyday life.
In all our one-shot experiments, when individuals are presented with only one set of parameters and are asked to make a decision only once, we find that lying decreases with the size of the fine.
However, individuals are insensitive to changes in detection probabilities. Why is that the case?
In two additional experiments, we show that sensitivity to detection probabilities only emerges when individuals can directly compare different detection probabilities in a within-participant design, or when they experience the same probability level over time in a repeated setting.
Our findings have several interesting implications: they suggest that harsher fines are likely to be a more successful means of deterrence of small-scale unethical behavior than increasing the probability of detection. Sanctions that are based on increases in detection probability may work under two conditions: First, providing individuals with a reference point could potentially increase the sensitivity to probabilities because this enables them to compare different probability levels.
For example, instead of simply announcing a given detection probability, informing people that their chance of being audited has increased may help them to incorporate detection likelihoods into their decision. Second, such deterrence policies are likely to be effective for reducing unethical behavior in situations in which individuals receive frequent feedback on the outcome and likelihood of being audited. One example may be fare evasion in public transportation.
However, such policies may be less effective in deterring unethical behavior when detection probabilities can only be presented via a description and feedback is rare, such as small-scale tax evasion.
6
Chapter 2
Quality through Quantity - The
Effects of Piece-Rate Incentives on Creative Performance
“The best way to have a good idea is to have many ideas” (Linus Pauling)
2.1 Introduction
Creativity is among the most important, yet least understood factors that influence economic success. As a reaction to constant technological change and fierce competition, organizations are forced to permanently generate creative ideas to drive innovation. Hence, it is not surprising that fostering creativity is consistently rated as a primary concern of global top managers (see e.g., The Conference Board 2012, 2013, 2014). The important question is what organizations can do to successfully foster creativity. Despite its importance, there is very limited research on this topic.
One reason for the scarcity of research is that creativity is notoriously difficult to define and to quantify. In this paper, we define creativity from a functional problem solving perspective, where good creative ideas must be both useful for a predefined purpose and original (Cropley and Cropley 2008). In our approach usefulness refers to the extent to which an idea meets the functional requirements of a task. Originality refers to the statistical infrequencies of an idea. We introduce a novel experimental design, which involves clearly defined and quantifiable performance indicators for these dimensions and study the effect of piece-rate incentives on idea generation.
7 While recent economic research has made advancements in understanding the effect of incentives on performance in routine tasks (see e.g., Prendergast 1999, Lazear 2000, Laffont and Martimort 2009, Gneezy, Meier, and Rey-Biel 2011), we know surprisingly little about the effectiveness of incentives on performance in creative tasks. There are some indications that the assumptions traditionally made in economic theory regarding the effect of incentives on performance may not hold for creative tasks. Consequently, the effect of incentives may play out differently for creative tasks compared to routine tasks. For example, intrinsic motivation is often considered to play a special role for creative performance. It has been claimed that intrinsic motivation will be conducive to creative work, while extrinsic incentives such as performance pay may be detrimental (see e.g., Amabile 1996). Furthermore, the effort-performance relation seems to be different for creative tasks compared to simple routine tasks. Unlike most other desirable workplace behaviors, effort provided for creativity does not necessarily always translate into better performance (Amabile 1996, Erat and Gneezy 2016). Additionally, pressure induced by incentives may actually undermine creative performance (Ariely, Gneezy, Loewenstein, and Mazar 2009, Azoulay, Zivin, and Manso 2011, Gross 2016). Another specificity distinguishing creative tasks from many routine tasks is the lack of clear definitions and objective measures. In the absence of a clear definition and objective measures, individuals may do not know what is expected from them and thus may, even if they wanted to, not be able to react to incentives (Byron and Khazanchi 2012, Charness and Grieco forthcoming). Furthermore, the lack of objective measures may lead to (strategic) distortions in the evaluation of creative performance, which potentially further undermines the effectiveness of incentives (Bradler, Neckermann, and Warnke forthcoming, Balietti, Goldstone, and Helbing 2016, Petters and Schröder 2017). Finally and importantly, the quality requirements for creative tasks are different from those for routine tasks. In routine tasks, quality is typically defined by the usefulness of a product for its predefined purpose. For these tasks, firms typically try to design incentives such that they achieve a high number of output units that meet a certain usefulness threshold. In addition to being useful, creative products must also be original. Hence, for creative tasks the quality dimension is multi-dimensional involving both a usefulness and an originality dimension. Firms therefore should seek to design incentive schemes for fostering creativity in a way that employees generate a high number of outliers which are at the same time highly useful and original. In our approach to understanding the effect of piece-rate incentives on creative performance, we focus on this special multi-dimensional characteristic, which is likely to have an influence on how incentives affect creative performance.
8 According to multi-tasking theory (see e.g., Holmstrom and Milgrom 1991, Lazear 2000), incentives in multi-dimensional contexts may entail undesirable distortion effects. The theory predicts that with the introduction of performance related incentives, individuals will focus on the productivity dimensions that can be easily measured and may reduce their effort in the productivity dimensions, which are not measured and thus provide lower returns for the agent. Recent empirical work shows evidence for such distortion effects in contexts involving a quantity and a one- dimensional quality measure (see Kachelmeier Reichert, and Williamson 2008, Hossain and List 2012). To the best of our knowledge, we are the first to focus on the multi-dimensional characteristic of quality measures for creative tasks.
In this paper, we contribute to the research on creativity by studying the effect of piece-rate incentives on performance in an idea generation task where usefulness and originality of creative ideas can be measured separately and objectively. Previous experimental research on the effect of piece-rate incentives on creative performance has led to inconclusive results. While some experimental studies find no effect of piece-rate incentives on creative performance (Eckartz, Kirchkamp, and Schunk 2012, Erat and Gneezy 2016) other studies find a positive impact (Kachelmeier, Reichert, and Williamson 2008). In this paper, we aim to provide further insights by focusing on the special multi-dimensional characteristic of creative work. This allows us not only to assess if and when incentives work, but also to provide novel insights into the mechanisms through which incentives affect creative performance.
We introduce a novel experimental design, in which participants are asked to illustrate words with the help of a given set of materials. They are instructed to create as many illustrations as possible (quantity) that can be recognized by independent raters (usefulness), and that are statistically infrequent (originality). In the task, participants do not receive a list or any specifications of words to illustrate or how to use the provided materials. Hence, they have to come up with both the words they want to illustrate and a way of how to illustrate these words.
Between treatments, we vary whether piece-rate incentives are introduced and whether these are weighted by the usefulness or originality of ideas. We compare the results to a baseline with a fixed payment. The advantage of this experimental design is that we can establish objective creativity measures in a domain where this has so far been challenging. Furthermore, the experimental approach allows us to isolate the behavioral effect of creativity-based compensation under otherwise identical conditions.
We find that piece-rate incentives have a positive and significant effect on the number of high quality (useful and original) creative ideas, if designed appropriately. We uncover two channels
9 for these positive effects: first, piece-rate incentives lead to an increase in the number of ideas generated; second, piece-rate incentives lead to an increase in the variance of the quality of ideas.
The higher the variance, the more likely it is that an individual comes up with an extraordinarily good idea. However, we show that piece-rate incentives that reward quantity and usefulness can lead to an inefficient distortion in effort provision where participants focus too much on usefulness at the cost of quantity and originality.
Overall, we show that the special multi-dimensional characteristic of creative tasks is crucial to understand the effect of incentives on creative performance. Our results suggest that piece-rate incentives can work to foster creativity, but that organizations seeking to incentivize creative performance can be better off avoiding ‘judgmental’ incentives where the level of reward depends on the usefulness of ideas.
2.2 Experimental Design and Procedure
2.2.1 The Task
We propose a novel experimental design that allows for an objective assessment of performance in three dimensions of creativity, i.e. quantity, usefulness and originality. In this experimental design, we ask participants to illustrate words using several simple materials. The set of materials provided for each participant consists of one string, two O-rings, four wooden sticks, and twelve colored glass pebbles (see Figure 2.1 left picture). Participants can use some or all of these materials to illustrate words (see Figure 2.2 for example illustrations). Participants do not receive a list or any specifications of words to illustrate or how to use the provided materials; hence, in this task, they have to come up with both the words they want to illustrate and a way of illustrating these words. They can illustrate as many words as they want within a period of 20 minutes. After finishing an illustration, participants are instructed to take a picture using a pre-installed camera and to type in the illustrated word.1 The advantage of the task is that it allows us to objectively measure multiple dimensions of participants’ creative performance.
1A detailed description of how lab participants took a picture of an illustration is given in Appendix B.
10 FIGURE 2.1:SET OF MATERIALS AND EXPERIMENTAL SETUP
We measure quantity as the number of different words illustrated. That is, a participant scores high in this dimension if she illustrates a high number of different words. We directed participants to only illustrate single words (e.g., “tree”, “face”), to illustrate each word only once, and informed them that they are not allowed to use or illustrate any symbol found on the keyboard (e.g., “!”,
“8”, “b”, “@”, “>” “+”). Illustrations of phrases consisting of more than one word (e.g., “tree in the woods”, “happy face”), multiple illustrations of the same word (e.g., two different illustrations of the word “house”), and illustrations including symbols from the keyboard (e.g., using “8” to illustrate the word “eight”) were not valid. We instructed participants about these rules and informed them that illustrations violating these rules would not be considered for payment. See Appendix B for the instructions.
To measure the usefulness of each valid illustration, we elicit the recognition rate by external raters through an online survey, which was conducted two weeks after the lab experiment. In this online survey, raters are provided with pictures of the illustrations from the lab experiment and are asked to type in the exact word that is illustrated.2 We incentivize answers in this online survey by rewarding online raters €0.10 for each correct answer, which is defined as an exact match of a word illustrated by a lab participant and the answer by the online participant. See Appendix C for the instructions of the online survey and a screenshot of the online survey. Raters in the online survey did not take part in any previous related experiments and were blind to treatments. Each illustration was rated by at least ten online raters, and each rater rated a random sample of 50 illustrations.3 For each illustration, we derive usefulness as the fraction of raters who correctly
2 In the assessment of usefulness, we did not account for synonyms since we explicitly informed participants of both the lab experiment and the online survey in the instructions that only the exact match of the illustrated word by the lab participant and the answer by the online rater will be considered for payment. Spelling errors were not corrected. The special characters ä, ö, ü and ß were standardized to ae, oe, ue and ss, respectively. Capitalization of letters was not taken into account.
3We restricted the sample to 50 illustrations per rater to avoid overload of the raters.
11 identified the illustrated word. For instance, if 10 out of 10 raters recognize an illustrated word correctly, it would receive the highest usefulness score of 1. An illustration that is only identified by 1 out of 10 raters receives a usefulness score of 0.1. See Figure 2.2 (left column) for examples of high and low usefulness illustrations.
FIGURE 2.2:EXAMPLES OF ILLUSTRATIONS
We measure originality as the statistical infrequency of an illustrated word within the entire experiment. Specifically, we derive the originality of an illustration as the ratio of 1 and the number of times the same word is illustrated in the sample. For instance, a word that is illustrated once in the whole experiment, such as “tennis,” receives the highest originality score of 1. A word that is illustrated many times, such as “house”, which was illustrated 82 times, receives a low score of
HIGH USEFULNESS ILLUSTRATION
illustrated word: dog usefulness: 1 originality: 0.17
HIGH ORIGINALITY ILLUSTRATION
illustrated word: tennis usefulness: 0.9 originality: 1 LOW USEFULNESS ILLUSTRATION
illustrated word: pig usefulness: 0 originality: 0.33
LOW ORIGINALITY ILLUSTRATION
illustrated word: house usefulness: 1
originality: 0.01
12 0.012. See Figure 2.2 (right column) for examples of illustrations that scored high or low on originality.
Since only ideas that are at the same time highly useful and original can potentially result in innovation (economic implementation of an idea), we define the quality of an illustration as the product of usefulness and originality. In the later analysis, we focus on good ideas - those ideas where quality rates above or equal to the 75th percentile of all ideas with the baseline as reference group and on excellent ideas - those ideas where quality rates above or equal to the 90th percentile of all ideas in the baseline.
2.2.2 Treatments
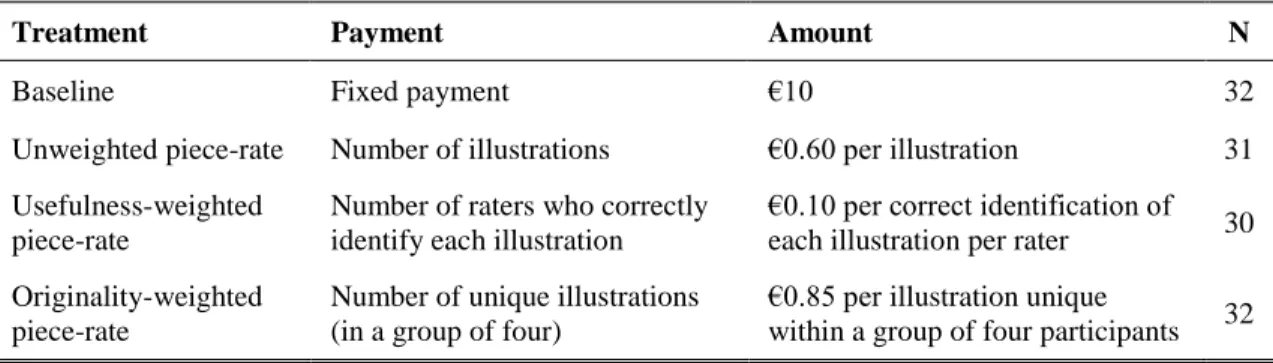
Between treatments, we vary whether piece-rate incentives are implemented and whether these are weighted by a quality component which either rewards usefulness or originality. In the baseline treatment, all participants receive a €10 fixed payment, independent of their performance. After conducting the baseline treatment, we calibrated the size of the piece-rate incentives for the three treatments based on the performance in the baseline experiment. That is, given the performance in the baseline treatment, average payment would have been equal in all three treatments.
In the unweighted piece-rate treatment, participants are paid based on the number of words illustrated. For each illustration, they receive €0.60. In the usefulness-weighted piece-rate treatment, the piece-rate paid for an illustration depends on the number of raters who correctly identify the illustrated word. All illustrations are rated by 10 incentivized raters. For each illustration, participants in the usefulness-weighted piece-rate treatment receive €0.10 per rater who correctly identifies the illustrated word. Finally, in the originality-weighted piece-rate treatment, participants are paid based on the number of illustrations that are unique within a group of four participants.4 For each illustration of a word that has not been illustrated by another participant in the randomly assigned group of four participants, participants receive €0.85.
Except for the description of the incentive scheme, all participants in our experiment receive the same information about the relevant dimensions of productivity and their measurement. Table 2.1 summarizes the treatments in our experiment and the number of participants in each of the treatments.5
4We used uniqueness within a group of four instead of originality as an incentive measure because of procedural reasons in running the experiment. However, this design element should not have an effect on subject’s strategic considerations.
5For our analysis, we excluded one observation from the unweighted piece-rate treatment, because this participant only generated invalid illustrations.
13 TABLE 2.1:EXPERIMENTAL TREATMENTS
Treatment Payment Amount N
Baseline Fixed payment €10 32
Unweighted piece-rate Number of illustrations €0.60 per illustration 31 Usefulness-weighted
piece-rate
Number of raters who correctly identify each illustration
€0.10 per correct identification of each illustration per rater 30 Originality-weighted
piece-rate
Number of unique illustrations (in a group of four)
€0.85 per illustration unique
within a group of four participants 32
2.2.3 Procedural Details
The experiment was conducted at the Cologne Laboratory for Economic Research at the University of Cologne. Participants were recruited with the online recruiting system ORSEE (Greiner 2004). We ran eight sessions in May 2014, with two sessions for each treatment condition. Participants were randomly seated in separated cubicles in the lab. To inform participants about the task, they received written instructions, which were read aloud by the experimenter. After the experimenter had answered all questions individually, the set of materials was handed to the participants. All illustrations of words had to be placed within a designated area on the desks. We told participants to place all materials that were not used for the illustration outside this area. Additionally, participants were instructed not to use any materials other than those provided by the experimenter. Once a participant made an illustration, she pressed a button on the screen of the computer so that the software would automatically take a picture of the designated area including the illustration. If participants were satisfied with the picture, they were asked to type in the word that they had illustrated and could then proceed with their next illustration. If they were not satisfied, participants could take another picture before proceeding.
Figure 2.1 (right side) illustrates the cubicle in the laboratory, including the designated area in which participants provided illustrations and the web cam taking the pictures. As soon as the working time of 20 minutes was over, the experimental software automatically stopped and then initiated a questionnaire with some general demographic questions.
On average, each session lasted 40 minutes, and the average payoff was €14.43. The final payoff for each participant consisted of the money earned during the experiment and a standard show-up fee of €2.50. In all treatments, the money was paid out two weeks after the experiment, and participants could choose whether they preferred to collect the money in cash at the university or have it transferred directly to their bank account.
14 For the online survey, we recruited 540 participants from the same subject pool via ORSEE (Greiner 2004) and excluded participants who had previously taken part in the lab experiment.
The online survey lasted about 20 minutes, and the average earnings were €4.50, including a €2.00 show-up fee. As in the lab experiment, participants had a choice between collecting the money in cash or a bank transfer.
2.3 Results
As a first step of our analysis, we study if piece-rate incentives work for creative tasks. To assess the success of the different incentive schemes, in Figure 2.3 we focus on the number of high quality ideas, where quality is defined as the product of usefulness and originality. By the term high quality ideas we subsume good and excellent ideas. Good ideas are classified by the average number of ideas above the 75th percentile of the product of usefulness and originality with the baseline as reference group. Excellent ideas are classified by the average number of ideas above the 90th percentile of the product of usefulness and originality with the baseline as the reference group for each of the treatments. The average number of good and excellent ideas from the baseline which does not involve piece-rate incentives is indicated by the solid black line.
Notes: Solid line indicates the average number of ideas in the baseline. Stars indicate the results from a two-tailed U-test *** p<0.01,
** p<0.05, * p≤0.1, n.s. not significant.
FIGURE 2.3:NUMBER OF HIGH QUALITY IDEAS BY TREATMENT
When we introduced piece-rate incentives in general (unweighted and weighted), participants reacted by producing a higher number of good ideas. This increase is only significantly for the
15 unweighted- and originality-weighted piece-rate incentives (pairwise U-test, p<0.016). We find very similar results, however on a lower level, when focusing on excellent ideas7
Result 1 The introduction of piece-rate incentives increases the number of good and excellent creative ideas, but this positive effect is reduced if piece-rates are usefulness-weighted.
Above we showed that piece-rate incentives can work, if designed appropriately. Next, we want to investigate through which channel incentives affect creative performance. As a first step, we focus on the average performance in the separate dimensions of creativity, i.e. on quantity, usefulness and originality. Table 2.2 reports the results of regression analysis exploring the effect of incentives on the three dimensions separately. Starting with quantity, columns 1 and 2 show the results on the overall number of illustrations per participant. In the model in column 1, we include a dummy for piece-rate incentives, which is equal to one whenever any form of piece-rate incentives (unweighted or weighted) is applied. Additionally, we control for whether a usefulness- weighting or an originality-weighting is implemented. The reference group is the baseline with fixed pay. We find that piece-rate incentives per se significantly increase the number of ideas generated. In particular, participants under a piece-rate scheme on average come up with about 9.5 ideas more compared to those receiving fixed pay. However, when a usefulness-weighting is added to the piece-rate incentive, this positive effect is strongly mitigated and participants on average submit only about 1.5 more ideas. This net effect is no longer different from zero (Wald test, p=0.42). Adding an originality-weighting to the incentive scheme does not have a significant effect on the number of ideas generated. Changes in performance in one dimension of creativity could be due to an incentive effect (increase in overall effort provided) or due to a distortion effect where individuals shift effort from one dimension to the other (see e.g., Holmstrom and Milgrom 1991).
To control for such possible distortion effects, we add controls for productivity in the other dimensions of creativity in column 2 (i.e., controls for the average usefulness and the average originality of illustrations). Including these controls in the model, the coefficient for piece-rate incentives remains significant, but significantly reduces its size by 21 percent (2-test, p<0.05).
This suggests that introducing piece-rate incentives increases the quantity of ideas in large part
6We report two-sided p-values in the entire paper.
7To test whether our quality measure as the product of usefulness and originality actually captures the perceived quality of creative ideas, we also assess a subjective quality measure through an online-questionnaire. Our findings are robust to using this subjective measure in order to derive good and excellent ideas (see Appendix A).
16 through an incentive effect and to a smaller degree also through a distortion effect. The coefficient indicating a negative effect on quantity when a usefulness-weighting is implemented decreases by 32 percent as soon as we control for performance in the other dimensions (2-test, p<0.05), but remains significantly negative. Hence, adding a usefulness-weighting to the incentive scheme leads to an additional distortion of effort but also reduces the incentive effect of piece-rate incentives.
TABLE 2.2:EFFECT OF PIECE-RATES ON SEPARATE DIMENSIONS OF CREATIVITY Dependent
variable: Quantity (Avg.) Usefulness (Avg.) Originality
(1) (2) (3) (4) (5) (6)
Piece-rate in general
9.467*** 7.469*** -0.080** -0.024 0.036 -0.018 (2.427) (2.289) (0.038) (0.022) (0.040) (0.025) Piece-rate with
usefulness- weighting
-8.031*** -5.423*** 0.114*** 0.030 -0.085** -0.010 (2.240) (1.908) (0.035) (0.023) (0.035) (0.021) Piece-rate with
originality- weighting
-1.256 -0.419 0.038 0.020 -0.027 -0.005
(2.471) (2.263) (0.033) (0.019) (0.034) (0.022)
Female -2.556 0.298 0.131*** 0.064*** -0.090*** -0.022
(1.771) (1.738) (0.026) (0.016) (0.025) (0.015)
Quantity -0.003*** 0.002
(0.001) (0.001)
(Avg.) Usefulness -30.887*** -0.541***
(7.205) (0.019)
(Avg.) Originality -10.241 -0.608***
(11.753) (0.019)
Constant 18.042*** 34.921*** 0.440*** 0.688*** 0.298*** 0.506***
(1.693) (6.042) (0.027) (0.025) (0.031) (0.037)
Observations 125 125 2,648 2,648 2,648 2,648
Clusters 125 125 125 125
R2 0.193 0.316
Notes: Columns (1) and (2) report OLS regressions with robust standard errors in parentheses. Columns (3)-(6) report random effects regression models with robust standard errors clustered on individual level. The dependent variable in columns (1) and (2) is a continuous variable indicating the overall number of illustrations produced, in columns (3) and (4) it is a continuous variable between 0 and 1 indicating the average usefulness of an illustration; in columns (5) and (6) it is a continuous variable between 0 and 1 indicating the average originality of an illustration. Piece-rate in general is a dummy variable coded as 1 whenever piece-rate incentives are introduced (unweighted or weighted). Piece-rates with usefulness-weighting and piece-rates with originality-weighting are equal to 1 in the corresponding treatments involving this weighting. Female is a dummy variable coded as 1 if the participant was a woman, and zero otherwise. In columns (1) and (2) we control for average usefulness and average originality on individual level, in columns (3) and (4) we control for the overall number of illustrations and the average originality on illustration level and in columns (5) and (6) we control for the overall number of illustrations and the average usefulness on illustration level. Reference group is the baseline with fixed pay. The stars indicate significance levels: * p-value<0.1, ** p-value<0.05, *** p-value<0.01.
Columns 3 and 4 display the results of a random effects regression model, with average usefulness as the dependent variable. In these models related to usefulness and in the following
17 models related to originality (columns 5 and 6), we focus on results on illustration level. Column 3 reveals a significant decrease in average usefulness whenever piece-rate incentives are present.
Putting this into perspective, on a scale from 0 to 1, the average usefulness per illustration drops by about 0.08 units. Given that the mean usefulness in the baseline is about 0.5, piece-rate incentives result in a 16 percent reduction in the average usefulness of ideas. Adding a usefulness-weighting component compensates for this negative effect of piece-rate incentives. Adding an originality- weighting does not have a significant effect on the average usefulness of ideas. As above, in column 4 we additionally control for performance in the other dimensions of creativity to test for the relevance of distortion effects. Adding these controls, we no longer observe any significant treatment effects. This suggests that the observed effects on usefulness seem to be driven by a distortion of effort rather than an increase in overall effort provision.
Columns 5 and 6 display the results of a random effects regression model with average originality of an illustration as the dependent variable. We find no significant effect of piece-rate incentives on originality. However, we observe that interacted with a usefulness-weighting of piece-rate incentives significantly decreases the likelihood that an idea is original by 8.5 percentage points.
Surprisingly, an originality-weighting does not have any significant effect on the average originality of ideas. We conjecture that individuals may not be able to increase originality just by trying harder. Controlling for performance in the other dimensions of creativity (column 6) reveals that the negative effect of the usefulness-weighting seems to be driven by a distortion of effort.
Result 2 Piece-rate incentives per se increase the number of ideas and decrease the average usefulness of ideas generated. Adding a usefulness-weighting results in a distortion of effort, which leads to an increase in average usefulness but a decrease in quantity and average originality of ideas. Adding an originality-weighting does not have a significant effect on the performance in the separate dimensions of creativity.
Unlike in routine tasks where high quality is typically characterized by a high average usefulness and/or a low scrap rates, in creative idea generation tasks it is typically only the positive outliers that are relevant. Consider for example a company looking for a new slogan to advertise a new product. Only ideas that are positive outliers have a chance to lead to successful marketing, while ideas of average or low quality are irrelevant. To study the effect of incentives on the likelihood of finding such outliers, we focus on the within-subject standard deviations in the quality of ideas.
In the baseline, the average within-subject standard deviation in the quality is equal to 0.056, while
18 it is equal to 0.077, 0.075 and 0.073 in the unweighted piece-rate, usefulness-weighted piece-rate and originality-weighted piece-rate treatments, respectively. We find that the standard deviations in quality are significantly larger for all treatments involving piece-rate incentives compared to the baseline (pairwise U-test, p<0.07), but that there are no significant differences in the standard deviations in quality between the three treatments involving piece-rate (pairwise U-test, p>0.50).
Result 3 Piece-rate incentives increase the variance of the quality of ideas an individual generates.
Finally, we want to bring together the previous findings and test how relevant the performance in the separate dimensions of creativity and the variance in creative performance are to explain the observed effects of piece-rate incentives. Table 2.3 provides the results of an OLS regression with the number of good ideas in columns 1-3 and the number of excellent ideas in columns 4-7 as dependent variables.8 Column 1 presents a model for the number of good ideas controlling for whether piece-rate incentives are present and whether a quality-weighting (either usefulness- weighting or originality-weighting) is implemented. In line with the non-parametric analysis above, we find that compared to the baseline with fixed wage, participants respond to piece-rate incentives by generating on average about 2.3 more good ideas. Adding a usefulness-weighting to the incentive scheme, however, significantly reduces this number to 1.1 more good ideas, while adding an originality-weighting does not have a significant effect on the generated number of good ideas. In the model in column 2, we include controls for the average performance in the separate dimensions of creativity and find that they are highly predictive for the number of good ideas.
Consequently, the coefficient for piece-rate incentives, while remaining significant, substantially decreases by more than 60 percent when these controls are introduced (2-test, p<0.01). When adding these controls, the coefficient for the usefulness-weighting is no longer significantly different from zero. Thus, the negative effect of adding a usefulness-weighting to a piece-rate incentive scheme seems to be due to the distortion effect that this weighting has on average performance in the separate dimensions of creativity. In the model in column 3 we control for the variance in quality. We find that this variance is highly predictive on the number of good ideas.
8The following findings are robust to some differences in the specification. First, the result is robust to changes in the threshold used to classify ideas as either good or excellent. We have conducted the same analysis with a threshold of 0.65, 0.70, 0.80, 0.85 and 0.95 and the results remain qualitatively the same. Second, the main results remain stable if we use a non-linear poisson model for the regression.
19 When adding this variable, the coefficient for piece-rate incentives is no longer significantly different from zero, suggesting that the positive effect of piece-rate incentives on the number of good ideas can be partly explained by an increase in the performance in the separate dimensions of creativity and partly explained by an increase in the variance of the quality of generated ideas.
TABLE 2.3:EFFECT OF PIECE-RATES ON NUMBER OF HIGH QUALITY ILLUSTRATIONS Dependent variable: No. of good ideas No. of excellent ideas
(1) (2) (3) (4) (5) (6)
Piece-rate in general 2.271*** 0.905* 0.331 1.496*** 0.898** 0.255 (0.617) (0.518) (0.521) (0.487) (0.437) (0.398) Piece-rate with
usefulness-weighting
-1.165* 0.00135 0.0250 -0.718 -0.0385 0.0217 (0.668) (0.541) (0.524) (0.553) (0.476) (0.430) Piece-rate with
originality-weighting
0.231 0.323 0.409 -0.0777 -0.0231 0.0884 (0.738) (0.547) (0.516) (0.576) (0.482) (0.425)
Female -0.414 -0.577 -0.512 -0.276 -0.460 -0.334
(0.478) (0.396) (0.363) (0.383) (0.354) (0.285)
Quantity 0.215*** 0.205*** 0.126*** 0.112***
(0.0339) (0.0285) (0.0306) (0.0228)
(Avg.) Usefulness 11.70*** 6.962*** 11.14*** 5.654***
(2.171) (2.265) (1.867) (1.905)
(Avg.) Originality 8.957*** 3.617 10.92*** 5.409**
(2.241) (2.609) (2.086) (2.210)
Standard deviation in innovation
19.65*** 21.99***
(5.197) (4.070)
Constant 4.100*** -7.706*** -4.839*** 2.161*** -8.385*** -5.166***
(0.477) (1.842) (1.772) (0.388) (1.652) (1.493)
Observations 125 125 123 125 125 123
R2 0.122 0.504 0.551 0.074 0.419 0.563
Notes: Robust standard errors in parentheses. The dependent variable in columns (1)-(3) is number of good ideas (quality ≥75th percentile) and in columns (4)-(6) it is number of excellent ideas (quality≥ 90th percentile). Piece-rate in general is a dummy variable coded as 1 whenever piece-rate incentives are introduced (unweighted or weighted). Piece-rates with usefulness-weighting and piece- rates with originality-weighting are equal to 1 in the corresponding treatments involving this weighting. Female is a dummy variable coded as 1 if the participant was a woman, and zero otherwise. In columns (2), (3), (4) and (5) we control for the overall number of illustrations, average usefulness and average originality on individual level, Reference group is the baseline with fixed pay. The stars indicate significance levels: * p-value<0.1, ** p-value<0.05, *** p-value<0.01.
The models in columns 4 to 6 provide results for the number of excellent ideas. Generally, these results mirror the results for good ideas (columns 1 to 3). Again, we observe that participants come up with about 1.5 more excellent ideas when they are confronted with piece-rate incentives. Adding a usefulness-weighting to the incentive scheme slightly decreases this positive effect but not significantly so. Adding an originality-weighting does not have a significant effect on the number
20 of excellent ideas. As above, we control for the average performance in the separate dimensions of productivity in the model in column 5. Again, we find that average performance in the separate dimensions of creativity is highly predictive for the number of excellent ideas and that adding these controls substantially reduces the coefficient for piece-rate incentives by about 40 percent (2-test, p<0.1). Again, we observe a residual positive effect of piece-rate incentives, which is explained by an increased variance in the quality of ideas (column 6).
Result 4 Piece-rate incentives affect creative performance both through a change in performance in the separate dimensions of creativity (i.e. quantity, usefulness and originality) and due to an increase in the variance of the quality of ideas.
2.4 Conclusion
The relevance of creativity as a driving force of economic growth raises the question of which factors influence creative performance. In this study, we examine the effect of piece-rate incentives on creative idea generation. We find that piece-rate incentives per se have a positive effect on the number of high quality ideas. This effect is due to an increase in the overall number of ideas and an increase in the variance of the quality of ideas generated.
Our results show that quality-weightings of piece-rate incentives are not advisable. Although organizations may be inclined to only pay for useful ideas instead of rewarding their mere number, such a weighting to piece-rate incentives can have a detrimental effect. We observe that adding a usefulness-weighting (i.e. paying workers a piece-rate that depends on how useful an idea is) mitigates the positive effect of piece-rate incentives. The negative effect of this weighting arises because a usefulness weighting leads to a distortion of effort. Participants focus on generating useful ideas, but this concentration on the usefulness entails a reduction in the overall number and in the average originality of ideas generated. Adding an originality-weighting to the piece-rate (i.e.
paying workers only if they come up with ideas that no one had before) solely adds complexity to the incentive system, without bringing a benefit.
In this research project, we provide unique experimental evidence on the effect of incentives on quantity, usefulness and originality of creative ideas. Our results contribute to the understanding of how piece-rate incentives affect creative performance. We show that the special multi- dimensional characteristic of creativity – especially the relevance of simultaneous usefulness and originality of creative ideas – has a substantial impact on the effect of incentives on creativity. To
21 the best of our knowledge, we are the first to reveal distortion effects between the separate quality dimensions of creative performance. Furthermore, we are the first to show that incentives have an impact on the variance in creative performance, which is associated with an increase in creative outliers. More research is needed to fully understand the behavioral mechanisms behind these effects.
Our research provides valuable insights for organizations seeking to incentivize creativity. We demonstrate that incentives can work to increase the number of high quality ideas generated.
However, organizations should be very careful when designing such incentive schemes. Our results suggest that the most efficient way to incentivize idea generation may simply be by paying per idea without any ‘judgement’ regarding the originality or the usefulness of these ideas - even though they desire employees pay attention to multiple dimensions.
22
2.5 Appendix to Chapter 2 A Robustness Check
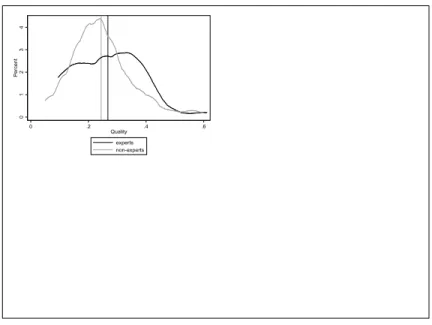
In addition to the objective measures of creativity we elicit a subjective measure for the quality of creative ideas. To obtain this measure, we asked two independent raters who were blind to the treatments to evaluate the creativity of all illustrations on an integer scale from 0 to 100. We derive the subjective quality of an illustration as the mean of these two evaluations. We conduct the same non-parametric analysis using this subjective measure as we did for the objective measure (see Figure 2.4). Using the score from this subjective quality assessments as the dependent variable does not change our results.
Notes: Solid line indicates the average number. of ideas in the baseline. Stars indicate the results from a two-tailed U-test *** p<0.01,
** p<0.05, * p<0.1, n.s. not significant.
FIGURE 2.4:NUMBER OF HIGH QUALITY IDEAS BY TREATMENT (SUBJECTIVE QUALITY MEASURE)
23
B Experimental Instructions for the Lab Experiment
Instructions
(Translation from German) Welcome to this experiment!
Please carefully read the following instructions. If you have any questions, raise your hand. We will come to you and answer your question. Please do not begin the experiment until we ask you to do so. None of the other participants will receive information about your payoff.
Communication with other participants is forbidden throughout the entire experiment. We also request that you switch off your mobile phone and remove it from the desk.
Task. - Immediately before the start of the task, you will receive various materials. The task consists of illustrating words with the provided set of materials. The goal is:
To illustrate as many different words as possible,
Which can be identified by others,
And that the illustrated words are unique, meaning that they were not illustrated by any of the participants in the randomly selected four-person group.
After the experiment, we will evaluate how well you achieved this goal.
Please proceed with the illustration of each word in the following manner:
i. Illustrate the word in the designated area using the provided materials.
ii. Take a picture of the illustrated word.
iii. Enter the word that you illustrated in the field “illustrated word”.
iv. Save the picture by clicking on the “save” button.
i.
24 Please keep the following in mind:
Use only the materials provided.
For each illustrated word, you can use all of the materials or a selection of them.
The illustration of the word should only be placed within the designated area on the sheet of paper (only this area will be captured by the camera).
Make sure that your illustration is made in the correct direction (the sheet is marked “top”
and “bottom”).
Make sure that your hands are not visible in the designated area.
Keep any unused materials outside of the designated area.
Illustrate only one word at a time. This means that the name of the picture should only consist of one word. Terms that consist of multiple words are not permitted and will not be evaluated.
You may only illustrate each word once.
Your illustrations may not include any symbol that is depicted on the keyboard (for example, illustrations that include “”, “8”, “b”, “@”, “>” or “+” are not permitted).
Time. - You have a total of 20 minutes for this task. After this time has expired, we ask you to answer the questionnaire before the end of the experiment.
Payment. - [This part is different with regard to the four treatments of the experiment]
Baseline: You are paid €10 for this task. In addition, you receive a show-up payment of €2.50.
You will receive your payment two weeks after the experiment takes place. You can choose whether you would like to receive an electronic transfer or pick up the payment in cash.
SAVED Your picture will appear here
Take picture illustrated word Save
ii.
iii.
iv ..