on Simple Networks:
Phase Diagrams and Braess Paradox
Inaugural - Dissertation
zur
Erlangung des Doktorgrades
der Mathematisch-Naturwissenschaftlichen Fakult¨at der Universit¨at zu K¨oln
vorgelegt von
Stefan Alexander Bittihn
aus Bad Soden am Taunus
K¨oln, 2018
Tag der letzten m¨ undlichen Pr¨ ufung: 30.11.2018
Das Braess-Paradoxon ist ein kontraintuitives Ph¨anomen, welches in Verkehrsnetzen mit egoistischen Nutzern auftreten kann. Es besagt, dass das Hinzuf¨ ugen einer neuen Straße zu einem Verkehrsnetzwerk unter bestimmten Umst¨anden zu l¨angeren Reisezeiten f¨ ur alle Nutzer f¨ uhren kann. Dies kann wichtige Konsequenzen f¨ ur die Planung neuer und den Ausbau beste- hender Verkehrsnetzwerke haben, da die naive Annahme, dass zus¨atzliche Straßen immer zu einer besseren Verkehrssituation f¨ uhren, nicht immer zutrifft. Um negative Folgen vom Bau neuer Straßen zu verhindern, ist ein detailliertes Verst¨andnis des Paradoxons essenziell. Dies ist insbesondere wichtig, da die Kapazit¨aten der Straßennetzwerke vieler großer St¨adte schon lange erreicht und der Platz f¨ ur den Bau neuer Straßen begrenzt ist.
Trotz vieler Beispiele, welche darauf hindeuten, dass das Paradoxon in echten Straßen- netzwerken auftritt, fehlt ein fundiertes Verst¨andnis dieses Effekts. Die meisten bisherigen Arbeiten zu diesem Thema basierten auf deterministischen mathematischen Modellen, deren Ergebnisse sich nicht direkt auf reale Verkehrsnetze ¨ ubertragen lassen. Darin wurden einige stark vereinfachende Annahmen getroffen. Die Beschreibung des Verkehrsflusses wurde auf Reisezeitfunktionen beschr¨ankt, welche linear mit der Anzahl der Autos auf den Straßen zu- nehmen. Weiterhin wurde angenommen, dass allen Nutzern fehlerfreie Verkehrsinformationen zur Verf¨ ugung stehen und dass sie ihre Routen auf dieser Basis komplett rational w¨ahlen.
In dieser Arbeit wird das Verst¨andnis des Paradoxons auf eine realistischere Basis gehoben.
Dazu werden Netzwerke aus total asymmetrischen Exklusionsprozessen (
” totally asymmetric exclusion process“, TASEP) in Bezug auf das Braess-Paradoxon untersucht. Der TASEP be- schreibt Autos als Teilchen, welche auf einem eindimensionalen Gitter springen. Er ist ein einfaches stochastisches Transportmodell, welches mikroskopische Wechselwirkungen bein- haltet und eine nichtlineare Fluss-Dichte Relation aufweist. Auch Reisezeitfunktionen von TASEPs haben eine ann¨ahernd realistische Form, sie sind monoton wachsend und divergieren bei maximalen Dichten. Der TASEP kann nicht alle Ph¨anomene von echtem Straßenverkehr beschreiben, bildet jedoch viele Effekte ab, welche in vorheriger Forschung oft vernachl¨assigt wurden.
Die Netzwerkstruktur, welche in Braess urspr¨ unglicher Ver¨offentlichung benutzt wurde, wird in verschiedenen Varianten analysiert, wobei der Verkehrsfluss im Netzwerk durch TA- SEPs beschrieben wird. Verschiedene Randbedingungen, Routenwahlverfahren und Dynami- ken werden betrachtet. Zun¨achst werden die Entscheidungen der Nutzer extern festgelegt.
Dies bedeutet, dass die Nutzer nicht intelligent entscheiden, welche Routen sie w¨ahlen, son- dern dass diese extern vorgegeben werden. Durch Vergleiche der Nutzeroptimumszust¨ande ( ” user optimum states“) der Netzwerke mit und ohne neue Straße wird gezeigt, dass das Paradoxon in solchen Netzwerken grunds¨atzlich auftreten kann.
Es wird gezeigt, dass das Braess-Paradoxon in großen Bereichen des Phasenraumes des
Braess-Netzwerkes mit periodischen Randbedingungen und zuf¨allig-sequentieller Dynamik
auftritt. Verkehrsstillst¨ande k¨onnen in großen Bereichen des Phasenraumes gefunden wer-
des Phasenraumes starke Fluktuationen in den Reisezeiten zu beobachten.
Unerwartete Phasen, in welchen das System potentiell zwischen nicht-stabilen Zust¨anden oszilliert k¨onnen bei offenen Randbedingungen und zuf¨allig-sequentieller Dynamik festgestellt werden. Das Braess-Paradoxon wird hier indirekt beobachtet, da eine resultierende Zunahme der Reisezeiten erwartet wird, falls dieses System von
” intelligenten“ Teilchen genutzt wird.
Die Untersuchung der Netzwerke wird komplizierter, wenn parallele statt zuf¨allig-sequentieller Dynamik verwendet wird. In diesem Fall werden Ampeln eingesetzt um potentielle Konflikte an Kreuzungen zu vermeiden. Das Braess-Paradoxon tritt auch in diesem Fall auf.
Zus¨atzlich zu der Erkenntnis, dass das Braess-Paradoxon in TASEP Netzwerken beobach- tet werden kann, werden Phasendiagramme f¨ ur alle untersuchten Varianten des Netzwerkes pr¨asentiert, welche die Auswirkungen des Hinzuf¨ ugens einer neuen Straße detaillierter be- schreiben.
Das Braess-Paradoxon tritt auch auf, wenn Teilchen ihre Routen individuell intelligent w¨ahlen. Im zweiten Teil der Arbeit wird ein Routenwahlalgorithmus implementiert und am Beispiel des Braess-Netzwerkes mit periodischen Randbedingungen getestet. Verschiedene Ar- ten von Verkehrsinformationen werden als Grundlage des Algorithmus genutzt und alle Teil- chen w¨ahlen ihre Route individuell darauf basierend. Das Paradoxon tritt auf, wenn Teilchen Entscheidungen basierend auf ihren eigenen Erfahrungen treffen. Es tritt ebenfalls auf, wenn die Entscheidungen auf Absch¨atzungen zuk¨ unftiger Reisezeiten basieren, welche f¨ ur alle Teil- chen zug¨anglich sind. Diese Absch¨atzungen werden auf Basis der aktuellen Positionen aller Teilchen im System berechnet. Dies kann als N¨aherung von Verkehrsinformationen, wie sie von Smartphone-Apps zur Verf¨ ugung gestellt werden, verstanden werden. Es wird weiter- hin gezeigt, dass das Paradoxon auftritt, wenn einige Nutzer ihre Entscheidungen auf Basis von pers¨onlichen Erfahrungen und der Rest basierend auf ¨offentlich zur Verf¨ ugung stehenden Informationen treffen. Dies beschreibt die Situation von Pendlern im Berufsverkehr.
Die erzielten Ergebnisse unterstreichen die Bedeutung des Braess-Paradoxons f¨ ur reale Ver-
kehrsnetzwerke.
The Braess paradox is a counterintuitive phenomenon that can occur in traffic networks, which are used by selfish users. It states that under certain circumstances the addition of a new road to a traffic network can result in increased travel times for all network users. This can have important consequences for the design of new traffic networks and for the extension of existing ones, since the na¨ıve assumption that the traffic situation in a road network always improves when adding new roads does not always hold. A detailed understanding of this paradox is needed, since possible negative externalities resulting from the construction of new roads have to be understood in order to be avoided. This is especially true, since the capacity of the road networks of many cities has long been reached and space for the construction of new roads is limited.
Even though there have been numerous real world examples that indicate that the Braess paradox might occur in real world traffic networks, a deep understanding based on realistic traffic models is still missing. This thesis provides important stepping stones towards this much needed understanding. Most previous research on the topic focused on analysing deter- ministic mathematical models, the results of which are not directly transferable to real traffic networks. Often many oversimplifying assumptions were made: the description of traffic flow is reduced to unrealistic road travel time functions that increase linearly with the numbers of cars using the roads. Furthermore, perfect traffic information and perfectly rational decision makings of the network users were assumed.
This thesis is dedicated to the study of the Braess paradox in networks of totally asym- metric exclusion processes (TASEPs). The TASEP models drivers as particles hopping on a one dimensional lattice. It is a simple stochastic transport model that includes microscopic interactions and exhibits a nonlinear current-density relation. The travel time functions of TASEPs have close-to-realistic shapes: they increase monotonically and diverge when ap- proaching the maximum possible density. TASEPs do not reproduce all phenomena of real road traffic, but many basic features which are not included in most previous research on the Braess paradox, can be described.
The network originally used by Braess is studied in several variants, but with the traffic flow described by TASEPs: various boundary conditions, route choice mechanisms and update types are considered. In a first step, it is shown that states realizing the paradox exist in TASEP networks. For this the decisions of the road users are tuned externally, i.e. users do not decide individually in an intelligent way, but are set to choose certain routes in the network. The user optimum states of the networks without and with the new roads are identified and their travel times are compared.
It is shown that Braess’ paradox occurs in large regions of the phase space in the net-
works with added periodic boundary conditions and random-sequential dynamics. With fixed
amounts of drivers assigned to individual routes, gridlock states are found in large parts of
phase space. Assigning drivers to their routes according to turning probabilities results in
are observed in the system with open boundary conditions and random-sequential dynamics:
the Braess paradox is observed in an indirect way, since an increase of travel times is expected if this system was used by ‘intelligent’ particles. If parallel dynamics are employed instead of random-sequential dynamics, the treatment becomes more complicated. Traffic lights are implemented to avoid potential conflicts at junction sites. Braess’ paradox is also observed in this case.
Beyond confirming that Braess’ paradox can be observed in TASEP networks, phase dia- grams which characterize the influences of the new road in more detail are presented for all analysed variants of the network.
Braess’ paradox is also realized if intelligent particles, which individually choose their routes, use the network. In the second part of the thesis, a route choice algorithm is implemented and results of a performance test in the Braess network with periodic boundary conditions are presented. All particles choose their routes individually based on this algorithm. Several types of traffic information are used as input for the algorithm. The Braess paradox occurs if particles decide based on their own memories from previous travel experiences. It is also realized if all particles base their decisions on publicly available approximations of future travel times. These approximations are calculated based on the current positions of all particles in the system and are a type of information similar to that provided by smartphone apps in real traffic networks. It is also shown that the paradox occurs if some particles base their decisions on personal information and the others on public information. This situation is very similar to that of real commuters’ scenarios. These results further stress the importance of Braess’
paradox for real road networks.
1 Introduction 1
2 Scientific Background of the Focus Topic 5
2.1 Transport Networks: Important Definitions . . . . 5
2.1.1 Basic Definitions Used in All Kinds of Networks . . . . 5
2.1.2 Different Types of Networks . . . . 7
2.1.3 Characteristic States for Different Network Types . . . . 7
2.2 The Braess Paradox . . . . 11
2.2.1 Braess’ Original Example . . . . 11
2.2.2 Braess’ Paradox in Road Networks: Some Additional Results . . . . . 14
2.2.3 Real World Occurrences . . . . 17
2.2.4 Analogues from Different Disciplines . . . . 20
2.2.5 What Can Be Improved in Braess’ Model? . . . . 21
2.3 The Description of Traffic Flow on Freeways . . . . 22
2.3.1 Established Facts from Empirical Research . . . . 23
2.3.2 The Traffic Description in Braess’ Original Model . . . . 26
2.4 Traffic Information and Decision Making Processes in Road Networks . . . . 28
2.4.1 Different Types of Traffic Information . . . . 28
2.4.2 Available Information in Present-Day Real Road Networks . . . . 29
2.4.3 Some Results of Research on Route Choices . . . . 31
2.5 How this Thesis Adds to a More Realistic Understanding of Braess’ Paradox 35 3 Models and Methods 37 3.1 The Totally Asymmetric Exclusion Process . . . . 37
3.1.1 Important Results for Random-Sequential Dynamics . . . . 39
3.1.2 How Well Does TASEP Describe Road Traffic? . . . . 44
3.1.3 Networks of TASEPs . . . . 45
3.2 The Basic Model of This Thesis: The Braess Network of TASEPs . . . . 51
3.2.1 Network’s Structure . . . . 51
3.2.2 Route Choice Strategies . . . . 53
3.2.3 Observables . . . . 55
3.2.4 Possible Network Phases . . . . 56
3.2.5 How to Find System Optima and User Optima . . . . 63
3.3.2 Metropolis Algorithm for Finding User Optima . . . . 70
4 The Braess Network of TASEPs with Externally Tuned Global Strategies 73 4.1 Periodic Boundary Conditions and Fixed Strategies . . . . 73
4.1.1 Gridlocks in the 5link Network . . . . 73
4.1.2 Results for the 4link Network . . . . 79
4.1.3 Comparison of the 4link and 5link Networks . . . . 82
4.2 Periodic Boundary Conditions and Turning Probabilities . . . . 90
4.2.1 Gridlocks in the 5link Network . . . . 90
4.2.2 Results for the 4link Network . . . . 91
4.2.3 Phase Diagram . . . . 96
4.3 Periodic Boundary Conditions - Comparison of the Results . . . . 99
4.4 Open Boundary Conditions and Turning Probabilities . . . . 102
4.4.1 The 4link Network . . . . 102
4.4.2 Comparing The 4link and the 5link Networks . . . . 106
4.5 Parallel Updates and Periodic Boundary Conditions . . . . 113
4.5.1 Main Characteristics of TASEPs with Parallel Dynamics . . . . 113
4.5.2 Braess’ Network of TASEPs with Parallel Dynamics . . . . 116
4.5.3 Results for Fixed Route Choices . . . . 120
4.5.4 Results for Turning Probabilities . . . . 123
4.5.5 Summary of Results . . . . 126
5 The Braess Network of TASEPs with Intelligent Particles 129 5.1 Decision Making Algorithm with Three Types of Information . . . . 129
5.1.1 Public Historical Information . . . . 132
5.1.2 Public Predictive Information . . . . 132
5.1.3 Personal Historical Information . . . . 133
5.2 The Algorithm Applied on a Potential “Braess 1” State . . . . 134
5.2.1 Systems with Only One Type of Information . . . . 135
5.2.2 Systems with Personal and Public Information . . . . 142
6 Summary and Conclusions 147 Acknowledgements 151 Bibliography 153 A Appendix 163 A.1 Observable Landscapes and Density Profiles . . . . 163
A.1.1 Periodic Boundary Conditions and Fixed Route Choices . . . . 163
A.1.2 Periodic Boundary Conditions and Turning Probabilities . . . . 173
A.2.1 Mean Field Theory for the 4link Network . . . . 187
A.2.2 Approximative Border of the “E
5optimal / all 153” Phase . . . . 191
A.3 Route Choice Algorithms . . . . 196
Many transport systems can be modelled by stochastic nonequilibrium processes. Some ex- amples are car traffic on a freeway [1], thermoelectricity [2] and percolation processes [3].
In the real world, most transport processes take place on networks. These networks are comprised of various edges, connected to each other by nodes. The individual edges can be described by transport processes that retain a current in the system which keeps it out of equilibrium. An example from everyday life is that of car traffic on road networks [4]: a road network of a city is comprised of many roads, i.e. many transport processes, that form the edges of the network, which are connected through various junction sites. Some examples from various scientific disciplines, which can also be described by networks of transport pro- cesses, are the intracellular motor protein movement on a cytoskeleton [5], the dynamics of supply chains [6], data transfer in computer networks [7] and predator prey models describing population dynamics in ecosystems [8].
Many phenomena observed in such networks are consequences of the interplay of the indi- vidual transport processes and the network’s structure. They can thus neither be explained by a reduction to just the individual transport processes that form the network’s edges, nor by just the network’s structure. Instead, the interaction of both has to be taken into account [9].
The Braess paradox, which was was first described by German mathematician Dietrich Braess in 1968 [10, 11], is an especially interesting network phenomenon: it describes the fact that under specific circumstances the addition of a new road to a congested road network can lead to increased travel times for all drivers. Vice versa, sometimes the closure of roads can lead to lower travel times on all other roads in a network. This specific paradox is one example of various network effects that also became known as “more-for-less” effects [9]. The paradox is genuinely surprising: na¨ıvely one would expect that a new road, which increases the number of choices for the network users, would always lead to lower travel times, especially if the new road results in per-se faster connections between origins and destinations for the drivers.
A crucial prerequisite for the occurrence of the paradox is that network users are selfish
(or noncooperative), i.e. that they want to minimize their own travel times and do not act
altruistically. If certain prerequisites are met, it is generally agreed that the stable state of
traffic networks of such users is given by the user optimum state: this state is reached if the
drivers distribute themselves onto the routes, such that all used routes have the same travel
times which are lower than those of any unused routes [12]. If the traffic was controlled by
some external authority, which optimizes the traffic state, the paradox would not occur: in
such cases a new road would always either improve traffic conditions or at least not worsen
them. In most modern day street networks no such authorities are at work. The Braess paradox is one of many examples of noncooperative games [13] in which selfish users drive the system into a state that is worse than the optimum state.
A detailed understanding of the Braess paradox and other phenomena of traffic flow is of great importance: the population of urban areas is increasing rapidly. Currently, 55% of the world’s population lives in urban areas with a predicted increase to 68% in 2050 [14]. The efficient development of new traffic networks and the expansion of existing ones, an interplay of top-down planning and self-organizational processes [15], is just one important aspect to be considered very carefully as a consequence. Space is limited and the road capacities have long been reached in many cities around the world: in 2014, the average commuter in the USA spent 42 hours and wasted approximately 70 litres of fuel in congestion [16]. According to the TomTom traffic index [17], based on data gathered in 2016, Mexico City is the city with the highest congestion worldwide with travel times doubling during peak hours. Even in Cologne, which is only ranked 56
thworldwide, travel times go up by 50% during peak congestion periods, as compared to the free flow times.
Building new roads does not seem to be the right measure to tackle the problem of con- tinuously increasing congestion. The so-called “Fundamental Law of Road Congestion” [18]
states that newly built roads might only relieve traffic conditions in the short term, while more available roads result in an increased usage and thus in even stronger congestion in the long term. Braess’ paradox is another indication that building new roads might not always be a good idea: since its model-based discovery, there have been numerous real world examples that indicate Braess’ paradox might occur in real world traffic networks [19–25]. Indeed, re- search based on empirical road usage data identified major routes in cities such as New York City, the closure of which could reduce congestion [26]. If new roads may potentially have such adverse effects, city planners have to be considerably careful. A deeper understanding of the paradox is thus needed.
In his original paper, Braess demonstrated the paradox itself and sparked an ongoing inter- est in this phenomenon [27–34]. The original publication as well as many of the subsequent publications on the topic employ models which represent real traffic networks in an oversim- plified manner. Many effects occurring in real road networks are only described in their most basic form while other effects are not included at all. Results obtained with these models can thus not be directly applied to real road networks. In particular, they can not be used to predict the occurrence of Braess’ paradox in a reliable way.
The assumptions that limit the real world applications can be subdivided into the following two main categories.
a) A strongly simplified description of traffic flow.
b) Unrealistic assumptions regarding travel time information and decision makings of the drivers.
Regarding Category a), Braess’ model uses deterministic, macroscopic mathematical models
for the description of traffic flow on the individual roads of the network. Real traffic flow,
traffic, stochastic microscopic models have proven to be effective methods [35]. Additionally, the travel times of the roads are assumed to grow linearly with the number of cars using the roads, omitting some decisive characteristics of real road traffic. Real travel time functions are not linear, in particular they diverge for high densities as a consequence of traffic jams [36–42].
Some efforts have been made to analyse Braess’ network with more realistic traffic descrip- tions: time-independent dynamics have been introduced into the study of the paradox, e.g.
by considering queueing models for the description of traffic flow [27, 43, 44]. These models do not include microscopic dynamics and thus many important characteristics of real traffic are not represented in these models either. To my knowledge no demonstration of the paradox in models employing microscopic stochastic transport models has been published prior to our research.
Regarding Category b), Braess’ model assumes that users have perfect information on all travel times in the network and that they decide which routes to take perfectly rationally based upon this information. User optimum states that potentially exist are assumed to al- ways be reached, as a consequence of these assumptions. In most real road networks neither of these assumptions hold: network users have limited knowledge about travel times based upon their own experience or upon information from public sources, such as radio broadcast- ing or personal navigational systems like smartphone apps [45, 46]. While the accuracy of these predictions seems to grow, neither of them can be considered perfect. Furthermore, it was shown that road network users do not decide perfectly rationally and that travel time minimization is not the only aim underlying route choice processes [47–49]. The assumption that user optima are realized in real road networks is thus also a topic of ongoing discus- sion [33, 50]. Modifications of the original concept of the user optimum have been proposed as more realistic concepts for stable states in road networks of selfish users [51, 52]. How- ever, more recent research indicates that the increasing use of smartphone routing apps could indeed realize user optima in traffic networks [53].
The aim of this thesis is to analyse and understand Braess’ paradox in more realistic models. For this, I analysed networks of Totally Asymmetric Exclusion Processes (TASEPs) for the occurrence of the paradox. The TASEP is a simple particle hopping model which was first introduced to model protein translation [54]. Despite its simplicity it covers some basic features of road traffic [1] and exhibits interesting nonequilibrium properties such as boundary induced phase transitions [55]. It is nowadays considered one of the standard models of nonequilibrium statistical mechanics and became known as the “mother of all traffic models” [35], if the particles are interpreted as drivers on roads. While single TASEP segments are well understood and analytically solvable (see e.g. [35] for a review of many established facts on TASEP), networks of TASEPs are generally not analytically solvable [56].
In recent years, mean field approximation methods as well as Monte Carlo simulations have been applied to study some simple networks of TASEPs [56–62].
With the aim of understanding the paradox in a more realistic scenario and improving on
the two main categories of simplification, a) and b), two main questions were addressed:
1. Can the paradox occur in networks of TASEPs?
2. Given that the paradox may occur: is it reached by particles which base their route choices on realistic types of traffic information?
In the following, I describe how this thesis is structured and where these two questions are addressed throughout the thesis.
Thesis Outline
In Chapter 2 the scientific background of Braess’ paradox is explained in more detail. After introducing some important definitions, the original example is recapitulated. Some addi- tional results on the paradox in the context of traffic flow as well as some examples from other scientific areas are presented. The major limitations of the model, already hinted at in a) and b), are addressed in more detail by juxtaposing the simplifying assumptions of the model and observations from the real world. Important results on traffic flow, traffic informa- tion and decision makings as obtained in traffic science, the social sciences and related fields are presented. Based on this foundation, the scope of my research is then motivated more specifically.
Chapter 3 presents the most important models and methods which I used throughout my thesis. The TASEP is introduced in some detail, before presenting the basic model of the research in the following chapters: the Braess network of TASEPs. The results in all subsequent chapters are based on this model. Furthermore, Monte Carlo simulations as used in this thesis are explained.
Chapter 4 addresses Question 1, i.e. if the paradox can occur in networks of TASEPs.
Braess’ network of TASEPs with externally tuned global strategies is analysed. The term
“externally tuned” refers to the fact that the particles do not make their own intelligent decisions. Instead, the decisions of all particles are set externally by fixing some model parameters. In doing so, the question if Braess’ paradox is in principal accessible in networks of TASEPs is answered. This is repeated for various variations of the network.
Chapter 5 addresses Question 2, i.e. if the paradox is reached by particles that base their route choice decisions on realistic types of information. While in Chapter 4 the particles do not decide individually but are instead assigned to their routes, Chapter 5 examines what effect intelligent particles have onto the network’s situation. For this purpose, a route choice mechanism was implemented. The particles make their decisions based upon various types of information, including a combination of personal and public information. This is a scenario occurring in many modern day commuter scenarios in which travellers have information based upon their own experiences and from modern personal navigational systems. The question, whether Braess’ paradox is actually realized in these cases, is answered.
A short summary, concluding remarks and some suggestions for possible future research
are given in Chapter 6.
In the present chapter, the scientific background of the Braess paradox is summarized. First, some definitions which are needed to describe traffic networks and which will be used through- out the whole thesis, are introduced. Then, Braess’ paradox is presented in detail: the original example by Braess and some significant results of the vast amount of research on the topic are recapitulated. Subsequently, it is worked out why the descriptions of traffic flow and decision makings in many models, used in the context of Braess’ paradox, are unrealistic. This is followed by a summary of some results of research on traffic flow and route choice scenarios in real traffic networks, as obtained in various scientific fields. Based on this, the general idea of how this thesis adds to a better understanding of Braess’ paradox is explained in some more detail.
2.1 Transport Networks: Important Definitions
For analysing transport networks certain definitions have proven useful. They are used to distinguish different types of networks and network users and help characterizing the perfor- mance of such networks, as measured e.g. by the travel times experienced by its users.
Transport networks have been analysed in various scientific fields such as traffic sciences, traffic engineering, mathematics, network sciences and physics. Therefore sometimes different terminologies are used to describe the same things. In the present chapter some important definitions are introduced as they will be used throughout this thesis. In this whole thesis the primary focus is on (car-) traffic networks. The presented definitions can nevertheless also be applied to most other transport networks.
2.1.1 Basic Definitions Used in All Kinds of Networks
The definitions presented in this subsection are used in the description of all networks in this thesis independent of the detailed natures of the networks.
Junctions, Roads and Routes. A connection between two “junctions” (or “points”)
1of a traffic network is called a “road”
2. Roads have to be distinguished from “routes”: in this thesis a route is always a connection from an origin to a destination. A route can be comprised of multiple roads. For clarification consider the example network shown in Figure 2.1. The nodes A to F of the network could e.g. be cities which are connected by several roads. If
1
In network science terminology: “nodes”.
2
In network-science terminology: “edge”.
“network users”
3want to go from point A to point F , they can choose from two different routes which are marked in green and in blue in the figure.
Figure 2.1. A sample (transport) network. The nodes A to F could e.g. represent cities in a road network. The grey arrows indicate that this network could be embedded into a larger network. If a certain amount of cars wants to go from A to F, they can choose between the green route, traversing points C and D and the blue route traversing points C and E.
Travel Times. The amount of time it takes to go from an origin to a destination using a specific route is called the “travel time” on that route.
Network States. A “state” of the network is given by the distribution of the network users onto the available routes. If in the network shown in Figure 2.1 a number of X network users want to go from point A to point F , one possible state would e.g. be 0.75 · X users choosing the blue route and 0.25 · X users choosing the green route. Different states can lead to different network performances as they may influence e.g. the travel times of the routes in the network.
Individual and Global Strategies. The route choices individual network users make to get from their origins to their desired destinations are also referred to as their “individual strate- gies”. The set of all individual strategies is also called the “global strategy”.
An individual strategy can be given by an individual user always choosing one specific route or by assigning probabilities for using various routes. These two variants are also called “pure and mixed strategies”, respectively. For an example go back to the network in Figure 2.1: if a network user has to go from A to F repeatedly (A and F could be e.g. home and workplace of a commuter), a possible pure strategy would be him choosing the green route everyday.
A possible mixed strategy would be choosing either the green or the blue route with equal probabilities.
3
Depending on the context also referred to as “cars”, “drivers”, “particles” or “agents”.
2.1.2 Different Types of Networks
Numerous types of traffic networks can be distinguished based on several characteristics. The types presented here can be distinguished by their travel time characteristics and by the types of agents using the network.
Uncongested and Congested Networks. When describing road traffic networks one has to differentiate between uncongested and congested networks. In “uncongested networks”
the travel times of routes do not depend on the numbers of users on the routes while in a
“congested network” the travel times increase with the number of agents on the routes [28].
All real road networks become congested from a certain number of users upwards.
Networks of Selfish Users. In a network of “selfish users” all agents can decide on their own upon which routes to take towards their destinations. In past- and present-day road networks this is mostly the case. Users may be influenced by navigational systems, radio traffic broadcasting or other things but ultimately they are free in their route choice decisions.
While factors like the length of the route, the road conditions or the scenery can also have an influence, the most important factor influencing these decisions seems to be the minimization of the expected travel time. This is especially true for traffic in cities and for commuters route choice scenarios (see e.g. [47, 48, 63] for reviews on which factors influence traveller’s route choices). This topic will also be discussed in greater detail in Section 2.4.
Throughout this thesis it will be assumed that the only objective of selfish users is mini- mizing their own travel times and that they do not act altruistically in pursuing this goal.
Networks with Traffic Guidance Authorities. In some networks external
4“traffic guidance authorities” can regulate the traffic. They can decide how the individual network users are distributed onto the roads and routes of the network. In a road traffic network this may e.g.
be realized by the police assigning individual cars onto specific routes. Alternatively, traffic lights could be used not only for giving the right of way to specific roads at specific times, but also assigning route choices (e.g. if there are two routes leading to the same destination).
Another possible example could be a situation in which all users have navigational systems which are coupled to each other, and to the infrastructure via the internet of things (also called car-to-car or car-to-X communication [64]). If all individual devices are coupled, a global strategy can be developed and the individual users can be assigned to their routes accordingly. If all users make their route choices (voluntarily or by obligation) according to this strategy, one could speak of a network with a guidance authority.
2.1.3 Characteristic States for Different Network Types
Two states are of major importance for characterizing road networks: the system optimum and the user optimum. The former is typically associated with networks with traffic guidance
4
The term “external” means ‘controlled by authorities external to the network users’, i.e. not controlled by
the users themselves.
authorities while the latter is associated with networks of selfish users. In most cases these states lead to different network performances. The performance differences can be quantified by the so-called price of anarchy which is defined subsequent to the two optima.
User Optimum. The “user optimum” (uo) is the stable state or equilibrium state of a network used by selfish users. This means that the distribution of drivers onto the routes will not change with time once the user optimum is reached.
In an uncongested network it is always given by all users choosing the shortest available routes. The problem of finding equilibrium states in congested transport networks used by selfish users goes back to Pigou in 1920 [65] and Knight in 1924 [66]. The notion of the user optimum was explicitly introduced by Wardrop in 1952 [12]. If a certain amount of agents wants to go from the same origin to the same destination and there are multiple possible routes to choose from, the following definition holds.
The system is in its user optimum state if the users choose their individual strate- gies in such a way that all used routes have the same travel times which are lower than those of any unused routes [12].
This state is stable since there is no incentive for any user to change its strategy: since in congested networks travel time functions are always increasing with the number of users on the road [67], a change of routes would always lead to an increase of the switching user’s travel time.
Throughout the literature on this topic the user optimum is often also referred to as
“Wardrop equilibrium” or as “user equilibrium” (see e.g. [29]). It corresponds to the concept of a “Nash equilibrium” [68] in game theory.
The following two variants of user optima are distinguished in this thesis.
1. The “pure user optimum” is realized if each network user chooses one specific route.
If applied e.g. to a commuter’s scenario this means that individual users keep using the same routes over and over. The numbers of users on each route are fixed integer numbers. This corresponds to a “pure Nash equilibrium” if one considers the situation from a game theory perspective [68].
2. The “mixed user optimum” is in the context of game theory known as a “mixed Nash- equilibrium” [68]: it corresponds to the case that all network users keep their strategies, while here these strategies do not correspond to always choosing one specific route, but are fixed probabilities for choosing (various) routes. A mixed user equilibrium is reached if the average values of the travel times of used routes are equal and lower than those of unused routes.
In 1955, Beckmann et al. showed for deterministic macroscopic traffic models that if travel
time functions are monotonically increasing with the number of cars, a unique user optimum
always exists [69].
The two definitions presented above assume that network users have knowledge of travel times on all routes, that their perceptions of travel times are not in any way distorted and that they decide perfectly rationally. Thus if any route had a minimally lower travel time than the route used by a certain user, this user would switch routes. This is not always the case in real road networks, as can be explained from a simple example: imagine a person drives to work on the same route everyday and on this route the travel time is normally 30 minutes. If there is another route which, on one day, is expected to have a travel time of 29 minutes, this would not necessarily lead the person to switch routes. If the amount of potentially saved time is relatively small, factors like routine can be more important than saving a small amount of time. To account for some effects of this kind, the following two notions have been proposed.
a) The “stochastic user optimum” was introduced by Daganzo et al. in 1977 to account for the fact that real network users may not always perceive travel times perfectly [51].
Furthermore, network users may not choose their routes on a perfectly rational basis.
To account for such effects the stochastic user optimum was defined as the state in which no user believes that he can improve his travel time by unilaterally changing routes. To account for this in mathematical models it was suggested that for each driver a small random number is added to the expected travel times.
b) The “boundedly rational user optimum”, as introduced by Mahmassani et al. in 1987, accounts for the effects already mentioned above, namely that real drivers may not be induced to change to another route if travel times can only be decreased by a small amount [52]. It is achieved if all selfish users are satisfied with their current travel choices. In models it can e.g. be implemented such that users only switch routes if the potentially saved travel time is higher than a certain threshold.
Some of these concepts will be applied throughout this thesis. It is important to keep in mind that they all refer to the same general understanding of what a stable state is in a network with selfish users: a state in which there is no incentive for any user to change its strategy.
System Optimum. The “system optimum” (so) is the state which is best for the system as a whole. Different definitions of the system optimum are used depending on how the system is defined. Two of many possible definitions are the following: on the one hand, the system could be considered from an external viewpoint and it could then be optimized with regard to its performance as measured from that external perspective. On the other hand, the set of all network users could be considered to be the system. The system could then be optimized with regard to the set of all user experiences. Optimizing the system based on different definitions of what the system actually is, can lead to different states being considered optimal.
Applied to a city traffic network, an external viewpoint could e.g. be that of the city
planning council. The council might want to optimize the performance of a part of the city’s
road network with regard to how this network part influences the surrounding network. From
this point of view there could be various possible definitions of the system optimum. One is the state which minimizes the total travel time of all users, as used e.g. in [70]. A second one would be the state which maximizes the flow through the network. This was e.g. used in [27].
These definitions do not necessarily optimize the network with regard to the convenience of its users.
If the system is considered to be described by the set of all the network users, among others, the following definitions of system optima were proposed. In Wardrop’s original definition of the system optimum [12], often referred to as the “social Wardrop equilibrium”, the system optimum is the state in which the weighted average (with regards to the number of users on the routes) of the travel times of all routes is minimized. This is the state which is on average best for all network users. It is not necessarily the best for each individual user since it could be a state in which a few users experience very high travel times while most users experience much lower travel times. This would imply a certain altruism of some network users who take the routes with longer travel times for ‘the greater good’. Altruistic behaviour is in general not assumed for real road users.
A definition of the system optimum accounting for this problem was given by D. Braess in his original paper on his paradox and will also be used throughout this thesis.
The system optimum is the state which minimizes the maximum travel time of all used routes [10].
While in Wardrop’s definition of minimizing the average travel times individual users could be worse off than in the user optimum, this cannot be the case in Braess’ definition: his definition implies that each network user faces a situation which is at least as good as in the user optimum.
All the above-mentioned definitions can, depending on the actual example, be coinciding in the same state but are generally fulfilled by different states. Oftentimes the system optimum, no matter the exact definition, does not coincide with the user optimum. In such cases the system optimum is not a stable state when dealing with selfish drivers, since individual routes may have lower travel times than other routes. Users would then tend to switch to the routes with lower travel times. The system optimum can generally only be achieved if the traffic is regulated by an external traffic guidance authority.
The Price of Anarchy. In an uncongested network the user optimum always equals the system optimum: it is always the state of all users choosing the shortest route, i.e. the route with the lowest travel time. As mentioned above, all real networks become congested from a certain density upwards. The performance of a congested network may be different depending on if it is used by selfish users or some traffic guidance authority is present. To quantify these differences the “price of anarchy” (P oA) has been defined.
When applied to travel times in road networks, the price of anarchy is given by the ratio of
the travel times in the user optimum T(uo) divided by the travel times in the system optimum
T (so):
P oA = T (uo)
T(so) . (2.1)
Upper bounds for the price of anarchy were derived for mathematical traffic models fulfilling certain conditions. If e.g. all roads are considered to have travel time functions linear in the number of cars, the price of anarchy cannot exceed a value of 4/3. If travel time functions are continuous and nondecreasing, the user optimum travel time cannot exceed the total travel time in the system optimum for twice as many users. [71]. These limits are valid for deterministic mathematical models.
2.2 The Braess Paradox
The Braess paradox was first formulated by Dietrich Braess, a german mathematician, in his 1968 paper “ ¨ Uber ein Paradoxon aus der Verkehrsplanung” [10] (an english translation was published in 2005 [11]). It describes, roughly speaking, the counterintuitive phenomenon that adding a road to a road network used by selfish users can result in equilibrium states with increased travel times for all users.
In the present section, first, Braess’ original example will be recapitulated to convey a detailed understanding of the exact nature of the paradox. Subsequently, a short summary of some results of additional research on Braess’ paradox in road networks is given. This is followed by some examples of occurrences in real road networks and of some analogues of the paradox from other scientific disciplines.
Subsequently, a detailed analysis of the simplifying assumptions, used in Braess’ original model is presented by juxtaposing these simplifications with what is observed in real road networks. Building on this, the section ends by explaining how the research presented in this thesis works contributes to an understanding of the paradox in a more realistic manner.
2.2.1 Braess’ Original Example
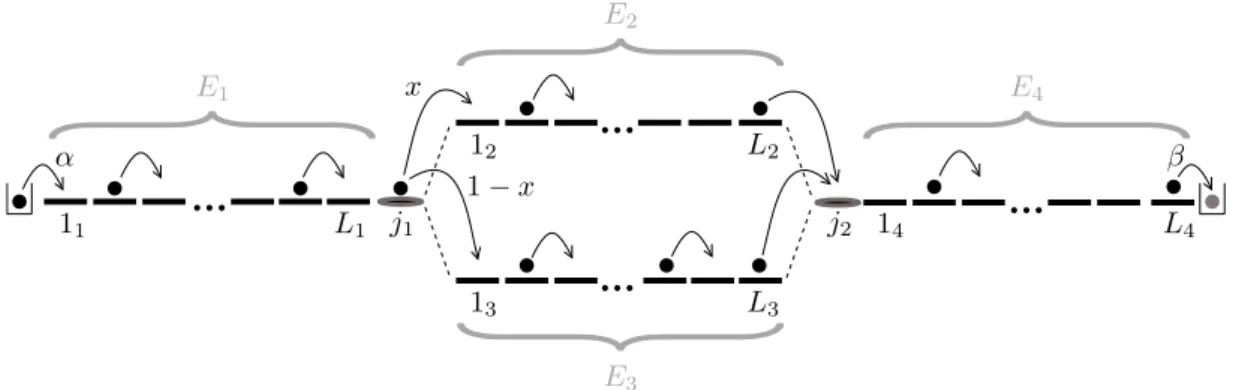
The present subsection summarizes Braess’ example of the paradox [10, 11]. The original example is the network shown in Figure 2.2 which became to be known as “the Braess network” or “Braess’ network”. It is assumed that all network users want to go from the same origin to the same destination. For this purpose, they can choose one of three available routes: “route 14”, “route 23” or “route 153”
5. Road 5 is the road which is considered to be added to the network (or deleted from the network if one deals with the inverse situation), resulting in the newly available route 153. The network without road 5 will from now on also be called the “4link network”, while the network with road 5 will also be called the “5link network”.
5
Routes 14, 23 and 153 consist of roads 1 and 4, 2 and 3, and 1, 3 and 5, respectively.
Figure 2.2. Braess’ network as introduced in his original paper [10]. All cars want to go from the same origin to the same destination. There are five available roads, forming three possible routes:
routes 14, 23 and 153.
The travel times T
iof all roads i were chosen to be linear functions of the number of cars n which use the roads,
T
i(n) = a
i+ b
in, with a
i, b
i≥ 0. (2.2) As will be discussed in detail in Section 2.2.5 this is an oversimplification of travel time functions of real roads. They do not cover, amongst other effects, neither the microscopic dynamics of road traffic nor fluctuations due to its stochastic nature.
Nevertheless, there are possible interpretations of the parameters in the linear travel time functions: the parameters a
ican be interpreted as the free flow travel time
6. This is the time it takes for a single vehicle to traverse the road, if there are no other cars or only a sufficiently low number of cars, such that the cars do not influence each other. The parameters b
iindicate how strongly the travel time grows with the number of cars: they could be interpreted as a representation of the road conditions. A road which is in a good condition and has multiple lanes will have a lower b than a narrow road with many obstacles such as potholes.
For his network, Braess chose the following specific travel time functions:
T
1(n) = T
3(n) =10n, (2.3)
T
2(n) = T
4(n) =50 + n, (2.4)
T
5(n) =10 + n. (2.5)
Thus the 4link network is symmetric, as it its two routes 14 and 23 are comprised of two equal roads. Since there are no other roads in the 4link network it has no influence on the
6
Indeed, the free flow travel times are T
i(1) = a
i+ b
i, because these are the travel times that a single road
user experiences if there are no other users on the road. However, throughout most literature on the topic,
the a
i’s are referred to as free flow times [30].
travel times that the equal roads are in reverse order on the two routes.
The total amount of cars that wants to go from the origin to the destination is denoted by N . The numbers of cars taking routes 14, 23 and 153 are denoted by n
14, n
23and n
153, respectively, with N = n
14+ n
23+ n
153. If a total amount of N = 6 cars wants to go from start to finish, the system optimum is given for
n
so14= n
so23= 3 , n
so153= 0, (2.6) resulting in the following travel times:
T
14so= T
23so= 83 , T
153so= 70. (2.7) In the system optimum, no car is using route 153 and the travel time on that route is lower than the travel times on both other routes. Thus, for selfish users, this state is not stable.
Cars would tend to switch to route 153. The (pure) user optimum is found for
n
uo14= n
uo23= n
uo153= 2, (2.8) resulting in the travel times
T
14uo= T
23uo= T
153uo= 92. (2.9) Now all routes have equal travel times and there is no incentive for any driver to choose a different route.
The travel time in the user optimum is 92 on all routes and thus higher than that of the system optimum which is 83 on the used routes.
First, we note that the price of anarchy in the 5link network is P oA = T
uo/T
maxso= 92/83 ≈ 1.1 > 1: selfish users drive the system into a stable state which has a higher travel time than the best state of the whole system. The latter can only be achieved by externally regulating the traffic.
Second, we observe Braess’ paradox in the following sense: if road 5 was taken out of the network, only routes 14 and 23 would be left. In the remaining symmetric network the system and user optima would coincide at n
14= n
23= 3. This means that for selfish users the 4link system would end up in its optimum state. Thus, while the elimination of road 5 leads to the vanishing of the fastest route (if used by only one car), it also leads to lower user optimum travel times. One can also imagine the inverse situation: if one starts with the network without road 5 and then adds this road, and thus a a shorter route, with the aim of decreasing travel times, one can end up in a worse situation as user optimum travel times go up.
The occurrence of the paradox is not limited to symmetric (4link) networks. As shown e.g. by Frank in 1981 [31] the paradox also occurs in networks with broken (4link) symme- try. In [31] the demand-regions
7in which the paradox occurs in the Braess network were
7
The “demand” refers to how many cars want to use a road network. In our it is thus given by N .
determined for travel time functions of the form of Equation (2.2) with arbitrary a
iand b
i. Mixed User Equilibria. The Braess paradox is also observed if users choose their routes according to mixed strategies. Let p
14, p
23and p
153be the probabilities with which all users choose routes 14, 23 and 153, respectively. The probabilities are subject to p
14+ p
23= 1 or p
14+ p
23+ p
153= 1 for the 4link and 5link systems, respectively.
In the 4link system, for mixed strategies the expectation values, denoted by h T
imsi , of the travel times on the routes 14 and 23 are
h T
14msi = 50 + (1 + p
14· (N − 1)) · 11 (2.10) h T
23msi = 50 + (1 + p
23· (N − 1)) · 11 (2.11) for each car.
For N = 6 a mixed user optimum state (muo) is found for p
14= p
23= 1/2 with a travel time expectation value of h T
14muoi = h T
23muoi = 88.5.
In the system with the new road, the expectation values of the travel times on the three routes are
h T
14msi = (1 + (p
14+ p
153)(N − 1)) · 10 + 50 + 1 + p
14(N − 1) (2.12) h T
23msi = (1 + (p
23+ p
153)(N − 1)) · 10 + 50 + 1 + p
23(N − 1) (2.13) h T
153msi = (2 + (p
14+ p
23+ 2p
153)(N − 1)) · 10 + 10 + 1 + p
153(N − 1). (2.14) Here a mixed user optimum is given for p
14= p
23= 5/13 and p
153= 3/13 with travel time values h T
14muoi = h T
23muoi = h T
153muoi = 93.6923.
For the case of mixed strategies the expected user optimum travel times are also higher in the 5link system than in the 4link system, i.e. the paradox occurs also with mixed strategies.
This example shows that the average number of cars on a specific route in the mixed user optimum does not have to correspond to the (integer) number of cars on that route in the pure user optimum: in the 5link system, the pure user optimum is for N = 6 given by distributing the users equally on the three routes. The mixed equilibrium is not achieved by all users choosing the routes with equal probability!
2.2.2 Braess’ Paradox in Road Networks: Some Additional Results
The first description of the paradox in 1968 sparked an ongoing interest in the traffic science community as well as in network sciences, statistical physics and other related research areas.
A prerequisite for the occurrence was found to be the following: if a new road, and thus a new route with lower free flow travel time is constructed, user optimum travel times in the network can go up. This happens, if due to switching to the the new route more users switch to roads with high marginal travel costs
8[70]. In Braess’ original example this becomes
8
The marginal travel cost of a route measures how much the travel time increases (for all users) if one more
user decides to use that route. For linear travel time functions like Equation (2.2) a high marginal travel
clear: due to switching to the new route 153 more cars use roads 1 and 3. These roads have high marginal travel costs (high b
1= b
3= 10, cf. Equations (2.3) to (2.5)). One more user switching to one of these roads results in a large increase in travel time for all cars using them.
Since the occurrence of the paradox was in these terms understood as a consequence of network design and the choice of according travel time functions, with specific roads having high marginal costs, the paradox was not anymore considered paradoxical but as a pseudo- paradox [32].
In 1970, Murchland showed that the paradox also occurs for different choices of (linear) travel time functions in Braess’ network [72] and the paradox was also demonstrated to occur in networks of different topologies by Steward in 1980 [70].
In the traffic sciences community the focus was primarily on pure user optima. Mixed user optima in the context of Braess’ paradox were of higher interest in related research in the social sciences, e.g. [33].
A mathematical framework for predicting the occurrence of the paradox in networks of any topology with uncorrelated link travel time functions of the form (2.2), and also for nonlinear monotonically increasing travel time functions, was established in the research of Frank in 1981 [31] and Steinberg et al. in 1983 [28]. Steinberg et al. pointed out that “Braess’
Paradox is about as likely to occur as not occur [in such general transportation networks]” [28].
Dafermos et al. introduced some correlation effects into the network by considering travel time functions which not only depend on the amount of cars on the individual roads, but also on the flow on all other roads in the network [29].
Some new insights on the paradox in the original Braess network were obtained in 1997 by Pas et al. [30]. In this publication it was worked out for which demands the paradox occurs for the original Braess example (Equations (2.3) to (2.5)). The results are summarized in the following.
Imagine the same network as presented in Braess’ original example, but with more general travel time functions, all linear as in Equation (2.2) and subject to the conditions
a
1= a
3= 0, (2.15)
a
2= a
3= α
1, (2.16)
b
1= b
3= β
1, (2.17)
b
2= b
4= b
5= β
2, (2.18)
a
5= α
2. (2.19)
The following conditions for the paradox to occur are valid for all choices constrained to (2.15) to (2.19).
In the 4link network, without road 5, the system is due to symmetry in its user optimum if half of the total number of cars N choose route 14 and the other half choose route 23. The
cost would correspond to large value of b
i.
travel times on both routes are then equal:
T
uo(4)= N (β
1+ β
2)
2 + α
1. (2.20)
In the 5link network, the user optimum can be derived from the condition that all used routes must have equal travel times which are lower than those of any unused routes. It turns out that for
N ≤ α
1− α
2β
1+ β
2(2.21)
the user optimum is given if all N cars use only route 153. Such a state will in the following be called an “all 153” state. In this state the user optimum travel time is
T
uo(5)= α
2+ N (2β
1+ β
2) (2.22) and this travel time is lower than that on the unused routes 14 and 23.
For the total numbers of cars obeying α
1− α
2β
1+ β
2< N < 2(α
1− α
2)
β
1− β
2, (2.23)
all three routes are used and have the same travel times T
uo(5)= α
1+ N β
1+ (β
2− β
1)
α
2− α
1+ N (β
1+ β
2) β
1+ 2β
2. (2.24)
For
N ≥ 2(α
1− α
2)
β
1− β
2, (2.25)
only routes 14 and 23 are used and have equal travel times T
uo(5)= N (β
1+ β
2)
2 + α
1, (2.26)
which is lower than that of the unused route 153.
Given this knowledge of the 4link and the 5link user optimum travel times, one can compare them for equal N . If the 5link travel time is higher, Braess’ paradox occurs. If it is lower, the new road improves the system performance in the sense that it leads to lower travel times.
It is important to observe that for total numbers of cars obeying (2.25) the new route will not be used at all in the user optimum. This regime is not considered “Braess”, but the new road does not lead to any improvement either and is thus useless. This means that from the the lowest number of cars for which the 5link user optimum travel time is higher than the 4link user optimum travel time the new road first renders the situation worse, since Braess’
paradox is observed. Then, at even higher densities, the paradox vanishes. Nevertheless, the road does still not improve the traffic situation since it is not used at all.
For the specific choice of Braess’ original example, Equations (2.3) to (2.5) and 0 ≤ N ≤ 15,
the results are shown in Figure 2.3. One can see that the Braess region begins at N = 2.58,
0 2 4 6 8 10 12 14 N
0 20 40 60 80 100 120
T “ a ll 1 5 3 ”
T
uo(4)T
uo(5)Figure 2.3. The travel times in the user optima of the 4link and 5link systems for Braess’ original example against the total number of cars N. One can see that for N < 2.58 the new road leads to lower user optimum travel times (green region). For 2.58 ≤ N . 8.89 the system shows Braess behaviour: the 5link travel time is higher than the 4link travel time (grey region). For N > 8.89 the new route is not used in the 5link system. Thus the two systems have equal travel times (blue region). For N . 3.64 (black dotted line), in the 5link system’s user optimum only the new route is used (“all 153” state). Braess’ original example of N = 6 with T
uo(5)= 92 and T
uo(4)= 83 is also indicated by the dotted line in a bright grey color.
where T
uo(5)surpasses T
uo(4). One can also see that for 0 ≤ N . 3.64 the 5link user optimum is an “all 153” state. This means that for N . 3.64 only the new route is used - but from N = 2.58 upwards this leads to higher travel times than those reached in the system without the new road. For N & 8.89 the new route is not used anymore. This is why from this N upwards, T
uo(4)= T
uo(5). Summarizing one can say that for N > 2.58 the new road renders the situation worse and then for N > 8.89, it is not used at all
9.
In 2010, Nagurney showed for networks of arbitrary topologies, comprised of roads with monotonically increasing travel time functions: if Braess’ paradox occurs at certain densities from a certain density upwards, the new route is not used anymore [34].
Thus city planners have to be careful when designing new roads since the effects of new roads are density dependent. The new road could lead to higher travel times or be ignored not only for specific fine-tuned densities but for large density regimes.
2.2.3 Real World Occurrences
The model proposed by Braess seems rather artificially constructed. In the following, first an example of how the Braess network could be realized in the real world is presented. Then some reports on actual realizations of the paradox in real, more complex road networks are
9