Stochastic timeseries analysis in electric power systems and paleo-climate data
Inaugural-Dissertation zur
Erlangung des Doktorgrades
der Mathematisch-Naturwissenschaftlichen Fakultät der Universität zu Köln
vorgelegt von
Leonardo Rydin Gorjão
aus Lissabon, Portugal
J-Prof. Dr. Dirk Witthaut Prof. Dr. Joachim Krug Prof. Dr. Giovanni Filatrella
Vorsitzender der Prüfungskommission : Prof. Dr. Tobias Bollenbach
Tag der letzten mündlichen Prüfung: 18.02.2021
Abstract
In this thesis a data science study of elementary stochastic processes is laid, aided with the development of two numerical software programmes, applied to power-grid frequency studies and Dansgaard–Oeschger events in paleo-climate data.
Power-grid frequency is a key measure in power grid studies. It comprises the bal- ance of power in a power grid at any instance. In this thesis an elementary Markovian Langevin-like stochastic process is employed, extending from existent literature, to show the basic elements of power-grid frequency dynamics can be modelled in such manner.
Through a data science study of power-grid frequency data, it is shown that fluctuations scale in an inverse square-root relation with their size, alike any other stochastic pro- cess, confirming previous theoretical results. A simple Ornstein–Uhlenbeck is offered as a surrogate model for power-grid frequency dynamics, with a versatile input of driving deterministic functions, showing not surprisingly that driven stochastic processes with Gaussian noise do not necessarily show a Gaussian distribution.
A study of the correlations between recordings of power-grid frequency in the same power-grid system reveals they are correlated, but a theoretical understanding is yet to be developed. A super-diffusive relaxation of amplitude synchronisation is shown to exist in space in coupled power-grid systems, whereas a linear relation is evidenced for the emergence of phase synchronisation.
Two Python software packages are designed, offering the possibility to extract condi- tional moments for Markovian stochastic processes of any dimension, with a particular application for Markovian jump-diffusion processes for one-dimensional timeseries.
Lastly, a study of Dansgaard–Oeschger events in recordings of paleoclimate data un- der the purview of bivariate Markovian jump-diffusion processes is proposed, augmented by a semi-theoretical study of bivariate stochastic processes, offering an explanation for the discontinuous transitions in these events and showing the existence of determin- istic couplings between the recordings of the dust concentration and a proxy for the atmospheric temperature.
3
Contents
1 Introduction 1
1.1 Energy systems and power-grid frequency dynamics . . . . 2
1.2 Paleo-climatic transitions and Dansgaard–Oeschger events . . . . 7
1.3 Stochastic processes . . . . 9
1.3.1 Applications in power-grid frequency studies . . . . 9
1.3.2 Applications in paleo-climate studies . . . . 10
1.4 Overview of relevant publications . . . . 10
2 Publications 15 2.1 Stochastic analysis and modelling of power-grid frequency dynamics . . . 15
2.1.1 Publication #1 . . . . 15
2.1.2 Publication #2 . . . . 32
2.1.3 Publication #3 . . . . 44
2.2 Spatio-temporal analysis of power-grid frequency dynamics . . . . 51
2.2.1 Publication #4 . . . . 51
2.2.2 Publication #5 . . . . 78
2.3 Jump-diffusion processes and analysis of paleo-climatic transitions and Dansgaard–Oeschger events . . . . 90
2.3.1 Publication #6 . . . . 90
2.3.2 Publication #7 . . . 103
2.3.3 Publication #8 . . . 124
3 Conclusions 137 3.1 Power systems and power-grid frequency . . . 137
3.2 Bivariate jump-diffusion processes and Dansgaard–Oeschger events . . . . 143
3.3 Software development . . . 145
5
A Author contributions A 3
B Data availability B 7
B.1 Power-grid systems . . . B 7 B.1.1 List of sources . . . B 8 B.2 Paleo-climate high-frequency data . . . B 8 B.2.1 List of sources . . . B 8
C Erklärung zur Dissertation C 9
Chapter 1 Introduction
Stochastic noise is ubiquitous in physical systems. Its presence embodies a collection of phenomena: external fluctuations, high-frequency couplings in the system’s elements, and from a measurement perspective, instrumental noise and uncertainty. Commonly, noise is considered as a drawback as it can impede the stability or observability of a system. Yet, the stochastic characteristics carry an enormous scientific and application value as much of the processes’ intrinsic characteristics manifest themselves through their noise.
This dissertation touches on modelling and analysis of continuous-time stochastic processes with applications in energy systems and paleo-climate data. It comprises a development of non-parametric estimators for continuous-time stochastic processes in N dimension, as well as the development of a non-parametric estimators for bivariate Markovian Poissonian jump-diffusion processes. The methods developed and numeri- cally implemented are applied in power-grid frequency studies and Dansgaard–Oeschger events in recordings of paleo-climate data.
This thesis begins with a short introduction to the applications discussed in this the- sis, i.e., power-grid frequency dynamics and paleoclimate data, a prologue to continuous- time stochastic processes employed, and an overview of the publications included in this thesis—either published, submitted, or in preparation—with a short abstract of each publications. The second chapter contains all scientific publications grouped into three sections. Firstly, a section on data-driven power-grid frequency modelling, where the rel- evant publications are included [1, 2, 3]. Secondly, a spatio-temporal study of power-grid frequency augmented with synchronous recordings [4, 5]. Thirdly, a section addressing fast paleo-climatic transitions, in specific, Dansgaard–Oeschger event in the Last Glacial
1
Period, and the application of bivariate jump-diffusion processes [6, 7, 8]. The last chap- ter concludes with a critical examination of the publications as well as an examination of contemporaneous works and their implications. A note on authorial contributions and data used and collected during the thesis is found in the appendices.
1.1 Energy systems and power-grid frequency dynamics
Energy systems, and in particular, power-grid systems are the technical backbone of modern society. The access to electricity, ubiquitous is the developed world, is central to the functioning of society, for the most basics human needs to the most advance technological and industrial applications, rely on the access to electric power [9]. Under- lying what for many has become a commodity are complex control mechanism ensuring that electricity is robustly available to everyone [10]. These systems, power-grid systems, are amongst the most complicated human-made structures, sometimes spanning entire continents and traditionally operate under strict control mechanisms [11].
Maybe the most remarkable feature of the dynamics of power grids is the emergence of self-organised synchronisation on vast spatial scales up to thousands of kilometres.
All inertial generators across a power grid rotate with the same frequency (or integer multiples thereof), at 50 Hz in Europe [12]. One curious aspect here is that unlike many other commodity networks, like gas or water supply, power cannot be easily stored.
Although at a small scale—to operate mobile phones or run a laptop—batteries or other power storage exist, at the scale of countries or continents, power is generated and consumed simultaneously. This fact makes these systems unique, as they have to ensure that the costumers’ desires are met at each instant, i.e., that roughly at any chosen minute of the day, the power being produced within a power grid is simultaneous being consumed. Thus, a large market structure exists behind these systems, ensuring that each producer—be it a large nuclear power plant, a hydro generator, or a collection of wind turbines—can sell power to the ever-present and ever-changing consumers [13].
Noticeably, the power-grid frequency carries a mark of each of these elements. As
mentioned, in a power-grid system, a nominal angular rotation of synchronous generators
must be ensured [14, 15, 16]. At any moment one expects to be able to withdraw energy
from a power grid—on a local power socket or over a larger power cable—with a fixed
frequency: fifty cycles per second. Now as this frequency is ensured to be at the desired
nominal frequency by a collection of coupled rotating masses at each power plant, if there is an lack of power being produced, the rotation of these masses starts slowing down [10].
Likewise, an excess of power production accelerates the rotation of these generators.
These changes of power generation are proportional to the frequency deviations and these deviations can easily be seen by examining power-grid frequency recordings—one of the central timeseries analysed in this thesis.
Naturally, to ensure that the power-grid frequency is kept at the desired nominal value a set of control mechanisms are in place [17]. In some sense, the first one was already mentioned: Large coupled rotating masses serve as inertia in these systems, ensuring that the rate at which frequency deviation grow is bounded, thus leaving time for the remaining control mechanisms to be activated. [18]. Alongside the inertia in the system, a subset of power producers, mainly fast-reaction gas fired power plants aided by battery storage, are kept in reserve to add or withdraw power from the power-grid system to ensure any fast deviation from the nominal frequency is quelled [19]. These systems act in a manner of seconds in, for example, Continental Europe. They systems typically react in a manner of seconds and should stop the growth of frequency deviations in under a minute. his control mechanism is denoted, in the engineering jargon, primary control. In a language closer to physics, this mechanism ensures only that this large dynamical systems find a new stable fixed point of operation—yet not necessarily at the desired nominal frequency operation [20, 21]. One should not forget that coupled rotating masses can, in principle, rotate synchronously at any desired frequency. Thus, a secondary (and even tertiary) control mechanism is in place.
Commonly denoted secondary control, this is a set of longer timescale control mech- anism that are present to ensure that after a large deviation of the power-grid frequency, the system can revert back to a synchronous rotation of all coupled oscillators as close as possible to the desired nominal frequency [22]. The control actions, more precisely, the changes in the power generation of the respective power plants, are proportional to the integral of the frequency deviation. Unlike the primary control, whose job is solely to en- sure any deviation is bounded, secondary control is actively the desire to take the newly obtained stable fixed point of the power-grid frequency after a perturbation and drag it back until it matches a stable fixed point at the nominal frequency. It the language of control engineering, primary and secondary control combined form a PI-controller [12].
One should note here that there are several other dimensions to the problem. Not
only frequency needs to be controlled, but power flow between elements of the power-
grid system as well [23]. This, although not discussed, is part both of secondary and
tertiary control. Moreover, as expected, the interaction of coupled oscillators leads also to a set of other internal oscillations in these system, denoted intra-area and inter-area oscillations, referring to their local and more global aspects in a power grid, that need to be managed [24].
Lastly, what is here discussed revolves solely around the operation of a power-grid system, i.e., a set of coupled oscillators, around an already stable fixed point [25]. One should mark that more catastrophic events are possible in power-grid systems, namely partial or total blackouts [26]. These are complete losses of stability of the system, which, picking up on the language on network science, are equivalent to losses of connectivity in these networks [27]. These, mind, can be both physical, in a sense that a transmission line is broken, as well as simply the decoupling of generators, thus not necessarily stemming from a physical change. These, thankfully, happen rarely [28].
Modern power-grid systems begun, from the beginning of this millennium, undergoing a fundamental transition from conventional, fossil based generation, to renewable sources of energy to mitigate climate change [29, 30, 31, 32, 33]. Maybe the most pronounced one is the change of centralised to de-centralised power generation [14]. Traditional power- grid systems are roughly based on a concept of centralised production of energy, at a large power plant, from which power is distributed, first over a long-distance transmission lines, next to regional, and lastly to local distributions grids. Due to the technological advances on both wind turbine and photo-voltaic technology, as of this decade, it is now possible to generate substantial amounts of power from a single generator of this type. This however yields an impressive control problem: the scattering of thousands to millions photo-voltaic and wind turbine units in a grid, whereas the number of dispatchable generators decreases.
The change in power generation sources implies that the traditionally vertically de-
signed power-grid systems, where power flows from a large producer to a swat of numer-
ous local consumers, now sees power flowing from the bottom up. Every local producer
has the ability—and desire—to sell their energy. This, particularly for the study in this
thesis, adds an element of uncertainty not present in a similar scale before: irregular
and unpredictable fluctuations in power generation. The characteristics of these fluc-
tuations are augmented by the nature of the energy sources, i.e., their volatile power
generation [34, 35]. Unlike conventional power plants, as nuclear or coal-based power
plants, which can deliver a steady and controllable amount of power, renewable ener-
gies are plagued with uncertainty. Wind turbine power generation is entirely dependent
on weather conditions: a lack of wind flow implied a lack of power generation [36, 37].
Likewise, solar power generation, however certain about the time of the day the sun is shining, is subject to the movement of clouds [38]. This makes solar power generation as uncertain and volatile as wind power generation.
Compounding this problem is the fact that most renewable energy sources do not share the same intrinsic relation discussed above between power generation and angu- lar velocity of a synchronous rotating machines [39]. As mentioned above, the inertial rotation of synchronously rotating masses plays a crucial role in ensuring power-grid frequency is kept at a desired nominal angular velocity [40]. Wind and solar power gen- eration do not possess any intrinsic inertia. Particularly, solar photo-voltaic is a power generation procedure without any “moving parts” and thus has no rotational inertia.
Most photovoltaic power sources are connected to the grid via simple power-electronic inverters, which simply follow the grid’s voltage and frequency. Advanced inverter con- cepts are being developed that strives to mimic the physical relation of power generation and frequency of synchronous machines to contribute to the stability of the grid. [41, 42].
On a broader spectrum it is conjectured that the ongoing increase of renewable energy sources of energy felt across the globe will lead to increased fluctuations in power-grid systems. This is certain at the level of power generation, as it proves to be a problem already existent. From the point-of-view of power-grid frequency, this rationale is not straightforward [43]. A reduced amount of inertia in a power-grid system, i.e., a smaller amount of rotating masses overall, leads to the immediate realisation that stricter control is needed, to ensure large excursions of the power-grid frequency are quelled within the agreed allotted time [44, 40]. On the other hand, strict control measures are already in place, which account for this change of status quo. Nevertheless, this is a pressing issue for control actions in power-grid systems, as a stable power-grid system is paramount to the functioning of modern society.
Augmenting this is the presence of fluctuations in power-grid frequency, which, to
this date, has not seen thorough scientific examination. High-frequency ambient os-
cillations, i.e., overall stochastic fluctuations, are ubiquitous in power-grid frequency
recordings [45, 46]. A stochastic element, i.e., what one denoted “noise”, is present in
any physically driven system. This noise element can be viewed as more than just an
additional nuisance in real-world recordings. Thus, instead of filtering it out, one can
examine it, for it can carry some of the more interesting properties of the underlying
physical process. This is the perspective taken throughout this thesis. But in the context
of power-grid frequency what can this noise element represent? This noise is, interest-
ingly, an agglomeration of phenomena [47]: It comprises local properties of the location where a recording in taken; it comprises interactions with (spatially) close fluctuations, which are possibly due to local effects that propagate to nearby areas, or specific changes in generation, consumption, faults, etc., that affect the adjacent areas. Note here that certainty about the actual origin and specific elements that generate the stochastic fluc- tuations in power-grid frequency is not granted. However, this is not concerning. What can concern scientific investigation is what one can learn from the characteristics of these stochastic fluctuations. In particular, what one can learn from power-grid frequency in relation to other physical phenomena, i.e., what are the statistics of the stochastic fluc- tuations? Are they correlated to some discernible underlying phenomenon? How do they grow with external factors? And in comparison between different recordings?
Yet, there are events that one can clearly pin-point in power-grid frequency with events on energy systems. Notably, the aforementioned market activities, which involve a set of producers selling power on fixed time slots, in specific at each 15 minutes in Continental Europe, leads to large deterministic deviations in the power-grid frequency.
Actually, the presence of large control mechanisms serves both as a counter mechanism to these know and scheduled market activities, as well as sporadic unexpected changes (e.g. power line failures). These deviation lead to large excursions from the nominal frequency, which can be distinctly seen each 15 minutes [48].
Moreover, one can distinctly see what is commonly described in the mathematical sciences as “mean reversion”. This is not surprising. What one observes in power-grid frequency recordings are small fluctuations around the nominal frequency, i.e., small excursions away from this nominal frequency, which revert back to the nominal value due to the elaborate control system and sychrony across the power grid. Moreover, large excursions do occur—large here can be understood as being considerably larger than the expected variance of a mean-reverting stochastic process, i.e., in this thesis, an Ornstein–Uhlenbeck process [49]. Even when these large deviations do occur, this is a deterministic phenomena, as if one drives the frequency away from the nominal value.
This, as discussed, is equivalent to temporarily obtaining a new fixed stable point, or in the language on stochastic processes, the mean-reverting drift term is temporarily changed. Even in these cases one observes the strict phenomenon of mean reversion, where the frequency fluctuates around a moving drift value.
Examining real-world power-grid timeseries is key to understanding the character-
istics, functioning, and potential problems in power-grid systems. Foremost, as is the
concern of a large part of this thesis, parameter estimation is possible under a stochastic
description of power-grid frequency. Secondly, a description of power-grid frequency as a stochastic process can be derived from first-principals in a similar fashion to a dynamical systems’ approach, yet no clear description—or even explanation—is possible to offer to the nature of the stochastic fluctuations. This, however, one can motivate directly from the data, utilising the various timeseries estimators applicable from stochastic process theory. Thus, one can uncover proxy parameters for the aforementioned primary control, secondary control, and the stochastic noise. Equivalently, proxy terms can uncover the market activities behind the generation and consumption of energy. Lastly, embedded in the physical nature of the “fluctuations of the fluctuations”, rich phenomena of the strength of diffusion, the propagation of fluctuations in space, and the coupling of spatial and temporal dispersion can be uncovered. These aspects of power-grid frequency dy- namics are the central phenomena discussed in this thesis, as evidenced in the scientific publications it comprises.
1.2 Paleo-climatic transitions and Dansgaard–Oeschger events
Understanding paleo-climatic events is fundamental to understanding today’s climate as well as the stages of evolution of the Earth’s atmosphere, ocean, and their interaction.
This naturally can only be achieved via proxy measurements, from rocks and sediments, ice sheets, corals and fossils, from which one can piece together the conditions and events of the past [50]. Particularly important for this are the recordings stored in regions of the planet not anthropically affected, as for example the heart of Greenland. Ice-core drilling in Greenland has provided the most vivid description of the recent present events, particularly for the Last Glacial Period. In these proxy recordings a surprising stamp of very fast transitions are recorded which still puzzle the scientific community, denoted Dansgaard–Oeschger events [51, 52].
Dansgaard–Oeschger events are particularly abrupt transition of the northern hemi- sphere temperature, seen across paleo-climatic records from the past 100 000 years [53].
These are abrupt transitions, which can seemingly result in changes of over 6
◦Celsius of
the temperature of the northern hemisphere in a span of less than 40 years. They have,
so far, only been observed in glacial periods. In particular, several proxy temperature
records from the last glacial period, between circa 115 000 – 11 700 BCE, reveal roughly
25 sudden increases in the global temperature which slowly relax back to a global colder
temperature.
These abrupt transitions, affecting mainly the northern hemisphere, are particularly visible in paleo-climate records from Greenland’s ice core. Particularly, the laborious efforts of the scientific ice-core drilling expeditions to the heart of Greenland led of a plethora of records. A subset of these comprises a collection of stable isotope concen- tration (Oxygen-18 δ
18O, Calcium Ca
2+, Sodium N a
+) as well as dust concentration, which serve as proxy for the atmospheric and sea temperature. The concentration of oxygen-18 δ
18O isotope relates directly to the temperature of precipitation or evapora- tion of a fossil of over a region, i.e., in this case Greenland. Given it is a heavier isotope than the common oxygen-16, is precipitates faster due to its heaviness, and equivalently, evaporates slower. Thus it serves as an indicator of the temperature of the water content of, or surrounding, an object or region. Of distinction are the North Greenland Ice Core Project NGRIP project [54, 55, 56], the Greenland Ice Sheet Project Two (GISP2), and the Greenland Ice Core Project (GRIP) [57].
These proxy records serve as the stepping stones to past events, from which one can uncover distinct phases of the Quaternary glaciation, mostly in the last 400 000 years, and in particular the ongoing ice age, where mainly in the Holocene modern human civilisation flourished on the globe. The Quaternary glaciation is permeated with colder, full-glacial (denoted stadial) and milder (interstadial) periods. The interstadial period can last several decades to millennia. Daansgard–Oeschger events are fast transitions (in a climatic scale) between stadial and interstadial conditions.
Noticeably, there is no scientific agreement about the cause or origin of Dansgaard–
Oeschger events. At the beginning of this century, some authors suggested these event are periodic, roughly happening every 1 470 years [58], yet a view that these events are Poisson distributed seems more likely [59, 60]. More recent hypothesis, also backed by an agreement that Dansgaard–Oeschger events are world-wide effects, put weight on a cou- pled effect between ocean-atmosphere interaction. In particular, Dansgaard–Oeschger events could be coupled with changes of the Atlantic meridional overturning circula- tion [61], which manifests in a change in the mixing of the southern and northern water currents. The exact causal relation between Dansgaard–Oeschger events and changes in the Atlantic meridional overturning circulation is still unknown.
One interesting task is the examination of paleo-climate records under the purview
of data-driven stochastic models [62, 63]. In particular, due to the clear presence of two
distinct states in the paleo-climate proxy records of the global temperature, stochastic
models with bistable potentials have been proposed [64]. These models often are of-
ten pre-designed, i.e., carry already a set of underlying assumptions (e.g. Markovianity, memory components, delayed coupling), but have so far not included explicit discontin- uous trajectories. Moreover, the explicit functional forms of the drift or mean reverting terms are given a priori, and a subsequent best-fitting parameter extraction is sought.
This thesis discusses a particular non-parametric estimation of the parameters underly- ing the stochastic process driving the oxygen-18 and dust records, under the particular case of jump-diffusion processes.
1.3 Stochastic processes
This thesis is centred on continuous-time Markovian stochastic processes, yet not neces- sarily continuous processes. An extension of commonly employed Langevin-like stochas- tic processes with a jump component is presented as
dX(t) = a(x)dt + b(x)dB(t) + ξdJ(t), (1.1) where a(x) is the drift strength, b(x) is the diffusion or volatility, B(t) is a Brownian motion, and J(t) is a time-homogeneous Poisson jump process with rate λ(x, t) and an amplitude ξ that is normally distributed as ξ ∼ N (0, σ
ξ2) [49]. This thesis is centred on this particular choice of Poissonian jumps with Gaussian distributed weights, but the aforementioned model is extendable to other discontinuous types of jumps, e.g. Lévy or Beta-distributed processes [65]—naturally caring for the proper derivation of the relation between moments and parameters of the processes [66]. This model, in this specific formulation, was initially proposed in Ref. [47], derived in Refs. [67, 38], and extended to provide a formal derivation of the impact of discretisation as well as a criterion to discern between pure diffusions and jump-diffusion processes in Ref. [68].
1.3.1 Applications in power-grid frequency studies
For the study of power-grid frequency dynamics, an elementary Langevin-like approach is
offered [49]. More specifically, an Ornstein–Uhlenbeck process is employed as a surrogate
model for power-grid frequency is proposed, i.e., X(t) = ω(t) = 2πf (t), where f (t) is the
commonly used frequency minus the reference frequency of the grid. The drift coefficient
a(X) always features a mean-reversion term a = − θX(t) and possibly other deterministic
contributions. Furthermore, b(x) = σ is the volatility or diffusion coefficient, and B (t)
is a Brownian motion or Wiener process. The jump-like elements are not present in
power-grid models.
The model was motivated in Ref. [69], where it was proposed for the dynamical system’s model for a aggregated “bulk” angular frequency in Ref. [44] by incorporating an ad hoc stochastic uncorrelated “noise” element. In particular, the model is an extension of a simple swing equation, i.e., a second-order ordinary differential equation, augmented with a stochastic noise. This approach equates the mean-reverting term θ in a(x) to the aforementioned primary control, a second term proportional to in the integral over the frequency to be the secondary control, and a deterministic driver serving as a proxy for the imbalance of power. The stochastic noise of the process is added ad hoc with the desired complexity, i.e., so far solely uncorrelated Gaussian noise.
1.3.2 Applications in paleo-climate studies
In the context of paleo-climate studies the application of a bivariate jump-diffusion process is put forth. In particular, a data-driven derivation under the purview of dis- continuous stochastic processes is offered for the oxygen-18 isotope δ
18O and the dust recording for the last glacial period, roughly 120 000 to 10 000 years Before the Common Era (BCE), relating to Dansgaard–Oeschger events in this period. In this format, no explicit functional form for the drift a(x) or the diffusion b(x) is chosen a priori, these are extracted via non-parametric estimators. The presence of discontinuous transitions, i.e., the jump components, is motivated via a study of higher-order Kramers–Moyal coefficients and their scaling, and previous observation suggesting Dansgaard–Oeschger events are Poisson distributed.
1.4 Overview of relevant publications
This thesis comprises eight scientific publications, five of which are published, one sub- mitted, and two in preparation. These are:
#1 [published] L. Rydin Gorjão, M. Anvari, H. Kantz, C. Beck, D. Witthaut, M.
Timme, and B. Schäfer. Data-Driven Model of the Power-Grid Frequency Dynam- ics. IEEE Access 8 , 2020, pp. 43082–43097, Ref. [1].
#2 [published] M. Anvari, L. Rydin Gorjão, M. Timme, D. Witthaut, B. Schäfer,
and H. Kantz. Stochastic properties of the frequency dynamics in real and synthetic
power grids. Physical Review Research 2 (1), 2020, p. 013339. Ref. [2].
#3 [published] L. Rydin Gorjão and F. Meirinhos. kramersmoyal: Kramers–Moyal coefficients for stochastic processes. Journal of Open Source Software 4 (44), 2019, p. 1693, Ref. [3].
#4 [published] L. Rydin Gorjão, R. Jumar, H. Maass, V. Hagenmeyer, J. Kruse, M.
Timme, C. Beck, D. Witthaut, and B. Schäfer. Open data base analysis of scaling and spatio-temporal properties of power grid frequencies. Nature Communications 11 , p. 6362, 2020, Ref. [4].
#5 [in preparation] L. Rydin Gorjão, L. Vanfretti, D. Witthaut, C. Beck and B.
Schäfer, under the working title Phase and amplitude synchronisation in power- grid frequency fluctuations, Ref. [5].
#6 [published] L. Rydin Gorjão, J. Heysel, K. Lehnertz, and M. R. R. Tabar. Anal- ysis and data-driven reconstruction of bivariate jump-diffusion processes. Physical Review E 100 , 2019, p. 062127, Ref. [6].
#7 [submitted] L. Rydin Gorjão, D. Witthaut, and P. G. Lind. JumpDiff: A Python library for statistical inference of jump-diffusion processes in sets of measurements, submitted to the Journal of Statistical Software, 2020, Ref. [7].
#8 [in preparation] L. Rydin Gorjão, K. Riechers, F. Hassanibesheli, D. Witthaut, and P. G. Lind, under the working title Dansgaard–Oeschger events: Change in stability and jumps modelled via univariate and bivariate jump-diffusion processes, Ref. [8].
Part of this Doctoral thesis was also the making of Refs. [70, 71, 72] and the software in Ref. [73], but these four scientific works are not included in this thesis.
Publication #1: Data-driven model of the power-grid frequency dynamics
In this publication an easy-to-use, data-driven stochastic model is designed to gener-
ate exemplary trajectories of power-grid frequency. In the same manner, a set of non-
parametric estimators is offered to retrieve from data the primary and secondary control
mechanisms ensuring balance in power-grid frequency dynamics. A second-order stochas-
tic differential equation is presented, where the short-term primary control (acting in a
scale of a few seconds) is retrieved by extracting the drift coefficient a(x). The long-term
recovery control, the secondary control, is recovered by the deterministic exponential de-
cay of the power-grid frequency trajectories. Intrinsic stochastic noise is retrieve through
the diffusion terms b(x). Lastly, the flexibility of the model lies in the ability of adding a deterministic driving function for the power-grid frequency. The balance of power gener- ation and consumption is, from the point-of-view of a system operator, a deterministic driver function, where the difference should vanish. Excess or lack of power results in large deterministic deviations of the power-grid frequency.
The publication offers an explanation of why the statistics of power-grid record- ings in Continental European are always platykurtic, and conversely the Great British power-grid frequency recordings are leptokurtic, just as it is possible to do so with any deterministically driven stochastic system.
Publication #2: Stochastic properties of the frequency dynamics in real and synthetic power grids In this publication an extended examination of power-grid frequency recordings is offered for Continental Europe and Great Britain, for the years 2015, 2016, and 2017.
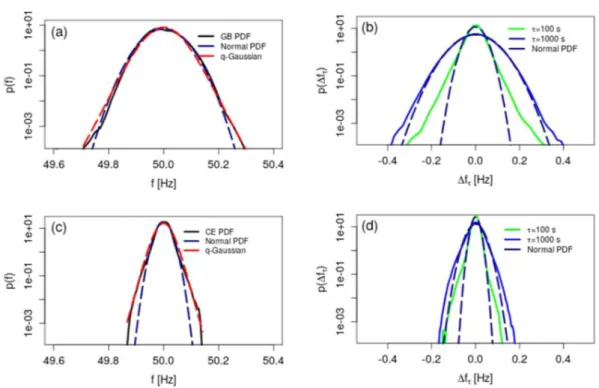
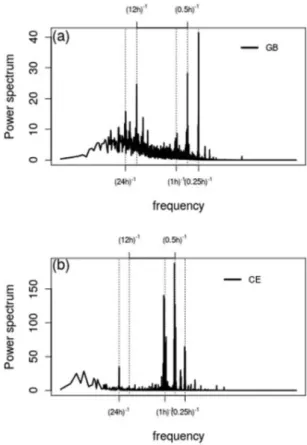
Taking an Markovian Ornstein–Uhlenbeck model as the basis of the analysis, a char- acteristic damping constant is obtained by analysing the autocorrelation functions of the data, yielding the relaxation time of power-grid frequency in both power grids. A study of the increments of power-grid frequency is put forth, where a super-statistical q-Gaussian (with q 6 = 1) is shown to fit the distribution of the increments. A study of the power spectrum is presented to justify the stationarity of the recordings, two three-point correlation functions are offered to justify time-symmetry in the data, and an examina- tion of the Chapmann–Kolmogorov test yields that the processes are Markovian. This early analysis of power-grid frequency records features a set of simplifying assumptions, which are critically reviewed in Section 3.1.
Publication #3: kramersmoyal: Kramers–Moyal coefficients for stochastic pro- cesses In this publication an N -dimensional non-parametric Nadaraya–Watson esti- mator of the Kramers–Moyal coefficients and conditional moments of stochastic time- series, to any desired order, is presented. The software is based on numerically efficient convolutional procedures in the computer language Python. The software was used ex- tensive in publications #1, #4, #6, and #7.
Publication #4: Open data base analysis of scaling and spatio-temporal prop-
erties of power grid frequencies In this publication a study of the statistical prop-
erties of an extensive data collection of power-grid frequency recordings is put forth.
The statistical properties of the distribution of the frequency in various grids around the globe is presented and a scaling of the diffusion coefficient b(x) first presented in Ref. [69] is confirmed. A subsequent analysis of spatio-temporally distributed recordings in Continental Europe in 2019, comprised of six synchronised measurements, reveals the existence of strong correlations of the increments of power-grid frequency time series. A study of a relaxation time for synchronisation is also presented, yielding a diffusion-like relation between relaxation time and squared-distance, resulting in a first examination of the relaxation of fluctuations in power-grid frequency dynamics, which seems to follow a diffusive behaviour.
Publication #5: Phase and amplitude synchronisation in power-grid fre- quency fluctuations In this publication a thorough examination of six high-frequency synchronous power-grid frequency recordings from the Nordic synchronous area is put forth. A separation of phase and amplitude synchronisation is proposed based on the distinction of temporal correlation and fluctuation relaxation of the incremental time- series of the power-grid recordings. Thus the scale of phase synchronisation is found to take place < 2 second scale whereas the amplitude synchronisation takes place in 2 ∼ 5 seconds. Moreover, phase synchronisation emerges in a linear relation in the spa- tial separation of recordings whereas amplitude synchronisation emerges diffusively, as first observed in Publication #4. Additionally, it is posited that the class of diffusive amplitude synchronisation falls in the category of a super-diffusive process, intrinsically linked with the temporal correlations of each timeseries, i.e., to their Hurst coefficient.
Publication #6: Analysis and data-driven reconstruction of bivariate jump-d- iffusion processes In this publication bivariate jump-diffusion process are introduced, alongside a data-driven, non-parametric estimation procedure of higher-order (up to 8) Kramers–Moyal coefficients, allowing the reconstruction of all relevant parameters in a jump-diffusion process. The procedure is validated numerically, presenting the limita- tions in the presence of coupled processes, the capability of retrieving the jump elements, and the numerical limitations for short timeseries.
Publication #7: JumpDiff : A Python library for statistical inference of jump-d-
iffusion processes in sets of measurements In this publication a Python library
denoted JumpDiff is presented, comprising of non-parametric estimators to retrieved
a relevant parameters of one-dimensional jump-diffusion processes. The software relies
of the mathematical methods derived in Publication #3, specialised for jump-diffusion processes in one dimension. Furthermore presented is a set of second-order corrections to the Kramers–Moyal operator, represented as the solution of the Kramers–Moyal equa- tion for discontinuous Markovian stochastic processes via a exponential representation and approximation of the Kramers–Moyal operator, extending the work in Ref. [74]. The software includes as well a criterion to discern between pure diffusions and jump-diffusion processes, following the basic methods introduced in Ref. [68].
Publication #8: Dansgaard–Oeschger events: Change in stability and jumps modelled via univariate and bivariate jump-diffusion processes In this publi- cation an analysis of Dansgaard–Oeschger (D–O) during the Last Glacial Period under the purview of bivariate jump-diffusion processes is presented. A data-driven analysis of δ
18O and dust recordings suggests that there is a change from a bistable to a unistable potential of the dust count, via an imperfect supercritical pitchfork bifurcation.
Furthermore, the δ
18O recording is discontinuous and thus best modelled via a jump-
diffusion model. The aforementioned criteria to discern between continuous and discon-
tinuous stochastic processes is employed to separate the stochastic nature of the δ
18O
and dust recordings. Lastly, the coupling of any terms in the bivariate jump-diffusion is
shown to be vanishing, suggesting that the D–O are deterministically triggered.
Chapter 2 Publications
2.1 Stochastic analysis and modelling of power-grid frequency dynamics
2.1.1 Publication #1
L. Rydin Gorjão, M. Anvari, H. Kantz, C. Beck, D. Witthaut, M. Timme, and B.
Schäfer. Data-Driven Model of the Power-Grid Frequency Dynamics. IEEE Access 8 , 2020, pp. 43082–43097, Ref. [1].
Status: published
15
Digital Object Identifier 10.1109/ACCESS.2020.2967834
Data-Driven Model of the Power-Grid Frequency Dynamics
LEONARDO RYDIN GORJÃO 1,2, MEHRNAZ ANVARI 3, HOLGER KANTZ 3, CHRISTIAN BECK 4, DIRK WITTHAUT 1,2, MARC TIMME 5,6,
AND BENJAMIN SCHÄFER 4,5,6
1Forschungszentrum Jülich, Institute for Energy and Climate Research—Systems Analysis and Technology Evaluation (IEK-STE), 52428 Jülich, Germany
2Institute for Theoretical Physics, University of Cologne, 50937 Cologne, Germany
3Max–Planck Institute for the Physics of Complex Systems (MPIPKS), 01187 Dresden, Germany
4School of Mathematical Sciences, Queen Mary University of London, London E1 4NS, U.K.
5Chair for Network Dynamics, Center for Advancing Electronics Dresden (cfaed), Institute for Theoretical Physics, Technical University of Dresden, 01062 Dresden, Germany
6Network Dynamics, Max Planck Institute for Dynamics and Self-Organization (MPIDS), 37077 Göttingen, Germany
Corresponding author: Leonardo Rydin Gorjão (l.rydin.gorjao@fz-juelich.de)
This work was supported in part by the Federal Ministry of Education and Research (BMBF) under Grant 03SF0472 and Grant 03EK3055, in part by the Helmholtz Association (via the joint initiativeEnergy System 2050 - A Contribution of the Research Field Energy, under Grant VH-NG-1025, in part by the German Science Foundation (DFG) by a grant toward theCluster of Excellence Center for Advancing Electronics Dresden(cfaed), in part by theSTORM - Stochastics for Time-Space Risk Modelsproject of the Research Council of Norway (RCN) under Grant 274410, and in part by the European Union’s Horizon 2020 Research and Innovation Programme under the Marie Skłodowska-Curie under Grant 840825.
ABSTRACT
The energy system is rapidly changing to accommodate the increasing number of renewable generators and the general transition towards a more sustainable future. Simultaneously, business models and market designs evolve, affecting power-grid operation and power-grid frequency. Problems raised by this ongoing transition are increasingly addressed by transdisciplinary research approaches, ranging from purely mathematical modelling to applied case studies. These approaches require a stochastic description of consumer behaviour, fluctuations by renewables, market rules, and how they influence the stability of the power-grid frequency. Here, we introduce an easy-to-use, data-driven, stochastic model for the power-grid frequency and demonstrate how it reproduces key characteristics of the observed statistics of the Continental European and British power grids. Using data analysis tools and a Fokker–Planck approach, we estimate parameters of our deterministic and stochastic model. We offer executable code and guidelines on how to use the model on any power grid for various mathematical or engineering applications.
INDEX TERMS
Stochastic modelling, power-grid frequency, swing equation, control systems, parameter estimation, Fokker–Planck equation, data-driven model.
I. INTRODUCTION
The energy system is currently undergoing a rapid transition towards a more sustainable future. Greenhouse gas emissions are reduced by implementing distributed renewable-energy sources at ever growing rates in the world [1]. Simultane- ously, new policies, technologies, and market structures are being implemented in various regions in the energy sys- tems [2]. These new market structures are not necessarily benefiting the stability of the power grid: A control power shortage in the German grid in June 2019 was potentially
The associate editor coordinating the review of this manuscript and approving it for publication was Roberto Sacile.
caused by unknown traders exploiting the energy market structure [3], [4].
The field of energy research itself is quickly developing and attracting researchers from various disciplines working towards new control systems, new market models, and new technologies every year [5], [6]. Regardless of the specific aspect of the energy system, one element remains unchanged:
The electrical power system and the stability of its frequency are critical for a stable operation of our society [7].
The power-grid (mains) frequency dynamics mirrors the balance of supply and demand of the power grid: An excess of generation leads to an increased frequency and a shortage of generation leads to a reduced frequency value. The power
This work is licensed under a Creative Commons Attribution 4.0 License. For more information, see http://creativecommons.org/licenses/by/4.0/
grid is stabilised by controlling the frequency and maintaining it at a nominal frequency [8]. But the task of maintaining a set frequency across an entire power-grid system is not a simple one: systems vary in size and structure, energy sources are possibly volatile in their output, as for example are wind or photo-voltaic generators [9], [10], and the dispatch of electrical energy and market activity have an impact on the overall dynamics.
Understanding the intricacies of the frequency dynamics becomes of great importance, both to control the current power grid [8], [11] but also for implementing real-time pricing schemes [12], [13] or smart grids in the future [14].
Solid estimates of fluctuations are essential for example when dimensioning back-up or control options, such as determining the capacity of batteries or other energy storage to balance periods with highly fluctuating demand or times without renewable generation [15]. Similarly, when establishing new power grid types, such as smart grids with potentially novel electricity market structure, the market design should ideally support the stability of the grid.
While both the power-grid frequency dynamics and the stochastic nature of the power-grid frequency have been intensely studied, we require a better understanding of the interaction of frequency dynamics with both stochastic fluc- tuations and market behaviour. The dynamics of the power- grid variables, including frequency, voltage, reactive power, etc., may be modelled with arbitrary complexity based on var- ious models [8], [11], [16]–[19]. Simultaneously, stochastic modelling of fluctuations within the power grid [18], [20] still often uses Gaussian noise models [14], [21], [22], while non- Gaussian statistics [9], [23] as well as deterministic events caused by trading [24] are rarely included.
Existing literature that explicitly deals with realistic fore- casts of the power grid frequency often focuses on inverter control [25] or the power interface between grid layers [26].
Alternatively, forecasts are done for electricity consump- tion [27] or for renewable generation, such as solar gen- erators [28]. In contrast, models that predict or even give stochastic characteristics of the power-grid frequency are very rare [29].
Here, we propose an accessible and easy-to-use stochastic model that seeks to describe the dynamics of the power-grid frequency in a reduced framework combining stochastic and deterministic factors acting on the power-grid frequency. We focus on the intermediate time scale of several seconds to few hours, leaving very short or very long time scale for future work. Simultaneously, our modelling approach balances the benefits of realistic case studies, generally applicable and abstract stochastic models as well as application-oriented data-driven approaches.
We first review the factors influencing the power-grid fre- quency dynamics, based on frequency recordings from Euro- pean grids. Next, we introduce a general stochastic model and discuss three particular cases of how the model may be imple- mented. For each case we estimate the system parameters,
such as control strength and noise amplitude using stochastic theory and data-driven approaches.
We compare the frequency statistics of the models with real-world measurements to showcase how they reproduce characteristic features. Overall, our modelling approach is very flexible and easily applicable to many different power grids and could be used for planning purposes, e.g. when set- ting security operational limits or designing markets. We pro- vide executable code for the model in the supplementary material.
II. FACTORS IMPACTING THE POWER-GRID FREQUENCY
To construct a model describing the intermediate time scale dynamics and characteristics of the power-grid frequency, we must first recall the nature and the intricate details of the power-grid frequency dynamics, both deterministic and stochastic, as we observe them in frequency trajectories [30], see Fig.
1.FIGURE 1. The frequency dynamics is influenced by both stochastic and deterministic aspects.The trajectory of the power-grid frequency is substantially influenced by stochastic effects, as seen by the erratic motion. In addition, we observe deterministic behaviour: Every 15 minutes (vertical lines) the frequency abruptly decreases and then slowly trends upwards for the next 15 minutes. The plot uses the TransNetBW data [30] from the European Central power grid CE, from January, 10th2019, 20:45 to 21:45.
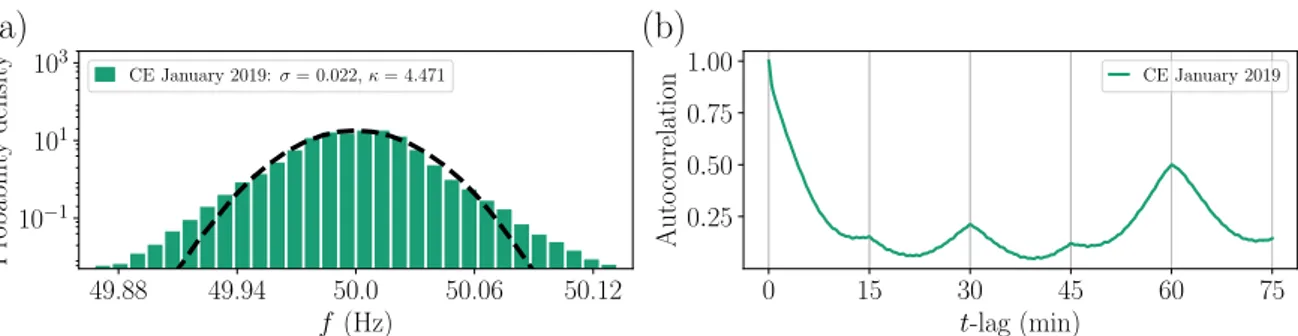
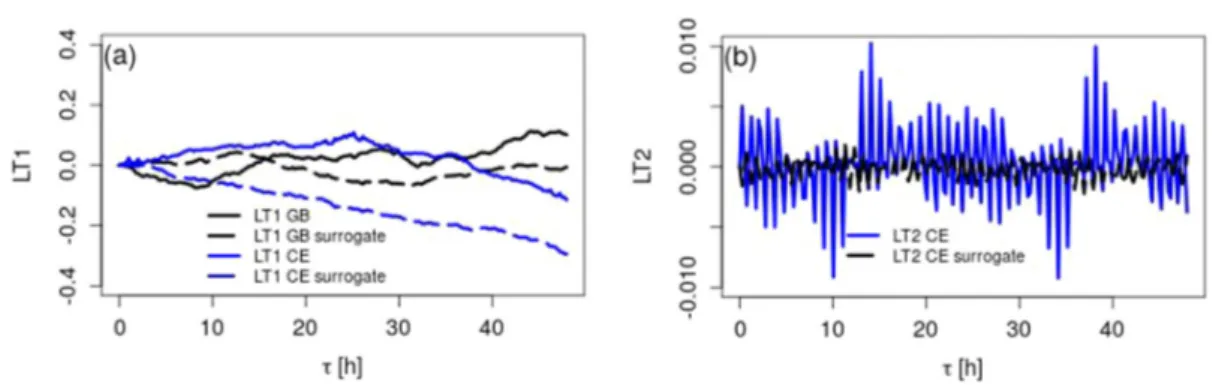
The power-grid frequency is not following a simple Gaus- sian process but displays heavy tails and regular correlation peaks, see Fig.
2and [23], [31], [32] for more detailed anal- ysis. To get a better understanding of the different factors impacting the grid frequency, we give an overview of these:
First, we review the innate and humanly devised control systems, continue with the market and power dispatch design and close the section with a stochastic description of the noise acting on the power grid.
A. THE FUNDAMENTAL CONTROL SCHEMES
The power supply of the grid is designed so that the frequency
of the alternating current is kept steadily at a fixed nominal
value, i.e., 50 Hz in Europe and many parts of the world,
or 60 Hz in the Americas, Southern Japan and some other
regions. The electrical frequency of e.g. 50 Hz corresponds
to large mechanical generators rotating in synchrony at this
frequency (or integer multiples of it) across each synchronous
region, such as the Continental European grid. How is this
frequency kept fixed when facing fluctuations or larger dis- turbances?
Suppose a large generator disconnects from the grid while the power demand in the region stays constant. The missing energy cannot be drawn from the grid itself, as it cannot store any energy directly [34]. Instead, power is first provided by inertial energy until primary, secondary, and potentially tertiary control set in to ensure the provision of the miss- ing power [34]. In the first moments after the disturbance, the missing power is drawn from the kinetic energy of the large rotating machines. Their kinetic energy is converted into electrical energy and the generators are slowed down, thereby reducing the overall frequency in the grid. This
iner- tial responseensures the system does not drift off from its designed nominal frequency too rapidly and smoothens any disturbances. Nevertheless, the generators continue to slow down. Moments later,
primary controlactivates: Dedicated power plants, and recently also battery stacks [35], measure the deviation of the frequency from the reference and insert additional power into the grid proportional to the frequency deviation. This power influx prevents a further decrease of the frequency and stabilises it at a fixed but lower frequency, which is not desired for operation, as any further problems might cause the frequency to leave the stable operational limits [8], [34]. While the primary control compensates for the missing power, the kinetic energy of the rotors is still lower than initially and thereby the frequency is not at the reference value. To restore the frequency back to the reference frequency an integrative control,
secondary control, is neces-sary. A few minutes after the disturbance, this control fully restores the energetic state and the grid is brought back into a new stable state at its nominal frequency (i.e., 50 Hz or 60 Hz, depending on the grid in question). On even longer time scales of potentially hours,
tertiary control, often operatedmanually, sets in [36]. As this tertiary control sets in, primary and secondary control can be reduced to become available for further control actions.
Here, we focus on the effects of inertia, as well as pri- mary (proportional) and secondary (integrative) control in our synthetic model. The time scales of these three controls are significantly different, and they functionally react to devi- ations of different variables of the system: Where primary control stabilises the grid based on the frequency deviations of the system, the secondary control balances the total power to ensure stability based on an integral of the frequency, i.e., an angle.
As a recent challenge, the replacement of conventional power generators with renewable generators reduces the overall system inertia [37] and thereby makes comple- mentary control mechanisms or virtual inertia increasingly important [38].
B. ELECTRICITY DISPATCH AND MARKET
While the control schemes keep the frequency close to the reference for small and unforeseen changes of supply and demand, an electricity market has been established to
coordinate longer-term power dispatches dealing with large and predictable variations.
The effective demand acting on the power grid is the aggregation of millions of consumers throughout the syn- chronous region. This aggregated demand is continuously changing over time since consumption during the day tends to be higher then during the night and industrial activities during the week lead to higher consumption than during the weekends [34].
The continuously changing demand has to be met with sufficient supply of electrical power in the same synchronous grid. Therefore, power plant operators have to adjust their generation according to the needs of the consumers. While some power plants, such as gas turbines, can ramp their generation up or down very fast, other plants, such as coal or nuclear power plants, require more time and therefore prefer to commit generation for longer time periods [36], [39].
Demand response schemes, where consumers shift their demand to periods of higher generation, bring additional flexibility to the grid [40].
To reach an economic optimum on who is supplying and when, power-plant operators bid on spot markets to offer power generation [36]. This includes a
day-aheadmarket to fulfil the expected power demand, and an
intra-daymar- ket acting on time scales of few hours to several minutes, to balance short-term mismatches, amongst other [41]. This bidding on the market takes place in discrete time-slots: Any power provided by one operator is provided for a fixed inter- val, e.g. one hour, half an hour, or 15 minutes, as is often the case, such as in the European Energy Exchange (EEX) [42].
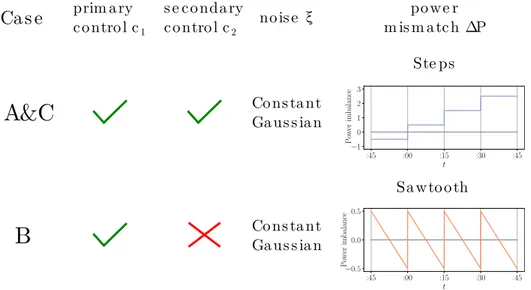
An important consequence of the fixed intervals of gen- eration is that it does not perfectly fit the smooth demand curve. If we approximate a monotonically increasing demand function (such as during the early morning hours) with a step function assuming the mean for a given time interval, we will initially overestimate the demand, which is still growing.
After some time, supply and demand perfectly match but then the demand surpasses the supply again. This leads to the balance between supply and demand being approximately a sawtooth function, see Fig.
3.Indeed, we also observe the consequences of the intervals when analysing the frequency trajectory [24] or its auto- correlation in the Continental European grid. The frequency displays regular surges and sags approximately every 15 min- utes, where the supply updates to the new demand interval.
At full hours these effects are more pronounced since the total dispatch and trading volume is higher at full hours compared to other 15 minute intervals [43]. Not only the frequency tra- jectory displays these jumps and sags, see Fig.
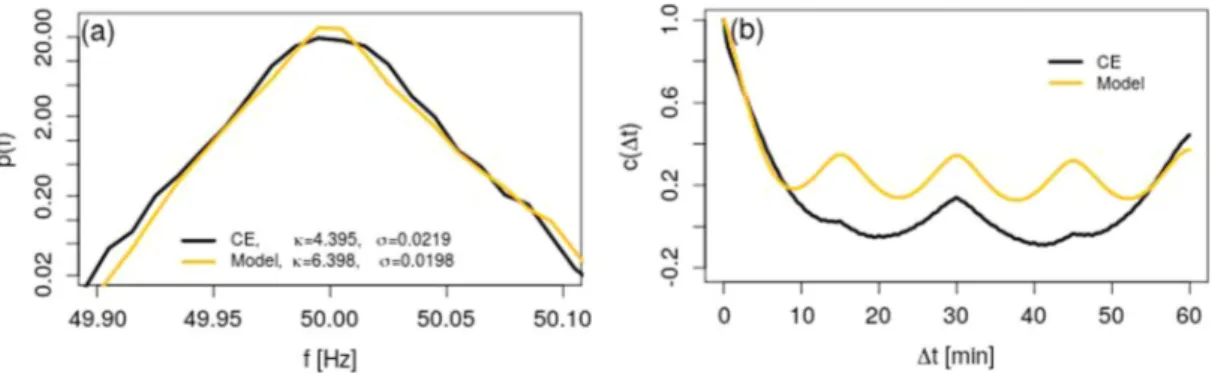
1but also the autocorrelation function of the power-grid frequency
c(1t)reveals distinct peaks at 15, 30, 45 and 60 minutes, see Fig.
2and [23], [31].
We will include the market influence by employing a deterministic power-mismatch model in our stochastic model.
But more importantly, we can extract vital information by
observing this phenomenon, as we will highlight below.
FIGURE 2. The power-grid frequency is heavy-tailed and has regular correlation peaks. (a)The frequency histogram displays heavy tails, which are quantified by a kurtosisκthat is much larger than the Gaussian value ofκGaussian=3. Consistently, the best-fitting Gaussian distribution (dashed line) does not capture the tails.(b)The autocorrelation function of the grid frequency decays exponentially within the first minutes, which is a typical behaviour for many stochastic processes [33].
In addition, the autocorrelation peaks every 15 minutes due to trading activity. The plots use the TransNetBW data from January 2019 [30].
FIGURE 3. The effective power balance approximates a sawtooth function over time.We schematically depict the interplay between generation, demand and the resulting power imbalance:(a)While the demand curve is approximately smooth, the scheduled generation approximates the curve using step functions.(b)The resulting power balance is approximately a sawtooth function with jumps upwards and ramps downwards if the demand rises and ramps upwards and jumps downwards if the demand decreases. Here, we display all jumps with the same height for simplicity. In our model, we use different jump heights of the Heaviside and thereby also of the sawtooth function for hourly, half- or quarter-hourly jumps.
C. NOISE
So far, we have introduced the two deterministic elements of our model: Control in the form of inertia, primary and secondary control, and electricity trading occurring at fixed times. We are only missing the stochastic element of the model, i.e., the
noiseacting on the system. Noise here is meant as any form of stochastic fluctuation. Its sources are plentiful, ranging from demand fluctuations [40], [44] to intermittency in the renewable generators [9], [45], ther- mal fluctuations, and others, many of which are typically unknown [23]. However, the precise origin of the noise is not essential for our modelling approach. In fact, we only observe the cumulative effect of the noise in how it influences the power-grid frequency, regardless whether it originates from local disturbances or system-wide variations. Aggregating all sources of noise allows it to be handled as a stochastic process, see also [32] for more details.
As a first approximation for the noise, we will assume white Gaussian noise, based on two important observations.
First, Gaussian noise arises naturally in many settings due to the
Central Limit Theorem. In its simplest form it states thatthe sum of randomly drawn numbers, in our case the aggrega- tion of renewable, demand and any other form of fluctuation, approximates a Gaussian distribution if sufficiently many
contributions are summed up [33]. Second, we note that non- Gaussian frequency distributions can easily be described by super-imposed Gaussian distributions, following
superstatis- tics[23], [38], [46], where parameters, such as the standard deviation change over time. Moreover, the above mentioned trading intervals are known to contribute significantly to these tails [31].
If so desired, employing another form of noise is left open in the model, without any fundamental change of the model itself. There are plenty of non-Gaussian sources of noise impacting the power grid, such as jump noise from solar panels [9] or turbulence from wind turbines [20], [47].
Instead of Gaussian noise, we could include for example non- Gaussian effects via Lévy-stable distributions or
q-Gaussiandistributions [38], [48].
III. DATA-DRIVEN MODEL
Now, we formulate a simple dynamical model for the fre-
quency dynamics that includes all factors influencing the
power-grid frequency. First, we present the model and explain
how the above-mentioned factors enter the model. We then
discuss special cases of how some parameters could be set
as constants or as time-dependent. We close the section by
proving the theory to estimate the parameters of the model.
For simplicity, we do not use the frequency
fas the vari- able but the bulk angular velocity
ω =2
π (f −fref), with reference frequency
fref=50 or 60 Hz, i.e., we move into the rotating reference frame. In this frame, the dynamics of the angular velocity
ωand the bulk angle
θmay be modelled in an aggregated swing equation [49] as
dθ dt
=ω, Mdω
dt
= −c1ω−c2θ+1P+ξ.(1) The factor
Mgives the inertial constant of the system and sets the time scale it reacts to changes. For simplicity, we absorb it in the remaining constants and set
M =1 in the following, i.e.,
c1→c1/M,
c2→c2/M,
1P→1P/Mand
→.
The term
−c1ωmodels primary control and general damp- ing acting on the system [16], [34]. The larger the deviation from the nominal frequency, i.e., the larger
ω, the larger the damping and control force.
The expression
−c2θmodels the secondary control [50], [51]. If the system deviates from the nominal frequency, e.g. because
ω >0 for a long time, then the bulk angle
θincreases more and more and thereby the secondary con- trol increases and acts as an increasing force to return the system towards the nominal frequency. We use the simplest integral control, whereas other secondary control implemen- tations [50], [52]–[56] might be considered in the future.
Typically, the magnitude of the primary control parameter is much larger than the secondary control parameter
c1 c2to implement that primary control acts faster than secondary control.
The power mismatch is given as
1P. It contains onlythe deterministic mismatch between supply and demand.
If generation surpasses consumption,
1Pbecomes positive and vice versa. In our market model, we will employ a time-dependent
1P, inspired by empirical power trajectories,see Fig.
3.Finally,
ξdenotes the aggregated noise acting on the sys- tem. As pointed out in the previous section, we assume
ξto be white Gaussian noise, i.e., its time average is zero
hξ(t )
i =0 and its correlation is zero for non-identical times, i.e., it is a delta function
hξ(t)
ξ(t
0)
i = δ(t
−t0) [33]. Extensions using correlated or non-Gaussian noise are also possible in the same framework and can prove very useful if the noise function or its characteristics are known. From an
a prioripoint-of- view, employing coloured noise would required an explicit knowledge of its presence in power-grid frequency systems and would complicate the parameter extraction.
The model (1) is very general as we have not yet specified the parameters
c1,
c2, or the function
1P. Note again thedifferent roles of primary and secondary control: Assume
1P = P0 >0, this will increase the angular velocity
ωand thereby the angle
θ. Without secondary control and noise, i.e.,
c2 = =0, the new quasi–steady state becomes
ω∗ ≈ P0/c1 >0. The full fixed point
ω =0 can only be restored with an additional (integrative) secondary control.
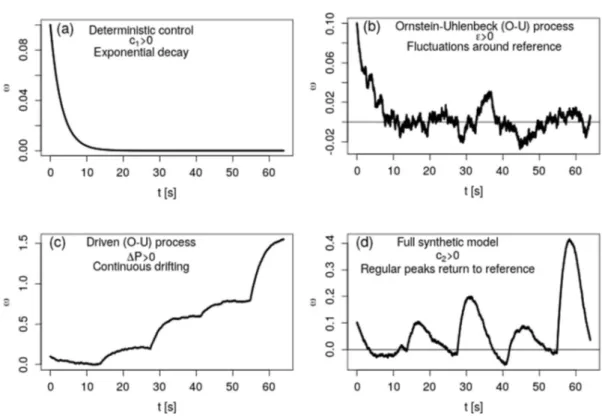
A. CASES
We consider some special cases of parameter choices for model (1) here. Theoretically, the model proposed so far would allow that the three parameters
c1,
c2, and are chosen as zero or non-zero constants, time-dependent functions, or to follow their own stochastic process. Similarly, the power mis- match
1Pcould be any function, as long as the differential equation is still well-defined. We review three cases, see also Fig.
4for an overview.
The distinguishing factor between those cases is the role of secondary control
c2and power imbalance
1P: Any non-zero power imbalance
1Pwill be compensated by secondary control if
c2 >0. This means from a data-analysis it is vir- tually impossible to distinguish cases where
1P=0 and no secondary control is active or
1P6=0 and secondary control restored the frequency or a case where a slowly changing
1Prestored the frequency on its own without secondary control active. Complementary, large and rapid changes in the power imbalance are clearly visible in the frequency trajectory and always have to be included in the models.
Case A: A simple starting point is to setc1
,
c2, and all as non-zero constants. By including an active secondary control, we neglect slow changes in the power imbalance
1Pand assume that secondary control is the main restoring force fol- lowing a sudden jump. Specifically, we assume that the power mismatch
1Pis given as a piece-wise constant function, i.e., a Heaviside function. This model has the advantage that we can easily estimate all parameters from the trajectory.
Case B:
Alternatively, we may neglect the effects of sec- ondary control, setting
c2 =0. To balance the frequency, we then require a balanced power dispatch on average, i.e.,
h1Pi =0. A simple function to realise this, while maintaining the jumps, which are visible form the frequency trajectories, is a sawtooth function, i.e., piecewise linearly increasing or decreasing over time. Similar to Case A, we still use constant non-zero
c1and
.Case C: We again repeat Case A but instead of estimating
the power mismatch
1Pfrom frequency trajectories, we use historic demand data of Germany, based on data published by ENTSO-E [57].
B. ESTIMATING PARAMETERS