A spatial electricity market model for the power system: The Kazakhstan Case Study
Makpal Assembayevaa,b, Jonas Egererb,e, Roman Mendelevitchc,d,∗, Nurkhat Zhakiyeva
aNazarbayev University, National Laboratory Astana, Laboratory Energy, Ecology and Climate, 53 Kabanbay batyr ave., 010000 Astana
bTechnische Universitat Berlin, Workgroup for Infrastructure Policy (WIP), Straße des 17. Juni 135, 10623 Berlin
cGerman Institute for Economic Research (DIW Berlin), Dept. Energy, Transport, Environment, Mohrenstr. 58, 10117 Berlin
dHumboldt Universiat zu Berlin, Resource Economics Group, Unter den Linden 6, 10999 Berlin
eFriedrich-Alexander-Universitat Erlangen-Nurnberg, Chair of Economic Theory, Chair of Industrial Organization and Energy Markets, and Energie Campus Nurnberg (EnCN), Lange Gasse 20, 90403 Nurnberg
Abstract
Kazakhstan envisions a transition towards a green economy in the next decades, which poses an immense challenge as the country's economy and energy system depends heavily on (hydro-)carbon resources. Here, it lacks inclusive and transparent tools assessing technical, economic, and environmental implications resulting from changes in its electricity system. We present such a tool: our comprehensive techno-economic unit- commitment model determines the hourly least-cost generation dispatch, based on publicly available data on the technical and economic characteristics of the system. It accounts for particularities of the Kazakh electricity system by representing combined heat and power, and endogenously determining line losses.
Model results examine two typical weeks: winter (annual peak load) and summer (hour of lowest annual load) presenting regionally and temporally disaggregated results for power generation, line utilization, and nodal prices. In an application to market design, the paper compares nodal and zonal pricing as two possible pricing schemes in Kazakhstan for the envisioned strengthening of the day-ahead market. The model analyze the current Kazakh electricity system and can be easily expanded to assess the sector's future development.
Possible applications include investment in generation and transmission infrastructure, policy assessment for renewables integration, carbon pricing, emission reduction, and questions of market design.
Keywords: Kazakhstan, Central Asia, Electricity sector, Techno-economic modeling, Transmission network
∗Corresponding author
Email address: roman.mendelevitch@hu-berln.de (Roman Mendelevitch)
Accepted manuscript of the article published in "Energy": https://doi.org/10.1016/j.energy.2018.02.011
© 2018. This manuscript version is made available under the CC-BY-NC-ND 4.0 license
2018-01-14
1. Introduction
The energy sector of Kazakhstan faces many challenges but also opportunities in the upcoming decades.
It could foster its role as a transit hub with the development of transmission infrastructure linking Russia, Central Asia, and China. Kazakhstan, with its reliance on oil exports and coal-red power generation has to nd its place in a world which moves towards a sustainable energy supply. And last but not least, the energy sector might follow a pathway towards a more transparent and competitive market design. Thorough analyses on these developments in Kazakhstan require qualitative and quantitative research to which this paper contributes focusing on the electricity sector.
In the time of the Soviet Union, the electricity system of Kazakhstan was split between the northern regions with large coal generation capacities (connected to the Russian network) and the Central Asian Power System (CAPS) in the south, which relied on regional cooperation on water (and hydro power) management of river basins. Despite signicant oil reserves, there was no development of an oil industry on larger scale.
After the breakdown of the Soviet Union had caused a severe economic downturn, international investments, mainly in the oil sector, allowed Kazakhstan to restore its economy and to provide funding for improving infrastructure and living conditions. In the 1990s, Kazakhstan accomplished privatizations of formerly state owned companies and promoted unbundling of integrated utilities in the energy and other sectors (even though there has been some re-nationalization since). However, the economy continues to strongly rely on oil revenues due to its low level of diversication and it is closely linked to the Russian economy through the Eurasian Economic Union [1].
The economic downturn in the 1990s had a strong impact on the electricity sector as dwindling demand levels resulted in the shutdown of half of the generation capacity and the decay of the remaining capacity.
In addition, with the independence of Kazakhstan, the national electricity system was split in three separate transmission networks. While the regional cooperation on electricity trade and river basin management with its southern neighbors in the CAPS collapsed almost completely, Kazakhstan gradually enforced the national transmission system, e.g., connecting its southern and northern network by a 500 kV transmission line in 2009 [2]. The cooperation with Russia remains signicant in the operation of the electricity system even though annual trade levels are very volatile over years. The western network still is not connected directly to the rest of Kazakhstan and only linked to the Russian system.
While electricity demand had recovered to the levels seen before 1990 in 2014, levels shifted from regions with a traditional strong industrial basis (the industry GDP share decreased from 25 to 19 percent between 2000 and 2014 [3]) to the commercial sector, mainly in larger cities, and to the oil producing regions.
These developments aect the regional distribution of electricity demand. Non-oil industrial activity is concentrated in the north-eastern regions of East Kazakhstan, Karagandy, and Pavlodar, with strong ties to the Russian economy while oil and gas resources and associated industries are based in the western regions of Mangystau, Atyrau, and Western Kazakhstan. The other regions are still characterized by agricultural and commercial activities. So far, the demand growth of electricity in the respective regions could be met by reactivation and retrotting of mostly old and mothballed generation units and the enforcement of the transmission system.
In 2013, Kazakhstan's 2050 strategy [4] expected a continuous growth of electricity demand requiring imminent investment in new and therefore more expensive coal-red power plants (e.g., project of Balkhash coal power plant). While wind and solar generation capacities were expected to increasingly supply the growing electricity demand, a reduction of carbon emissions in the electricity sector was not envisioned before 2030. Large capacities of combined heat and power (CHP) plants are a distinctive feature of the electricity sector in Kazakhstan. Here, the 2050 strategy suggests a fuel switch from coal to natural gas in CHP plants in proximity to cities to reduce local air pollution. Contrary to the projection of fast growing electricity demand, levels stagnated after 2013 and, together with lower electricity exports to Russia, excess generation capacity remains available in the system. At the same time, investments in new coal generation capacity was postponed. In the end, this development could allow a more sustainable pathway for the electricity sector as time might play in favor of renewable technologies.
This example illustrates the importance to conduct qualitative and quantitative research on the devel- opment scenarios of the energy sectors. Compared to other regions (e.g., Europe and North America) the
literature on the energy system of Kazakhstan, and in particular on its electricity sector, is rather limited (see Section2). However, a better understanding of the technical system characteristics and the underlying energy economics is vital for a transparent discussion and decision making. This requires the development of tools for technical and economic system analysis such as the techno-economic electricity sector model in this paper.
In addition to scenario analysis for future generation and transmission development with a sucient spatial representation, questions of market design receive increasing attention in Kazakhstan. Since 2000, the Kazakhstan Operator of Electric Power and Capacity Market (KOREM) has the task to organize the centralized electricity wholesale market [5]. Energy supplying organizations (ESOs) have been established in 2004, serving as regional single buyers of electricity and as regional monopoly supplier for end consumers [6].
Since 2013, the Natural Monopolies Regulation Agency of Kazakhstan (NMRA) sets up regional taris for end consumers, which are further dierentiated by the annual level of electricity consumption and by the temporal consumption pattern. The taris are xed for three years with the possibility for annual adjustment [7]. Being introduced for tracking energy usage and creating incentives for investments in energy eciency, some argue that their inexible structure and uncertainty about future adjustments hamper positive eects [8]. Average end consumer prices for electricity were in the range between 10.0 KZT/kWh and 19.5 KZT/kWh in 2016, with highest prices in the region Kostanay and lowest prices in Aktau [9].
Despite formal vertical unbundling of generation and transmission companies, mid- and long-term bilateral contracts accounted for 90% of the total transactions and the day-ahead market for the remaining share [6].
Electricity supply is mostly covered from regulated xed tari contracts with generation companies, with only 3% of the demand covered by market trades, in 2015. In addition to the feed-in tari scheme for renewable generation which is in place since 2014 [10], there are eorts to enforce stronger market-based elements in the electricity sector with the plan to have regional auctions for renewable capacities [11] and by pricing carbon emissions. These instruments foster a gradual low-carbon transformation of the sector as required by the Green Growth Strategy 2050 [4].
While quantitative research is important for the understanding of system and market operation and for possible changes in the market design, it relies on transparency and the availability of system data. In Kazakhstan, the lack of a functioning wholesale market, low competition levels, and limited transparency are obstacles for publicly accessible information. However, system and market data are important to im- prove electricity sector models which can be applied to reveal ineciencies and potentials for improvement in the sector design. This paper makes one step in the direction of more transparency by providing a spatial electricity sector model for Kazakhstan, together with a detailed description of the model dataset in the ac- companying data in brief publication [12]. The unit-commitment model determines the least-cost generation dispatch of the power plants. It applies a simplied combined heat and power representation via seasonal operational constraints. The spatial scope of the model follows a nodal representation of the transmission system, providing insightful results on regional characteristics of the current power system.
As of 2016, the Kazakh electricity sector remains heavily regulated on generation taris and electricity prices. The model setup, optimizing for the least-cost generation dispatch assumes the existence of a central entity which determines ecient power plant operation and provides hourly locational marginal prices.
Possible steps in that direction could be the introduction of a power exchange or of an independent system operator. In an application on market design, the paper compares the nodal pricing regime to a spatial aggregation of the nodal representation into four price zones in Kazakhstan.
In future work, the model framework can be easily extended by, e.g., (i) generation and transmission investment to analyze scenarios for sector transformation, (ii) extending the model scope to neighboring countries to address questions of coordination, or (iii) a more detailed representation of cross-sectoral links, e.g., river-basin management, district heating, natural gas networks, and transportation. Such an extended version could provide additional insights into current potentials to harvest synergies between dierent energy sectors in Kazakhstan and between national energy systems in Central Asia. In addition, the model could evaluate possible scenarios for the sustainable transformation of the Kazakh energy system with increasing shares of renewable energy and indicate infrastructure requirements in the power system and in other related sectors.
The remainder is structured as follows. Section 2 provides a literature review, followed by the mathe-
matical model description in Section3. Section4describes the input data, Section5the model results, and Section6 concludes.
2. Literature Review
2.1. Modeling the energy and electricity sector
Energy system and specic energy sectors models provide an important tool for the analysis and the understanding of these complex systems which are at the nucleus of for the low-carbon transformation. A large portfolio of models exist in the academic literature.
Pfenninger et al. [13] classify models according to the dierent challenges which they address. They dierentiate between energy system models for normative scenarios, energy system simulation models for forecasts, power systems and electricity market models for analyzing operational decisions and qualitative and mixed-methods for narrative scenarios.
Energy system models such as PRIMES [14], MARKAL [15], EFOM [16] or POLES [17] are able to convey the big picture of what is happening in dierent linked sectors of an energy system. These technology- oriented models focus on the energy conversion system, on the demand-side (e.g., eciency measures) as well as on the supply side (e.g., generation technologies). The advantages of this type of models are that they cover several sectors, linking them through endogenous fuel substitution. They are solved by optimization techniques when minimizing system costs or maximizing the overall welfare. Another class of energy system models focuses on accounting and simulation e.g., LEAP [18]. These models provide a detailed representation of the current state of an energy system and can be applied to evaluate energy policies and energy scenarios.
A comprehensive overview on the wide range of computer tools used to study the integration of renewable energy into various energy systems and for dierent objectives is provided by [19].
Apart from energy system models, there is a large strain of literature that employs one sector models to assess e.g., electricity markets. These models can be categorized in optimization, and equilibrium mod- els, further dierentiated following their market representation by treatment of uncertainty, the generation system, and the market rules, as well as distinguished by their choice on the temporal and geographic representation [20]. Equilibrium models can address a large variety of research questions on electricity markets, e.g., analyze non-cooperative rm behavior, evaluate dierent risk attitudes and explicit shadow prices, consider resource adequacy [21], assess the impact of environmental regulation [22], renewable obliga- tions, and portfolio standards (see e.g., [23] and [24]), or evaluate coordination among transmission system operators [25]. Examples for optimization models in the context of regulated electricity markets are the DIETER model [26] or the ELMOD model [27], taking a social planner or cost-minimizing perspective to assess investments in electricity infrastructure, congestion management, and market designs. Other models focus on uncertainty, balancing, and intra-day markets [28] and on the spatially resolution [29], the temporal resolution [30], or both of them [31,32].
As argued by [33], the sustainable transformation of energy systems will result in stronger system and market integration between dierent sectors. This requires a smart energy system, which combines smart electricity, thermal, and gas networks with storage technologies raising the importance of coordination, which allows for harvesting synergies between individual sectors as well as for the overall energy system.
While energy system models try to convey the big picture for smart energy systems, they are limited in their representation of temporal, spatial, technical, or market characteristics of individual sectors which are important for a detailed model representation. In comparing energy system and power sector models, [34]
argue that energy system and power sector models used to answer separate questions and hardly combined their advantages. In the last years, the sustainable energy transition increasingly requires single sector models to follow the idea of smart energy systems and consider cross-sectoral approaches by combined analysis of more than one sector, e.g., the electricity sector and the heat market with storage possibilities for exibility. Three examples of linking the two worlds from the perspective of energy system models are: a large-scale multi-fuel investment model which is formulated as an equilibrium model in order to bridge the gap between sector models and energy system models [35], a combination of a general equilibrium model and an electricity dispatch model to examine the implications of transmission expansion and renewable energy
penetration in Europe [36], and a soft-link between an energy system and a power system model to study the systematic errors that occur when using energy system models for power system design [37].
2.2. Existing models for Kazakhstan and Central Asia
For the region of Kazakhstan and Central Asia, the development of energy system and electricity sector models has only started in the 2000s and the literature, in particular the documentation of the models, is just beginning to evolve (see Table 1). It builds mostly around applications of the MARKAL/TIMES and the LEAP model framework. The existing literature covers a range of topics including projections of greenhouse gas (GHG) emissions [38], evaluations of climate policy instruments [39], assessments of the energy saving potential for Kazakhstan [40, 41] and an analysis of opportunities for emission reduction investments in Central and West Asia regions [42]. To quantify the eects of reforms for energy subsidies in Kazakhstan, [43] develops a partial-equilibrium model. [44] use a MARKAL/TIMES model to evaluate the economic prots in cooperation between Central Asia and Caspian countries through the dierentiation of their export routes. [45] analyze climate change and energy eciency policies using a TIMES-Kazakhstan model to nd ways how to achieve the governmental targets of decreasing GHG emissions in Kazakhstan. [46]
develop an econometric model for estimating electricity demand in the industrial, residential, commercial, and other sectors of Kazakhstan until 2015.
Models which have been used for Kazakhstan are mostly bottom-up energy system models. They cover multiple sectors and consider spatially aggregated regions as well as either a single or a small set of seasonal time slices. While this approach is sucient to analyze the development of a fossil-fuel-based power system, the increasing share of uctuating renewable generation in electricity supply requires models with a high temporal and spatial resolution. These aspects are better addressed in sectoral models which are also favorable in representing the technical and inter-temporal characteristics of storage technologies, electricity ows in the transmission network, and the volatile character of regional electricity load.
Few studies on the power system of Kazakhstan and Central Asia have employed electricity sector models. [47] have created the EPIC (Environmental Policy and Institutions for Central Asia) modeling system with the aim to optimize the regulation of water resources and the regional distribution of the associated hydroelectricity of the Aral Sea. Later [48] used this model to solve water and energy problems of the Kyrgyz energy system considering national benets and regional water requirements. With ELMOD- KAZ, we presented a rst basic version of a bottom-up electricity sector model in a policy report on 2030 and 2050 scenarios for Kazakhstan [49]. This model optimizes the generation dispatch and electricity ows for a nodal network representation of the high-voltage transmission system, but abstracts from CHP constraints, network losses, imports and exports, and a zonal market representation. The model of this paper adds the aforementioned details incorporating a detailed spatial and temporal representation of the electricity sector which, it partly links to the district heat demand.
[place table 1 here]
3. Mathematical formulation of the electricity sector model
The electricity sector model in this paper minimizes variable generation costs of the power plant dispatch in Kazakhstan given technical, spatial, and temporal constraints. We apply the model to a market design with locational marginal pricing by representing the network nodes of the high-voltage transmission system and to a scenario with zonal markets as one possible alternative. The model follows the approach presented in [27] and [51] and signicantly extends the basic ELMOD-KAZ model [49] with the representation of CHP generation constraints and transmission network losses, and cross-border imports and exports.
This section is organized as follows: the objective function and nodal energy balances are dened in Section3.1, Section3.2describes the representation of CHP plants, Section3.3introduces the DC load ow approach, Section3.4details the implementation of transmission losses, and Section3.5describes a possible model aggregation to price zones. The notation is listed in the Appendix.
3.1. Cost-optimal generation dispatch
The objective function of the model in Eq. 3.1a minimizes variable generation cost of the power plant dispatch, including marginal costs M Cp for conventional electricity generation enpt by generation units p and cost of lost loadV OLLfor energy not servedensnt. In the model setup, energy not served is a measure of last resort to guarantee feasible model results and to identify critical supply and network situations at a nodal level as it reduces nodal demand in Eqs.3.1b/3.4b.1
The energy balances in Eq.3.1bensure that at every network node nand in every time slicet the sum of conventional electricity generation, generation from renewable energy sourcesRESnt, net input from the transmission network nint, imports IMnt, and energy not served is equal to electricity demand DEMnt
and exports EXnt (Kirchho's rst law). Renewable generation is assumed to be non-dispatchable and implemented with assumptions on nodal hourly availability levels.
Constraints on maximum and minimum available generation capacity for conventional power plants are given in Eqs.3.1c3.1d, where CAPpP+ is the maximum and CAPpP− the minimum of the technically operational capacity of a generation unit,AVpt states its hourly availability, and onpt is a binary variable dening if the unit is in operation or not in the respective hour.
min c
enpt,ensnt=X
pt
(enptM Cp) +X
nt
(ensntV OLL) (3.1a)
X
p∈Pn
enpt+RESnt+nint+IMnt+ensnt=DEMnt+EXnt ∀ n, t (3.1b)
enpt≤CAPP+p AVptonpt ∀ p, t (3.1c)
enpt≥CAPP−p onpt ∀ p, t (3.1d)
3.2. Representation of combined heat and power
The electricity and the heat sector can be linked on the supply side (CHP plants) and on the demand side (power-to-heat). The representation of these links can be implemented in electricity sector models at dierent levels of technical detail. There is a broad literature on the optimization of CHP plants with detailed representation of non-linear technical constraints. [52] take the perspective of an industry CHP plant optimizing operation with a generalized mode model under consideration of electricity prices. In a similar problem formulation, [53] apply MINLP (mixed-integer nonlinear programming) to model nonlinear dynamics of a CHP plant and its individual components to solve the scheduling problem. [54] consider uncertainty, electric and thermal storage systems, and consider a security constrained power system in CHP operation while [55] determines the optimal installation size for thermal storage based on a method with a sliding time window. Such approaches are suitable for operational decisions in regional heat markets or individual industry CHP plants but dicult to implement in an optimization model at the electricity system level. Larger systems require simplifying assumptions on operational modes with linear approximations.
In the electricity sector model of this paper, it would be possible to include the hourly supply and demand balance of several regional district heat networks. This would require information for each separate heat network on hourly heat demand as well as on CHP plants, heat boilers, and possibly heat storage. Espe- cially for systems with higher renewable shares, this representation might be suitable to consider additional exibility from the heat sector by using power-to-heat and thermal heat storage. However, the detailed representation of the regional heat systems is often challenging due to a lack of publicly available data for
1The cost gure ofV OLLis generally several times higher than the most expensive generator (we assume 100 KZT/kWh for VOLL). In the model results, the current system is capable to supply the electricity demand (as we discuss in the result section), therefore,V OLLdoes not factor into the model results.
regional heat demand and technical information, e.g., on CHP plants and heat boilers. One possibility to abstract from a detailed representation of the heat system requires assumptions on power plant operation, e.g., [56] x the minimum operation requirements for CHP plants according to assumptions for winter and summer hours. This allows to approximate their historic mode of operation but restricts the model in using possible additional exibility which might exist at the link between the electricity and the heat sector.
The model in this paper applies the approach of [56] by setting minimum generation requirements and must-run operation (onpt= 1) for CHP plants (Eq. 3.2), where CAPH−pt is the minimum operational capacity of a CHP generation unit due to minimum heat output levels. Together with the technical minimum operation level, either3.1dor3.2are the binding constraint depending on the level ofCAPP−p andCAPH−pt . In this representation, the heat output itself is not described in the model. On the demand side, the model assumes exogenous hourly electricity demand levels which include demand for electric heating.
enpt≥CAPptH−onpt ∀ p∈Pchp, t (3.2)
3.3. Representation of the transmission network and line contingency
Following [57], the direct current load ow (DCLF) representation (i.e., a simplication and linearization of AC power ow) determines power ows in the model according to technical and physical line ows constraints. Line owspflt and net inputnipt are dened in Eqs.3.3a3.3b, while Eq.3.3climits the ow on every transmission line. Hln calculates from the line's resistances and reactances and its start and end node whileBnkfurther aggregates this information to network nodes. The DC load ow formulation requires dening one slack nodenˆ withθntˆ = 0for each network.
pflt=X
n
(Hlnθnt) ∀ l, t (3.3a)
nint=X
k
(Bnkθkt) ∀ n, t (3.3b)
−CAPlL≤pflt≤+CAPlL ∀ l, t (3.3c)
The network operator, responsible for ensuring reliable system operation, does not allow to use the full thermal capacity of a transmission line but reserves a transmission reliability margin (TRM) to account for inherent uncertainty in system conditions and the need for operating exibility [58]. The power ow limitCAPlLfollows this argumentation and includes a TRM of 20% reducing line capacities to 80% of their respective thermal limit. The TRM tries to approximate network operation, which is n-1 secure, i.e., the possibility to compensate the outage of one component/line by the remaining system without causing the break-down of the system.
3.4. Transmission losses
The Kazakh electricity system transmits electricity over long distances causing signicant losses in the high-voltage network, which reached 6% of total generation in 2015 [59]. Losses on transmission lines depend on the line's technical characteristics (its material, length, and voltage level) and have a non-linear relation to the load ow level.
The literature provides various approaches to include transmission losses in the context of locational marginal pricing models. Losses on transmission lines are commonly assigned to the adjacent network nodes in the model representation [60]. In the context of transmission expansion planning and dispatch problems, variable line losses with a non-linear relation to load ow levels are often omitted. Variable line losses can be approximated with a xed estimated loss ratio for each transmission line in the nodal energy balance. [61]
present a model where losses are balanced at each node to represent the impact on line ows. [62] apply an
advanced iterative methodology for representing losses using line loss cuts for relevant operational points.
In [63], losses are represented by distributing a share of total losses to each node and quadratic nodal losses are approximated by iteratively adding linear constraints. [64] use a 3-segment piece-wise linear approach for transmission losses to study the electricity system of New Zealand verifying their results with an AC load ow analysis. The original quadratic loss curve is replaced by a piece-wise linear loss function which allows for implementing losses in a linear model framework.
This paper applies the latter approach in a simplied version with only one linear segment to approximate line losses for the Kazakh electricity system. Nodal transmission losses are calculated as the sum of half of the linearized losses on all adjacent lines. This approximation overestimates losses for low lines utilization and, vice versa, underestimates losses for high lines utilization. The model implements line losses with two equations. Eq.3.4acaptures the absolute value of losses on a line, calculated as line owpfltmultiplied with a line specic loss factor, which is calculated based on a line's length and voltage level. Eq.3.4b provides an extended energy balance (cf., Eq.3.1b) including the distribution of line losses to the adjacent nodes.
loss+lt−loss−lt =LClpflt ∀ l, t (3.4a)
X
p∈Pn
enpt+RESnt+nint+IMnt+ensnt
=DEMnt+ 0.5 X
l,n∈Aln
(loss+lt+loss−lt) +EXnt ∀ n, t (3.4b) 3.5. Zonal pricing
Contrary to nodal pricing, zonal pricing provides an alternative for the market representation of spatial system constraints. While in theory, nodal pricing is considered the rst best, zonal pricing can increase liquidity by providing larger markets within each zone. However, zonal markets are less suitable for highly meshed systems as they abstract from the load ow characteristics and ignore capacity constraints of all internal lines by providing an aggregated zone-to-zone net transfer capacity (NTC) into the market. The representation of price zones in the electricity sector model requires an aggregation to one energy balance per zone in Eq.3.5d, which replaces the nodal energy balances of Eq.3.4b. The net transfer capacityN T Czx between two connected zones in Eq.3.5arestricts the directed inter-zonal trade owszfzxt and replaces the DCLF approach. To reect the long transmission distances and related transmission losses in Kazakhstan, also the zonal approach considers transport losses for inter-zonal tradelossZzxt in Eq.3.5b, which aect the zonal network inputniZztin Eq.3.5c.
zfzxt≤N T Czx ∀ z, x, t (3.5a)
lossZzxt=LCzxZzfzxt ∀ z, x, t (3.5b) niZzt=X
x∈Z
((zfxzt−zfzxt)−0.5(lossZzxt+lossZxzt)) ∀ z, t (3.5c) X
p∈Pz
enpt+ X
n∈Nz
(RESnt+IMnt+ensnt) +niZzt= X
n∈Nz
(DEMnt+EXnt) ∀ z, t (3.5d)
4. Input data
The bottom-up techno-economic electricity sector model for Kazakhstan applies a detailed spatial rep- resentation of the power system, therefore requiring information on technical, geographic, temporal, and
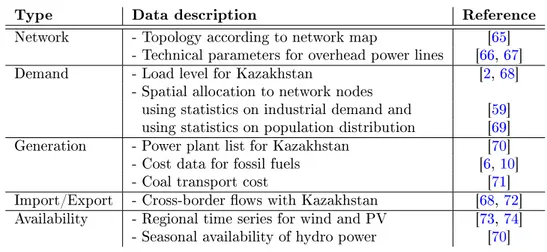
economic parameters. In the following, this section describes the dataset: Section4.1 focuses on network data, Section4.2on electricity demand, Section4.3on power plant data, Section4.4on economic parame- ters, and Section4.5on cross-border trade with neighboring countries. To a large extend, the dataset relies on the publicly available data sources summarized in Table2. More information on data structure, gures for input data, and data sources is provided in the accompanying data in brief publication [12].
[place table 2 here]
4.1. Network data
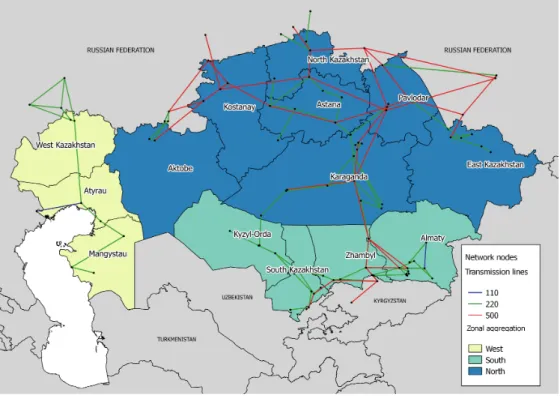
The electricity sector model of this paper represents the transmission system of Kazakhstan at a nodal level which allows for a wide variety of techno-economic analysis. This approach requires detailed geographic and technical information on the transmission network, namely the location of the substations and the topology and technical parameters for the high-voltage transmissions lines. Figure 1 presents the model implementation of the topology of the transmission network of Kazakhstan according to the transmission system operator's (KEGOC) grid map [65]. The network of KEGOC consists of 310 transmissions lines between 35 kV and 1150 kV which have a total length of about 25,000 km [59, 65]. In general, KEGOC divides the transmission system of Kazakhstan into nine regional centers for operational principles (security in network operation) and also uses the administrative division of Kazakhstan in 14 districts. This paper follows the latter regional representation at district level and also states results at a more aggregated level, i.e., for the three regions West, South, and North as illustrated in Figure1.
[place gure 1 here]
In the dataset of this paper, the power grid of Kazakhstan is represented by 97 network nodes and 193 high-voltage transmission lines between 220 kV and 1150 kV and selected 110 kV lines for better representation of electricity consumption in the Almaty region. Each network node represents a substa- tion including its geographical location and can by connected to electricity demand and generation units.
Thereby, substations which have one transmission line passing through and which are not the end-point of their line are not included in the network representation and their generation and demand is allocated to the closest network node (i.e., either an end-point of a line or an intersection of several lines). The model approach abstracts from a representation of technical information on transformers as they are neglected in the implementation of the DC load ow linearization. In addition to 74 network nodes in Kazakhstan, the dataset also contains 23 external nodes in neighboring countries which allows for the implementation of cross-border ows.
The input data on transmission lines contains information on 193 individual connections: 40 lines with the voltage level of 500 kV (including four lines of 1150 kV currently operated at 500 kV), 126 lines with 220 kV, four lines with 110 kV, and 23 cross-border lines to external nodes. Technical characteristics of the transmission lines such as voltage level, line length, number of circuits, power ow limits, and loss factors have been taken from [59]. Assumptions on the additional line parameters reactance, resistance, and thermal limits are made for each line according to its voltage level [66,67].2 Of the 23 cross-border lines, 18 connect the power system to Russia, 4 to Kyrgyzstan and 1 to Uzbekistan. The total number of lines that are situated on Russian territory but connect two substations in Kazakhstan is 20. For Kyrgyzstan there are six such lines and ve for Uzbekistan.
Following [66] the loss factor per 100 km is in range of 0.51% for lines at 500 kV and between 3.54.5%
for lines of 220 kV and 110 kV. The constant loss factor in the model is 1% for lines of 500 kV and 4% for lines of lower voltage level.
4.2. Electricity demand
After years of growth, national electricity demand reached 89.17 TWh in 2013 and stagnated thereafter on similar levels with 90.85 TWh in 2015 [59]. This demand is unevenly distributed throughout Kazakhstan and
2The thermal limit of 500 kV lines is reduced to have a more realistic representation of the line characteristics in Kazakhstan.
In the model their maximum capacity for one transmission system is 1,100 MW (i.e., 880 MW considering the 20% TRM) and 340 MW for a line of 220 kV.
shows a strong seasonal variation. The largest electricity consumers with 45% of total power consumption are located in the northern and eastern regions (Figure2a).
To calculate hourly nodal demand in 2015 we took the following steps: Hourly national consumption data is available for 2013 [68]. Annual consumption for each of the 14 administrative regions is available for both 2013 [68] and 2015 [59]. For the spatial demand allocation, hourly demand proles from [68] are distributed to the 14 regions based on annual regional demand from 2013 [68] and assumptions on residential and industry demand shares. In a nal step, nodal demands in one region are proportionally increased to match regional demand in 2015. Details on the calculation of nodal hourly demand are also given in [12].
Residential demand for electricity is aggregated in 24 consumption nodes representing 24 cities of Kaza- khstan (Figure2b). They include 2 cities of national signicance (Almaty and Astana), 14 administrative city centers, and 8 cities with a population over 70,000 [69]. The demand curve of the residential sector is calculated based on the consumption rate of three regions of Kazakhstan with high population density and a low share of industrial demand (i.e., the regions Kyzylorda, North Kazakhstan, and West Kazakhstan).
Industrial demand is based on the demand of fteen major companies constituting 35% of the overall energy consumption of Kazakhstan [59]. According to [2], the industry sector is composed of plants that produce non-ferrous metals, mine iron ore, coal and oil, treat water, supply electricity for railroad operations, etc. We assume that the hourly demand pattern of these industries is steady. The residential and industrial demand nodes are geographically matched to the closest of the 74 network nodes (substation) in the high-voltage transmission system. A group of objects (generation, demand, or substation) which belong to the same region and are located in the same area are grouped in one node.
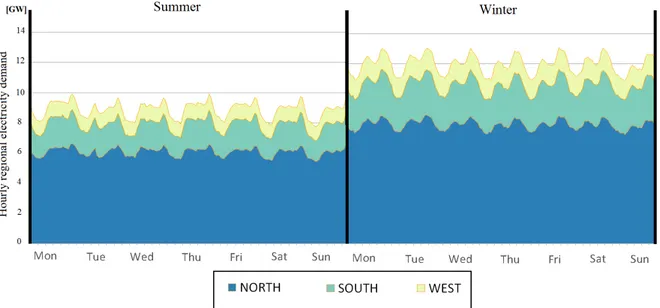
For the calculations in this paper we focus on two typical weeks to account for seasonal and hourly characteristics in electricity demand. One week (winter week) covers the annual demand peak of about 13 GW, the other week (summer week) includes the lowest o-peak demand with about 8 GW (Figure10).3
[place gure 2a and 2b here]
4.3. Data on power plants
The input data on generation capacity contains information on all 74 conventional power plants (by generating unit) in Kazakhstan which have a total installed capacity of 20.6 GW. Technical data includes fuel type, generation technology, installed turbine capacity, eciency factors, minimum load levels, seasonal availability factors, the geographic location, and the connecting network node.
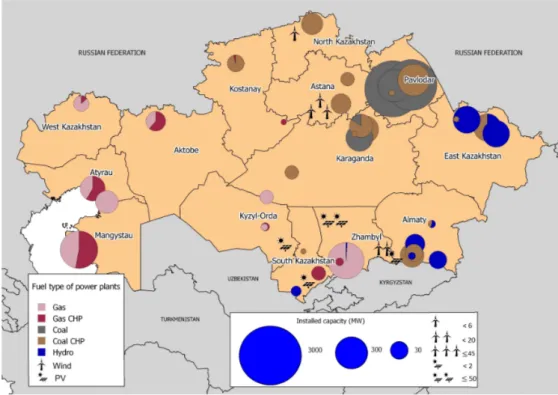
As of 2016, the largest share of electricity generation in Kazakhstan relies on fossil fuels. The spatial distribution of conventional power plants illustrates a special characteristic of the electricity sector in Kaza- khstan. Most of the electricity-only generation capacity is provided by coal power plants (7.1 GW) in the north-east (Pavlodar) which are supplied by large local coal elds and i) power the local heavy industry and ii) feed surplus electricity into the high-voltage transmission grid. While coal fuels CHP plants for district heating in all demand centers in the north and east, natural gas powers most electricity-only and CHP plants in the south and all generation in the west (see Figure3). Electricity-only power generation is dominated by few large installations (19 units with a total of 10.5 GW). CHP generation capacity makes up a large share of the remaining installed capacity (40 power units with 7.5 GW). Therefore, its representation in the electricity sector model has strong implications on the results. Using historical data on heat output and making own assumptions, the model representation of CHPs is as follows: i) industrial CHPs operate at a constant level throughout the year providing a steady heat and therefore also power supply; ii) minimum generation requirements are dened for all other CHP units based on data of seasonal electric and heat output levels.
Renewable generation capacity is provided mainly by 15 hydro power plants with a capacity of 2.6 GW and an annual generation output of 9.3 TWh in 2015 [59]. The ve largest hydro power plants are located at the Irtysh River in East Kazakhstan and many smaller ones in the mountains of the Almaty region.
Their seasonal availability factors are calculated based on data provided by [70], resulting in a combined
3While the two weeks are sucient to showcase the functionality of the model and to derive interesting results, for other applications the model can be easily extended to an hourly representation (8760 h) if data is available.
generation output for all hydro power plants in Kazakhstan of 1.7 GW in the summer and 1.5 GW in the winter.
Even though most regions in Kazakhstan promise a signicant wind and solar potential [75], electricity supply from wind and PV does not play a signicant role in the Kazakh electricity system. The rst capacities were brought online in 2015: 70.1 MW of wind, located in the regions North Kazakhstan and Akmola and at the border to Kyrgyzstan and 52.8 MW of PV, located in the regions South Kazakhstan, Zhambyl, and Almaty. The model data is based on information for annual generation output of [76] and on historical data on wind speed and solar radiation. Wind speeds from meteorological stations [73] are used to calculate hourly time series with availability factors for each network node. This information can be translated in power output of wind power plants using Weibull probability distribution functions. Solar radiation data from [74] is applied in a similar manner to calculated normal (Gaussian) distribution for the network nodes. The distribution functions are scaled to represent values of hourly availability between 0 and 1.
[place gure 3 here]
4.4. Economic parameters
Kazakhstan is a major producer and consumer of coal, accounting for around 4% of the world total coal reserves. Kazakhstan's coal is characterized by very low production cost compared to other CIS states [2].
Coal with the lowest production cost is located in the Northern part of Kazakhstan but the nal price for coal increases signicantly (e.g., in Almaty region) with long distances from the mining region due to high rail transportation costs. Data on coal production and transportation cost, which is used to calculate marginal generation cost for coal-red generation units was taken from [71] and [10].
[place table 3 here]
According to [2] Kazakhstan has around four trillion cubic meters of gas reserves. Nevertheless, gas consumption accounts only for 17.5% of the country's primary energy balance. Most of reserves are located in Western Kazakhstan and the gas pipeline network connects the west to the south but except for Kostanay not to the North of Kazakhstan. The prices for natural gas vary signicantly within the country with lower prices in the west [71].
Marginal generation cost from renewable energy sources, such as hydro, wind, and photovoltaic are assumed to be zero as we only regard short-run marginal costs. Depending on the research question, one can easily extend the plant specic variable generation costs with a price for carbon emissions and with variable operation and maintenance costs. Aggregated information on technical and economic characteristics of current Kazakh power plants are reported at the technology level in Table3.
4.5. Imports and exports
The Kazakh network operator publishes an annual report [59], stating volumes for annual inter-regional network ows within Kazakhstan and annual cross-border trade with neighboring countries. In 2015, imports amounted to 1.7 TWh, exports to 1.6 TWh, and electricity transmission, at the inter-regional level on the high-voltage network within Kazakhstan, to 37.9 TWh, whereof transit services (Russia-Kazakhstan-Russia) accounted for almost 10%. There is no public data on hourly import and export ows between Kazakhstan and its neighboring countries. For the borders with southern neighbors, this is not causing major implications on model results. There is some electricity trade between Kazakhstan and Kyrgyzstan on small scale (below 0.5 TWh), which mainly depends on the coordination between electricity demand in the winter and down- stream water demand in agriculture for irrigation in the summer. While there has been no electricity trade with Uzbekistan in 2015, the implications for the Northern border with Russia are more severe, as annual imports and exports are signicantly higher. In 2015, Kazakhstan imported 1.5 TWh from Russia, exported 1.0 TWh, and provided a transit service for 3.7 TWh.
While we made assumptions on hourly imports and exports calibrating input data for the annual trade volumes, a more detailed representation of electricity trade, especially with Russia, would require either additional public data sources or a an extension of the model scope to neighboring countries.
5. Model results
The results in this paper illustrate the functionality of the electricity sector model for Kazakhstan and provide an application with price zones. Section5.1describes the hourly generation dispatch with the lowest variable generation costs possible. The results are aggregated by technology for the two weeks with the hour of highest and lowest electricity demand. Section 5.2 discusses nodal results on network utilization and locational marginal prices for the average of both weeks, as well as for the summer hour with lowest demand and the winter hour with highest demand. Section 5.3 examines the possibility of introducing a market design with an aggregation of network nodes into four price zones which are derived from the insights of the nodal model results.
5.1. National and regional generation dispatch by technology
The hourly national generation dispatch in Kazakhstan for two selected weeks is illustrated in Figure4.
The two weeks represent a summer week with the hour of lowest national electricity demand and a winter week with the hour of peak demand. Hourly electricity generation and imports cover electricity demand, network losses, and exports.
The national hourly generation prole highlights the central role of hard coal and CHP plants (coal and gas) for electricity generation in Kazakhstan. Generation patterns for hydro power and electricity-only coal-red power plants do not exhibit much seasonal variation.
Electricity-only coal-red power plants (with 15% higher generation output in the winter) cover about 48% of demand in the summer week and 42% in the winter week. Generation from wind and solar plays a minor role in total electricity generation in Kazakhstan as of 2015.4 Therefore, the largest dierence in absolute seasonal generation levels can be observed for CHP plants, which have to cover seasonal base- load heat demand resulting in a minimum must-run operation level. Hourly variation of electricity load in the summer is mostly covered by coal-red electricity-only power plants which have the lowest variable generation costs. In the winter week, these power plants also provide a signicant share of the variability on the supply side. However, they must be complemented by more expensive gas turbine power plants due to higher overall demand levels and higher load variation between night and day. Compared to the summer week, CHP plants cannot provide additional peak load generation in the winter week. Due to higher base- load heat demand, they operate constantly at their maximum output level while additional heat-only boilers, which the model does not represent, would have to cover the peak heat demand.
[place gure 4 here]
[place gure 5 here]
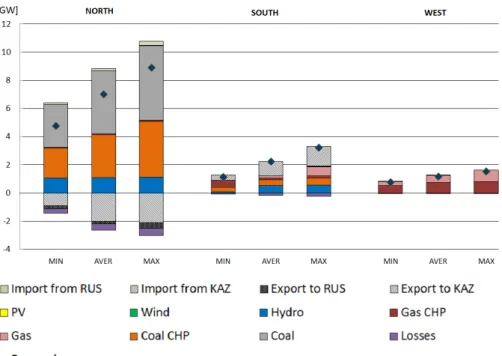
Figure 5 presents zonal generation proles for the hour of minimum, average, and maximum demand (of the two examined weeks). The least-cost generation dispatch sees excess generation from coal-red electricity-only power plants in the North. This surplus supplies the South in all load situations and increases with electricity demand levels.5 In summer hours with low demand, the South relies (to a smaller extent) on imports from the north as it covers about half of its electricity demand with local hydro power and 30% with must-run CHP generation. While imports from the north are signicantly higher in the winter, higher electricity demand in the South and import constraints in the transmission network require additional electricity generation from more expensive local gas-red electricity-only power plants. The separate network in the West relies on electricity supply from natural gas ring in CHPs and electricity-only plants. While the CHP plants operate more constantly, electricity-only plants cover higher electricity demand levels during the day.
The average level of transmission line losses accounts for 6.8% of consumption. Hourly losses (relative to load) are somewhat higher in the summer and in o-peak hours and lower in winter hours with high demand.
In total, signicant line losses occur in West and North regions due to long distances and high transmission volumes (more precisely in the regions Atyrau, Karaganda and Pavlodar) and on the long transmission lines towards the South (between Karaganda and Kyzylorda).
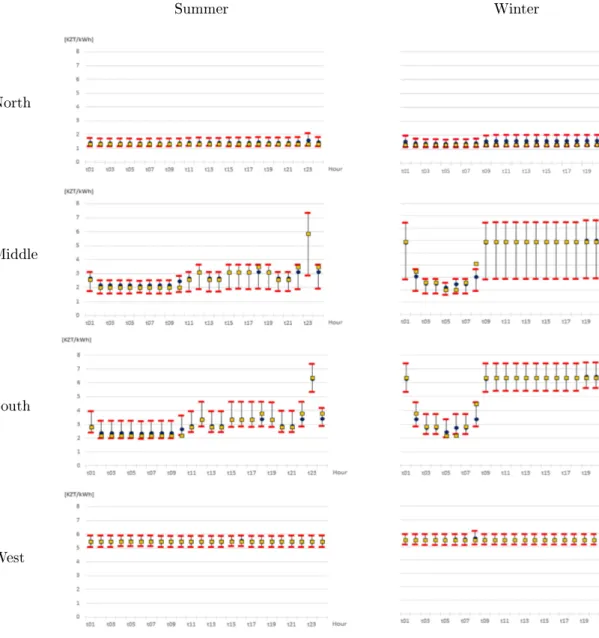
4Respective average regional generation levels are reported in Figure11in the Appendix.
5A further disaggregation of generation by region, which can be found in Figure11in the Appendix, shows that excess supply is generated in Pavlodar, whereas the regions Aktobe and South Kazakhstan rely on imported electricity.
5.2. Locational marginal prices and utilization of transmission lines
The nodal model results allow for insights in the utilization of transmission lines and the determination of potential bottlenecks in the network, as well as for economic indicators with locational marginal prices for Kazakhstan.
The results for average line utilization in Figure 6indicate, that there are no permanent bottlenecks in the network and that most lines have an average utilization below 50%. While gas-red power generation causes higher average nodal prices in the separated network in the West, average nodal prices also dier between the northern and the southern nodes. Lowest nodal prices are observed in the northern part of the country (starting at about 1.2 KZT/kWh for mine-mouth coal-red power plants in Pavlodar and rising to 2.5 KZT/kWh for more distant coal-red power plants with higher fuel prices due to coal transportation costs or network losses) and increase from the southern (between 2.5 KZT/kWh and 3.7 KZT/kWh) to the western nodes (peaking at 5.8 KZT/kWh). These results suggest bottlenecks on some lines in the transmission system between the North and the South in certain hours.6
Results on line utilization and nodal prices for the hour of lowest load in the summer (Figure7) show no congestion in the transmission network. Nodal prices have similar levels of about 1.4 KZT/kWh and deviate to the extent of transmission losses as must-run CHPs, hydro generation, and coal-red generation in Pavlodar (setting the marginal price) cover electricity demand. Only the West of Kazakhstan experiences signicantly higher prices of about 5.9 KZT/kWh due to continuous operation of gas turbine plants.
The peak load situation in the winter (Figure8) shows higher nodal prices in the entire country. Nodal prices in the northern part of Kazakhstan increased by about 60% (compared to average levels) to about 3.7 KZT/kWh. High demand results in line congestion on the north-south inter-connectors leading to a stronger increase of nodal prices in southern Kazakhstan up to 7.4 KZT/kWh, which is ve times the price of the low demand hour. Nodal prices do not increase in western Kazakhstan because gas turbine power plants remain the marginal generators. Electricity prices are lower than in southern Kazakhstan due to lower natural gas prices.
[place gure 6a and 6b here]
[place gure 7a and 7b here]
[place gure 8a and 8b here]
5.3. Zonal pricing in Kazakhstan
The scenario with zonal pricing discusses a market design which relies on power exchanges and bidding zones, which is closer to the European power market design. In the case of Kazakhstan, the three regions West, North, and South in Figure1could provide reasonable price zones. To highlight the network situation between the regions Pavlodar and Karaganda, the zonal scenario assumes Karaganda region as additional bidding zone separating it from the North. This is done to account for network congestion and the charac- teristic of Karaganda region as transit hub between the North and South (see Figure11). The assumptions are: the trade capacity (NTC value) between the price zones NorthMiddle and MiddleSouth is 1500 MW each. To represent transmission losses in the zonal market design, trades between NorthMiddle (Middle South) have to provide an additional 4% (8%) of the trade volume for losses. This representation of losses is not common in zonal markets but it could be a reasonable assumption for systems with long-distance transmission lines and high transmission losses.
Table4 below indicates generation results and inter-zonal trade (results are scaled to the annual level).
The zonal results show once again the high dependency on electricity generation in the North and the resulting trade ows and losses.7
[place table 4 here]
6Three lines (neglecting the western part) show average utilization levels close to the maximum of 80% considering a reliability margin of 20%. These lines connect power generation in Pavlodar region: to the South, to an industrial demand center in Karaganda region (iron and steel factory ArcelorMittal Temirtau), and to Astana region.
7The losses in the zonal scenario should not be misunderstood as technical network losses. Following the large geographic distances between the zones the methodology assumes a loss factor for inter-zonal trade in the zonal market design.
Zonal prices in the West (Figure9) remain constant over the entire year at about 5.5 KZT/kWh, repre- senting the marginal generation costs of gas-red power plants. The deviation in prices around this values for some nodes results from network losses within the bidding zone which are not represented in the zonal scenario. The average hourly nodal price (weighted with nodal demand) from the nodal results is well in line with the zonal price in the zonal scenario.
A similar pattern in terms of hourly price stability results in the North, yet at a signicantly lower level of about 1.3 KZT/kWh. This price reects marginal generation costs of the electricity only coal-red power plants. Whereas the zonal price is close to the average nodal price of about 1.4 KZT/kWh in the summer, it underestimates average nodal prices of about 1.6 KZT/kWh during day-time in the winter when nodal prices ranges from 1.32.0 KZT/kWh in the North. Therefore, prices in the zonal scenario do not cover for the entire short-run cost from power generation and inter-zonal network losses.
[place gure 9 here]
Hourly patterns of zonal prices in the Middle and South varies signicantly from the North. During night-time, the constraint on the inter-zonal NTC capacity between North and Middle is binding in all hours, resulting in prices of about 2.0 KZT/kWh in the Middle. This price reects the marginal generation costs of local coal-red power plants and the slightly higher prices in the South account for the additional loss factor. Binding NTC capacity from the North together with higher electricity demand during the day causes signicant higher price spreads. Prices in the Middle and South range between 2.83.8 KZT/kWh in the summer (even higher for peak demand) and between 5.96.3 KZT/kWh in the winter. While zonal prices are close to average nodal prices for most hours, there are deviations in some hours (questioning the right choice for the NTC level for that particular hour). Extreme variations for nodal prices in the South and in particular in the Middle could be an indicator for additional internal bottlenecks within the zones or insucient representation of transmission losses in the zonal market representation.
All in all, zonal results for the electricity system of Kazakhstan are promising but also indicate the short- comings of the zonal design in relation to the rst best of nodal pricing. The strict geographic orientation of the Kazakh transmission network from North to South makes Kazakhstan more suitable for bidding zones than for example a highly meshed system, but comparatively high transmission losses have to be considered suciently.
6. Conclusion
In this paper we present a comprehensive techno-economic model of the Kazakh electricity system. It is the rst unit-commitment model of the electric system in Kazakhstan to be based on publicly available data including individual generation units of power plants and the transmission infrastructure in such detail.
Therefore, it provides a valuable addition to energy research on Kazakhstan, which so fare mostly relied on energy system models. The electricity sector model can be applied for spatial analysis of the electricity sector focusing on the operational level of power plants with constraints for CHP generation. The hourly nodal least-cost generation dispatch in Kazakhstan allows for insights in regional scarcity and related electricity prices and provides a better understanding for the interdependency of generation and transmission. The models results also indicate the value of the north-south integration in Kazakhstan. However, due to the strong regional concentration of generation capacity, the interconnection remains congested in many winter hours causing a high north-south dierential in nodal market prices. The analysis of the zonal pricing scenario (contrary to nodal pricing) indicates a possible alternative for a market-based restructuring of the power sector even though the implementation of losses remain challenging in that market scheme.
In general, the model provides a exible techno-economic tool that can be adapted for further research to analyze the transformation towards a sustainable energy system as well as the scenarios envisioned in Kazakhstan's 2050 strategy. This includes implications of higher uctuating shares of renewable generation on system operation, decisions on investment and spatial placing for new generation capacity especially for wind and solar power, opportunities for exible operation between the heat and electricity sectors, and expansion planning for the transmission network. The techno-economic character of the model also allows for its employment to research questions on changes in the market design, e.g., towards a more market-based
approach. Nodal price deviations in the model results suggest strong implications in case of a change towards a more market-based system. Zonal or nodal pricing schemes could set strong incentives for investment in the South of the country where both wind and PV resources are vastly available.
If Kazakhstan decides to embark on a pathway towards a more renewable-based system the issue of providing district heat for a large share of the population during the long and severe winter period will play a critical role. The current model formulation only provides a simplied representation of district heat but the model could be extended to include more details on the heat sector and its connection to electricity supply. While the current political situation has a tendency towards self-suciency of the Central Asian republics the Concept of a single Eurasian Power Market provides space for large synergies between the dierent riparian countries. Expanding the model to include more details on the energy systems of the Central Asian countries would provide an important tool to quantify resulting synergies.
With its aging generation eet, growing population and urbanization, and its vast renewable potential Kazakhstan is at the cross-roads of setting-up its energy future and this paper provide a rst step in developing useful transparent techno-economic tools to quantify implications of dierent pathways for the future power system.
Acknowledgements
This paper is part of a broader cooperation eort between DIW Berlin, DIW Econ, National Laboratory Astana and the Nazarbayev University on the energy system in Kazakhstan. Initial work was performed in the NAMAs Central Asia project and later continued in mutual visits and workshops. Jonas Egerer acknowledges the support from the Energie Campus Nurnberg. We would like to gratefully acknowledge Yerbol Akhmetbekov, Christian von Hirschhausen, Franziska Holz, and Petra Opitz for their valuable input in discussions and for providing institutional support to the team. Furthermore, we would like to thank three anonymous reviewers for their valuable critique and comments.
References
[1] A. Konkakov, G. Kubayeva, Progress in diversication of the economy in Kazakhstan. Working paper No. 2016/8, Tech.
rep., Astana, Kazakhstan (2016).
[2] KAZENERGY Association, The National Energy Report 2015, Tech. rep., Astana, Kazakhstan (2016).
[3] OECD/IEA, Clean Energy Technology Assessment Methodology Pilot Study. Kazakhstan, Tech. rep., Paris, France (2016).
[4] Kazakh government, Concept for transition of the Republic of Kazakhstan to Green Economy, Tech. rep., Astana, Kaza- khstan (2013).
[5] Kazakh government, Ïîñòàíîâëåíèå î äîïîëíèòåëüíûõ ìåðàõ ïî ïîâûøåíèþ ýôôåêòèâíîñòè îïòîâîãî ðûíêà ýëåêòðè÷åñêîé ýíåðãèè è ìîùíîñòè Ðåñïóáëèêè Êàçàõñòàí 606 (Decree on supplementary measures on increasing the eciency of the wholesale market for electric energy and power in the Republic of Kazakhstan), Tech. rep., Astana, Kazakhstan (2000).
[6] KOREM, Annual report 2015 of Kazakhstan electricity and power market operator, Tech. rep., Astana, Kazakhstan (2016).
[7] Kazakh government, Ïðèêàç îá óòâåðæäåíèè Ïðàâèë óòâåðæäåíèÿ òàðèôîâ (öåí, ñòàâîê ñáîðîâ) è òàðèôíûõ ñìåò íà ðåãóëèðóåìûå óñëóãè (òîâàðû, ðàáîòû) ñóáúåêòîâ åñòåñòâåííûõ ìîíîïîëèé 8642 (On approval of regulations on ratication of taris).
[8] KAZENERGY Association, Îáçîð ãîñóäàðñòâåííîé ïîëèòèêè Ðåñïóáëèêè Êàçàõñòàí â îáëàñòè ýíåðãîñáåðåæåíèÿ è ïîâûøåíèÿ ýíåðãîýôôåêòèâíîñòè (Review of the policy of Kazakhstan in the eld of energy saving and energy eciency).
[9] ENEGRYPROM.KZ,Daily news article "Power generation reaches 53.7bn kWh in January-July, up by 1.7% year on year.
Gas turbine power plants with a capacity of 100,000 kW worth KZT18.6bn were commissioned in the rst half of the year".
URLhttp://www.energyprom.kz/
[10] KOREM, Ïðåäåëüíûå òàðèôû íà ýëåêòðîýíåðãèþ 2016-2018 ãã (Marginal prices of power plants for 2016-2018 y.), Tech.
rep., Astana, Kazakhstan (2016).
[11] Y. Uatkhanov,Kazakhstan Ministry of Energy Introduces Renewable Energy Auctions.
URLhttp://astanatimes.com/2016/05/res/
[12] M. Assembayeva, R. Mendelevitch, J. Egerer, N. Zhakiyev, Data for a transparent spatial electricity market model for the power system of kazakhstan, Data in Brief 0 (submitted) 00.doi:0.
[13] S. Pfenninger, A. Hawkes, J. Keirstead,Energy systems modeling for twenty-rst century energy challenges, Renewable and Sustainable Energy Reviews 33 (2014) 7486. doi:10.1016/j.rser.2014.02.003.
URLhttp://linkinghub.elsevier.com/retrieve/pii/S1364032114000872
[14] P. Capros, L. Mantzos, D. Kolokotsas, N. Ioannou, T. Georgakopoulos, A. Filippopoulitis, The PRIMES Energy System Model. Reference manual, Tech. rep., National Technical University of Athens, Athens, Greece (1998).
[15] L. G. Fishbone, H. Abilock,Markal, a linear-programming model for energy systems analysis: Technical description of the bnl version, International Journal of Energy Research 5 (4) (1981) 353375.doi:10.1002/er.4440050406.
URLhttp://doi.wiley.com/10.1002/er.4440050406
[16] D. Finon, Scope and limitations of formalized optimization of a national energy systemthe EFOM model., Tech. rep., Brussel, Belgium (1981).
[17] P. Criqui, International markets and energy prices : the POLES model, Tech. rep., London, New York (1996).
[18] C. Heaps, An introduction to LEAP, Tech. rep. (2008).
[19] D. Connolly, H. Lund, B. Mathiesen, M. Leahy,A review of computer tools for analysing the integration of renewable energy into various energy systems, Applied Energy 87 (4) (2010) 10591082.doi:10.1016/j.apenergy.2009.09.026.
URLhttp://linkinghub.elsevier.com/retrieve/pii/S0306261909004188
[20] M. Ventosa, A. Baillo, A. Ramos, M. Rivier,Electricity market modeling trends, Energy Policy 33 (7) (2005) 897913.
doi:10.1016/j.enpol.2003.10.013.
URLhttp://linkinghub.elsevier.com/retrieve/pii/S0301421503003161
[21] A. Ehrenmann, Y. Smeers,Generation Capacity Expansion in a Risky Environment: A Stochastic Equilibrium Analysis, Operations Research 59 (6) (2011) 13321346. doi:10.1287/opre.1110.0992.
URLhttp://pubsonline.informs.org/doi/abs/10.1287/opre.1110.0992
[22] E. Allevi, F. Bonenti, G. Oggioni, Complementarity models for restructured electricity markets under environmental regulations, Tech. rep. (2013).
[23] G. Gurkan, R. Langestraat,Modeling and analysis of renewable energy obligations and technology bandings in the UK electricity market, Energy Policy 70 (2014) 8595. doi:10.1016/j.enpol.2014.03.022.
URLhttp://linkinghub.elsevier.com/retrieve/pii/S0301421514001694
[24] Y. Chen, L. Wang,Renewable Portfolio Standards in the Presence of Green Consumers and Emissions Trading, Networks and Spatial Economics 13 (2) (2013) 149181.doi:10.1007/s11067-012-9176-0.
URLhttp://link.springer.com/10.1007/s11067-012-9176-0
[25] D. Huppmann, J. Egerer,National-strategic investment in european power transmission capacity, European Journal of Operational Research 247 (1) 191203. doi:10.1016/j.ejor.2015.05.056.
URLhttp://linkinghub.elsevier.com/retrieve/pii/S0377221715004671
[26] A. Zerrahn, W.-P. Schill,Long-run power storage requirements for high shares of renewables: review and a new model, Renewable and Sustainable Energy Reviews 79 (2017) 15181534.doi:10.1016/j.rser.2016.11.098.
URLhttp://linkinghub.elsevier.com/retrieve/pii/S1364032116308619
[27] F. U. Leuthold, H. Weigt, C. von Hirschhausen,A Large-Scale Spatial Optimization Model of the European Electricity