arXiv:hep-ex/0104016v1 10 Apr 2001
EXPERIMENTAL STUDIES OF POWER CORRECTIONS
S. KLUTH
Max-Planck-Institut f¨ ur Physik, F¨ ohringer Ring 6, D-80805 M¨ unchen, Germany, skluth@mppmu.mpg.de
We present recent results from experimental studies of power corrections in the model of Dokshitzer, Marchesini and Webber using data from the process e
+e
−→ hadrons at several centre-of-mass energies. Fitted O (α
2s)+NLLA QCD predictions combined with power correc- tions to model hadronisation effects successfully describe differential distributions and mean values of event shape observables. The fit results for the strong coupling constant and the free parameter of the power correction calculations from the various observables are consis- tent with each other within the uncertainties. The same fits are further employed to study the gauge structure of QCD by additionally varying the QCD colour factors in the fits. The results are consistent with QCD based on the SU(3) symmetry group. A new measurement of the transverse cross section is shown using reanalysed data of the former JADE experiment at DESY and its implications for power correction are discussed.
1 Tests of Power Corrections
In the process of hadron production in e
+e
−annihilation confinement effects, also referred to as hadronisation, play an important rˆ ole. These effects stemming from the transition between the partons produced in the e
+e
−annihilation and the hadrons observed in the detector are not directly accessible by perturbative QCD calculations. Several QCD based hadronisation models implemented in Monte Carlo simulation programs exist and generally describe the data well
1,2,3. Recently new analytic models of hadronisation have been developed. In these the structure of non-perturbative contributions surpressed by powers of the hard scale (power corrections) is deduced from ambiguities in the perturbative result
4,5. In the model of Dokshitzer, March- esini and Webber (DMW) the effects of gluon radiation with transverse momenta O (Λ
MS), i.e.
O (100) MeV, are studied. The model assumes that the physical strong coupling remains finite
in the region around the Landau pole where simple perturbative evolution of the strong coupling
breaks down
a. This leads to the introduction of a free parameter α
0= 1/µ
IR
µI0
α
S(k)dk which must be determined from the data.
The main prediction of the DMW model is that distributions of the event shape observables 1 − T , M
Hor M
H2, B
T, B
Wand C are described by the perturbative QCD prediction R
PTshifted by an amount proportional to α
0/Q where Q = √
s is the hard scale of the process
6,7. The free parameter α
0is universal, since obervable specific details are calculated with a theoretical uncer- tainty of about 20%
7. For mean values one obtaines an additive correction to the perturbative prediction also proportional to α
0/Q. The perturbative QCD predictions are O (α
2s)+NLLA in the case of event shape distributions and O (α
2s) in the case of mean values.
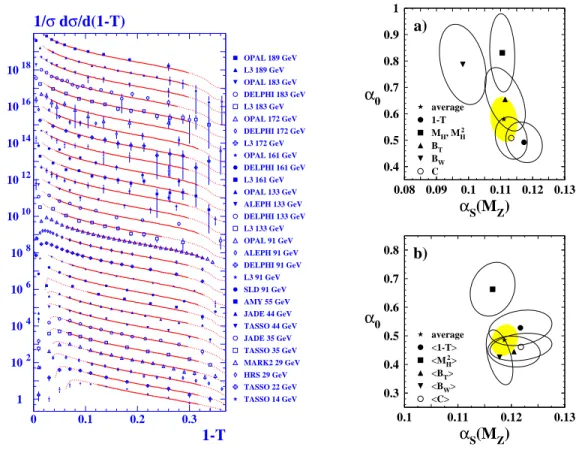
Figure 1 (left) presents the results of fits with power corrections as described above to distributions of 1 − T
8. The fit describes the data well at all cms energies ranging from 14 to 189 GeV. The figures 1 (right) present the results for α
S(M
Z0) and α
0(2 GeV) from fits to distributions and mean values. There is reasonable agreement between the individual results within the total uncertainties. However, the results for α
0(2 GeV) from M
Hor M
H2and from B
Wfor distributions are large compared to results from the other observables. This observation may be related to the non-inclusiveness of these observables, i.e. that only particles contained in one hemisphere of the event contribute
b.
1 102 104 106 108 1010 1012 1014 1016 1018
0 0.1 0.2 0.3
TASSO 14 GeV TASSO 22 GeV HRS 29 GeV MARK2 29 GeV TASSO 35 GeV JADE 35 GeV TASSO 44 GeV JADE 44 GeV AMY 55 GeV SLD 91 GeV L3 91 GeV DELPHI 91 GeV ALEPH 91 GeV OPAL 91 GeV L3 133 GeV DELPHI 133 GeV ALEPH 133 GeV OPAL 133 GeV L3 161 GeV DELPHI 161 GeV OPAL 161 GeV L3 172 GeV DELPHI 172 GeV OPAL 172 GeV L3 183 GeV DELPHI 183 GeV OPAL 183 GeV L3 189 GeV OPAL 189 GeV
1-T 1/ σ d σ /d(1-T)
0.4 0.5 0.6 0.7 0.8 0.9 1
0.08 0.09 0.1 0.11 0.12 0.13
average 1-T MH, MH2 BT BW C
α
S(M
Z) α
0a)
0.3 0.4 0.5 0.6 0.7 0.8
0.1 0.11 0.12 0.13
average
<1-T>
<MH
2>
<BT>
<BW>
<C>
α
S(M
Z) α
0b)
Figure 1: The figure on the left shows scaled distributions of 1 − T measured at √
s = 14 to 189 GeV
8. The solid lines represent the fit result while the dotted lines indicate an extrapolation of the fit. The figures on the right show results for α
S(M
Z0) and α
0(2 GeV) of fits to distributions (top) and mean values (bottom) as one standard
deviation error ellipses
8.
a
See the contribution by D.V. Shirkov to this conference.
b
See the contribution by S. Tafat to this conference.
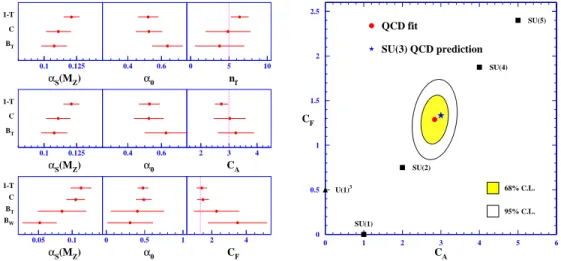
2 Colour Factors
The same fits as described in section 1 are generalised to study the gauge structure of QCD by varying the QCD colour factors C
A= 3, C
F= 4/3 or T
F= 1/2 (or equivalently the number of active quark flavours n
f= 5) with the SU(3) symmetry group
9. These fits avoid a potential bias of traditional analyses of the QCD gauge structure using angular correlations in 4-jet final states where hadronisation effects are corrected with Monte Carlo models based on standard QCD.
Figure 2 (left) shows the results of fits with α
S(M
Z0), α
0(2 GeV) and one of the colour factors as free parameters. Good agreement with the expectations from standard QCD is observed.
Alternative fits where α
0(2 GeV) is fixed at a value determined from previous measurements yield consistent results. Figure 2 (right) presents the combined results for C
Aand C
Ffrom simultaneous fits of α
S(M
Z0), C
Aand C
Fto 1 − T and C. The results of the simultaneous fits are also consistent with standard QCD while some other possibilities for the gauge symmetry group of QCD are excluded. Assuming SU(3) to be the correct gauge symmetry of QCD these results can be interpreted as a successful consistency check of the DMW model.
0.1 0.125 0.4 0.6 0 5 10
0.1 0.125 0.4 0.6 2 3 4
0.05 0.1 0 0.5 1 2 4
1-T C BT
αS(MZ) α0 nf
1-T C BT
αS(MZ) α0 CA
1-T C BT BW
αS(MZ) α0 CF
0 0.5 1 1.5 2 2.5
0 1 2 3 4 5 6
U(1)3
SU(1)
SU(2)
SU(4) SU(5)
QCD fit
SU(3) QCD prediction
CA CF
68% C.L.
95% C.L.
Figure 2: The figure on the left shows fit results for α
S(M
Z0), α
0(2 GeV) and one of the colour factors n
f, C
Aor C
F9. The vertical dotted lines indicate the expectation from standard QCD for the colour factor. The figure on the right presents combined results for C
Aand C
Ffrom fits of α
S(M
Z0), C
Aand C
F9. The square and triangle
symbols indicate expecations for C
Aand C
Ffor different symmetry groups.
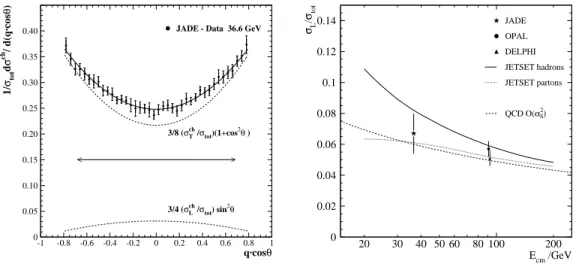
3 Transverse Cross Section
A new measurement of longitudinal cross section σ
Lat √
s = 36.6 has been performed
10using data of the former JADE experiment at the PETRA e
+e
−collider at DESY
11. The distribution of angles Θ between the incoming e
−and the outgoing charged hadrons shown in figure 3 (left) is sensitive to σ
L. The contribution ∼ σ
chT(1 + cos
2Θ) is from the elektroweak interaction with transverse polarisation while the contribution σ
Lch∼ sin
2Θ stems from gluon radiation of the primary quarks. The analysis finds σ
L= 0.067 ± 0.013 which is translated in O (α
2s) into a measurement of the strong coupling constant α
S(36.6 GeV) = 0.150 ± 0.025. Figure 3 (right) shows the measured σ
L(36.6 GeV) together with other measurements and compared to expectations from the JETSET Monte Carlo and from perturbative QCD. The predictions are in good agreement with the measurements within the errors.
The power correction to σ
Lis expected as δ
PC∼ µ
I/Q(α
0(µ
I) − α
S)
12. Fitting the full
expression for the power correction to the data in figure 3 (right) results in consistent values of
α
S(M
Z0) and α
0(2 GeV) with large errors. The presently available measurements do not allow quantitative studies of the power correction.
< >
q·cosθ 1/σtotdσch/ d(q·cosθ)
JADE - Data 36.6 GeV
3/8 (σTch /σtot)(1+cos2θ )
3/4 (σL ch /σtot) sin2θ
0 0.05 0.10 0.15 0.20 0.25 0.30 0.35 0.40
-1 -0.8 -0.6 -0.4 -0.2 0 0.2 0.4 0.6 0.8 1 0
0.02 0.04 0.06 0.08 0.1 0.12 0.14
Ecm /GeV σL/σtot
20 30 40 50 60 80 100 200
JADE OPAL DELPHI JETSET hadrons JETSET partons
QCD O(α2S)