29th International Cosmic Ray Conference Pune (2005)00, 101–106
A systematic study of the interdependence of IACT image parameters
B.Riegel
a, T.Bretz
a, D.Dorner
a, K.Berger
a, D.H¨ohne
afor the MAGIC Collaboration
b(a) Institut f¨ur Theoretische Physik und Astrophysik, Universit¨at W¨urzburg, Am Hubland, 97074 W¨urzburg, Germany (b) Updated collaborator list at:http://magic.mppmu.mpg.de/collaboration/members/index.html
Presenter: B.Riegel (riegel@astro.uni-wuerzburg.de), ger-riegel-B-abs1-og27-poster
One of the most important challenges for the current generation of Cherenkov telescopes is to lower the energy threshold below 100 GeV. When analyzing data it is of particular importance to understand the interdependen- cies ofIACTimage parameters among each other. We examined in detail these relationships in several tests both on Crab data and on Monte Carlo samples. In conclusion we produced multidimensional cuts, which are robust enough to be used in an automatic standard analysis.
Introduction Using image parameters to obtain information on the energy, type and direction of a primary cosmic particle has been the key to success in ground-based gamma ray astronomy. The properties of the primaries are encoded into the properties of the images in the following way:
Energy: The total intensity of the image is directly proportional to the energy of the primary particle inducing the air shower.
Particle Type: Whereas gamma-ray initiated showers look homogenous, hadron initiated showers, composed of many subshowers, look more patchy and frayed. Use of the morphology of the shower images, in combination with their intensity, should thus allow for discriminating showers of different particle origin.
Origin: Depending on the primary particle origin and the inclination of the shower w.r.t. the telescope axis the proportions of the shower image will change. This differences can be used to reconstruct the origin and inclination.
The information content in the shower images is clearly restricted. In particular, the non-Poissonian shower fluctuations broaden the distributions of the shower parameters widely. Moreover, some types of shower images are generically indistinguishable, e.g. single neutral pion or electron initiated showers are purely electromag- netic. Using redundant information from the shower images may result in spurious correlations. Therefore, the following study investigates the correlations between the image parameters aiming to find the minimal number of free parameters necessary for an optimal gamma-/background-separation. Results may be compared with those obtained with previous methods, such asSupercuts[2].
Classical image parameters to describe the properties of a shower image [3] are the second (LENGTH, WIDTH) and third moments of the intensity distribution, the distance of the center-of-gravity from the location of the observed source in the camera and the total measured light intensity SIZE(exact definitions used in this study can be found in [1]).
Classical Width and Length cuts In a first step the interdependence of Width and Length – normally used for reduction of the hadronic background – and Size is investigated. In the classical approach the Size depen- dent gamma-/background-separation cuts in Width and Length are assumed to be independent and combined by logic operators. The distribution of Width and Length for a fixed Size bin is shown in figure 1. While it is not possible to separate both distributions using constant Length- and Width-cuts for a fixed Size (as for
2 B.Riegel, T.Bretz et al.
]
° Length [ 0 0.05 0.1 0.15 0.2 0.25 0.3 0.35 0.4 0.45 0.5
]°Width [
0 0.05 0.1 0.15 0.2 0.25 0.3 0.35 0.4 0.45 0.5
Distribution of Length and Width
Figure 1.Width-Length distribution for Monte Carlo gam- mas (white) and measured off-data (black) in a fixed size bin (250<size/phe<500). The solid lines are equipotential lines in Width·Length.
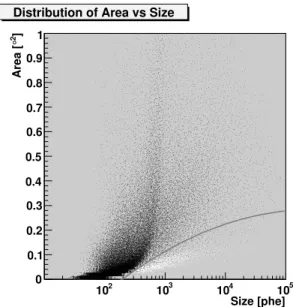
Size [phe]
102 103 104 105
]2°Area [
0 0.1 0.2 0.3 0.4 0.5 0.6 0.7 0.8 0.9 1
Distribution of Area vs Size
Figure 2.Distribution of the new parameter Area for Monte Carlo gammas (white) and measured off-data (black) versus Size. The best cut is drawn as gray line.
example done by Supercuts) a cut at a constantA=π·Length·W idth(Area) separates both distributions well. The cut efficiency can be slightly improved by applying this cut. The main advantage is the reduction of the number of free parameters by a factor of two. The best cut value – as in former Supercuts – depends on the total light intensity of the shower (Size). Consequently former dynamical Width- and Length-cuts can be substituted by a second order polynomial (of Size) cut in Area as shown in figure 2.
Classical Dist and Alpha cuts In classical image analysis methods cuts in Dist and Alpha have been used to separate showers coming from the investigated source and from other sky positions in the field-of-view.
Investigating the properties of the shower projection in the focal plane of the telescope it turns out, that Length−W idth is a good observable to measure the inclination of the shower w.r.t. the telescope axis.
While a shower developing along the telescope axis will be projected as circle, a shower far away will have an elongated projection. BecauseLength−W idthwill change its absolute value with the energy of the shower, it must be scaled properly with the distance of the shower from the telescope axis. For a mono setup the best measurement of this variable is Length, the angle under which the elongation of the shower is seen. As shown by theWhipplecollaboration the direction of shower’s primary particle can be reconstructed usingDispp[5]:
p=ξ·(1−W idth/Length)
Whilepis the distance of the origin of the individual shower along the major axis from the center-of-gravity.
Furthermore the distance between the reconstructed source of the shower to the observed source position can be calculated as:
ϑ2:=d2+p2−2·d·p·cos(α)
with Distdandαbeing the angle between the line connecting the center-of-gravity with the observed source position and the major axis of the shower.
It turns out, that the best cut inϑ2 is in the first approximation Size independent. A future improvement
A systematic study of the interdependence ofIACTimage parameters 3
Size [phe]
102 103 104
]°Dist [
0 0.2 0.4 0.6 0.8 1 1.2 1.4 1.6
Distribution of Dist vs Size
Size [phe]
102 103 104
]°Dist [
0 0.2 0.4 0.6 0.8 1 1.2 1.4 1.6
Distribution of Dist vs Size
Figure 3. Distribution of the classical Dist parameter for Monte Carlo gammas (left) compared with the distribution for off-data (right) before (black) and after a constantϑ2-cut (white)
Size [phe]
102 103 104
]°| [α|
0 10 20 30 40 50 60 70 80 90
vs Size α Distribution of
Size [phe]
102 103 104
]°| [α|
0 10 20 30 40 50 60 70 80 90
vs Size α Distribution of
Figure 4. Distribution of the classicalαparameter for Monte Carlo gammas (left) compared with the distribution for off-data (right) before (black) and after a constantϑ2-cut (white)
will include a correction ofξ for high-energy events partly leaking out of the camera. Comparing the image parameter distributions of Monte Carlo gammas [4] for Dist andαwith observational off-data, surviving a constantϑ2-cut, points out that no further size dependent Dist andα-cut is necessary, because the ϑ2-cut performs similar. This cut reproduces the two dimensional shape of the gamma-distribution of Dist andα versus Size more accurately than a dynamical Size-dependant cut in Dist andαcould do. A comparison is shown in figure 3 and forαin 4.
4 B.Riegel, T.Bretz et al.
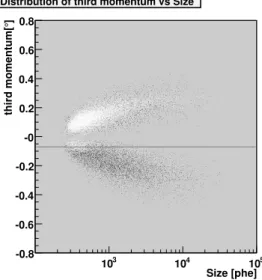
Size [phe]
103 104 105
]°third momentum[
-0.8 -0.6 -0.4 -0.2 -0 0.2 0.4 0.6 0.8
Distribution of third momentum vs Size
Figure 5.Distribution of the third moment along the major axis for Monte Carlo gammas (white) and measured off-data (black) versus Size. The best cut is drawn as gray line.
Disp ambiguity The disadvantage of theDisp-Method is that the proportions of the shower, from which the Disp parameter is calculated, do not carry information about the direction along the major axis in which the source direction of the shower is located. Due to the shape of the electromagnetic cascade of the shower an asymmetry along the major axis is expected. This asymmetry can be expressed by the third momentMlof the intensity distribution along the major axis and can be used to resolve this ambiguity. Because of showers developing near the telescope axis, there is still a small fraction of events left with|Ml| < M0which do not have an unambiguous third moment. Therefore a cut as shown in figure 5 is suggested. This plot shows a comparison between the third moment distribution of Monte Carlo gammas and observational data. Trying to perform higher order cuts in third-moment versus Size does not lead to much improvement instead increases the number of free parameters.
Conclusion A robust set of gamma-/background-separationcuts have been found. This cuts can now be used as a reference for future improvements and data comparisons. Using these cuts in standard analysis [1] has shown that these new cuts are competitive but more reliable than more refined cuts based on a larger numbers of image parameters.
Acknowledgments We acknowledge the support of the German BMBF (05 CMOMG1/3).
References
[1] T.Bretz, Standard Analysis for the MAGIC telescope. These Proceedings.
[2] Punch M. 1991, in Proc. 22nd ICRC (Dublin), Vol.1, p.464 [3] Hillas A. 1985. in Proc. 19th ICRC (La Jolla), Vol.3, p.445 [4] P. Majumdar et al., These Proceedings.
[5] Lessard, R.W., et al., Astopart. Phys., 15, 1-18, 2001