29th International Cosmic Ray Conference Pune (2005)00, 101–106
Study of the MAGIC sensitivity for off-axis observations
J. Rico
a, N. Sidro
a, J. Cortina
aand E. O˜na-Wilhelmi
afor the MAGIC Collaboration
∗aInstitut de Fisica d’Altes Energies (IFAE). Universitat Autonoma de Barcelona. 08193 Bellaterra (Barcelona) Spain.
∗Updated list of collaborators http://wwwmagic.mppmu.mpg.de/collaboration/members/
Presenter: J. Rico (jrico@ifae.es), spa-rico-J-abs1-og27-poster
We present a study of the sensitivity of the MAGIC telescope for off-axis observations. The results presented have been obtained by the comparison of on- and off-axis Crab Nebula observations, for several positions of the source in the field of view (FOV). The source position is reconstructed for every image using the DISP method. The results are compared with Monte Carlo (MC) simulations. This study allows us to assess the capabilities of MAGIC to perform sky-scans.
1. Introduction
The interest of building a catalogue of Very High Energy (VHE)γ-ray sources have led the different Imaging Air Cherenkov Telescope (IACT) experiments to carry out systematic observations of large portions of the sky (compared to their FOV), mainly along the galactic plane [1, 2]. The recent discovery of 8 new sources using this technique by HESS [2] raises the interest of galactic sky-scans. In this paper we show that MAGIC has the capability to contribute to the growing VHEγ-ray source catalogue by exploring the part of the galactic plane observable from the Northern Hemisphere.
The critical parameters when performing a sky-scan are the angular resolution and sensitivity of off-axis ob- servations. MAGIC achieves a relatively good angular resolution using the DISP method to reconstruct the direction of arrival on a shower-by-shower basis (σ ∼0.10◦at 100 GeV) [3]. In this work we show the sen- sitivity for off-axis observations evaluated using both MC and real data from Crab Nebula observations. From these studies we derive the sensitivity of MAGIC in view of a future sky scan.
2. Data analysis
For the present study we have analyzed data from a set of Crab Nebula observations at low zenith angle (<30◦) at 0, 0.3 and 0.4 degrees off-axis angles, respectively. The observations were performed during September 2004 and January 2005. In order to fully characterize the sensitivity up to 1 degree off-axis angle, we have also analyzed a sample of MC simulatedγ-ray events at 0, 0.25, 0.5 0.75 and 1 degrees, and compared the results with those obtained with Crab Nebula observations.
Data are processed using a standard Hillas analysis (for a review, see for example Ref. [4]). The so-called Hillas parameters describe the the shape (WIDTH, LENGTH, SIZE, CONCENTRATION...) and position (DIST, ALPHA...) of the shower image within the camera. The latter parameters are meaningful only when the position of the source within the camera FOV is known. In the present work we do not assume the knowledge of such a position (which is the case e.g. during a sky-scan), and therefore we parameterize the shower images using exclusively the set of variables describing the image shape.
Gamma/hadron separation is performed by means of a Random Forest classification algorithm [5]. A Random Forest is a combination oftreepredictors such that each tree depends on the values of a random vector sampled independently among the Hillas parameters, and with the same distribution for all trees in the forest. Each tree yields a classification of the shower into a class (γ-ray or hadron candidate). A new variable called
2 J. Rico et al.
X [deg]
-1 -0.5 0 0.5 1
Y [deg]
-1 -0.5 0 0.5 1
excesses/bin
-0.1 0 0.1 0.2 0.3
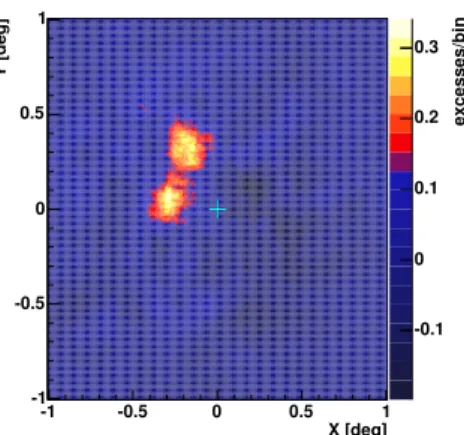
Figure 1.Map of excesses of the combined observation of Crab Nebula above 100 GeV at two different positions within the MAGIC camera.
HADRONNESS is computed as the ratio of trees classifying a given image as hadron-like. HADRONNESS is used as the final gamma/hadron discriminator in our analysis.
The direction of arrival of the individual showers is estimated using the DISP method [3]. This method is based on the fact that, forγ-ray events, the center of gravity of the image and the direction of arrival of the shower within the camera are aligned in the direction of the image maximum elongation. The angular distance between them can be properly parameterized depending only on the image shape (SIZE and WIDTH/LENGTH). Such a parameterization is determined using a sample of MC simulatedγ-ray events and/or a data sample from a well known point-likeγ-ray source (e.g. the Crab Nebula). Using DISP, an angular resolution1of0.10◦(0.08◦) forE >100(E >300) GeV is achieved, which allows us to use MAGIC in sky-scans and extended source observations.
For off-axis observations, the background recorded in a given camera position at an angular distancerfrom the camera center can be computed from thensymmetric positions in the camera, provided thatrsin(π/(n+1))>
2σ, whereσ is the angular resolution2. For an hexagonal camera as that of MAGICn=1, 2 or 5. The error on the background estimation is proportional ton−1/2, so for each camera position the maximum number of symmetric positions is used. For the region (r <2σ) the background is estimated from the observations of an empty field in the sky, where only background events are expected.
Figure 1 shows the map of the number of excess events above the estimated background for the combined ob- servations of Crab Nebula at two different positions within the MAGIC camera. The angular distance between the positions of the two sources is 0.35 degrees. The sources are clearly resolved.
3. Results
We have computed the sensitivity of MAGIC above 100 GeV for off-axis observations as a function of the off-axis angle (r), using both MCγ-ray and real observation data samples.
1We define the angular resolution as theσof a 2-dimensional Gaussian fit to the distribution of reconstructed arrival directions for a point-like source.
2Regions suspected to contain signal must be removed during background estimation. The 2-σlevel ensures that 85% of the signal from a point-like source is removed so that the remaining 15% does not affect background estimation.
MAGIC off-axis observations 3
Off axis angle [deg]
0 0.2 0.4 0.6 0.8 1
Off axis angle [deg]
0 0.2 0.4 0.6 0.8 1
Value with respect to centered source
0 0.2 0.4 0.6 0.8 1 1.2 1.4 1.6
Gamma efficiency (from MC) Background efficiency (from Data)
+ Data background) γ
Sensitivity (MC
Sensitivity (from Crab Nebula observations)
Figure 2.Degradation of the sensitivity above 100 GeV together with signal and background efficiencies as a function of the off-axis angle computed both from MC and Crab-Nebula off-axis observations.
MC simulatedγ-rays are used to compute the gamma detection efficiency. For this, about5×105 gamma- initiated atmospheric showers with a fixed incoming direction were simulated using CORSIKA [6]. The re- sponse of MAGIC was simulated using the standard MAGIC reflector and camera MC simulation programs [7], for the different considered observation angles (0, 0.25, 0.5, 0.75 and 1 degrees). Theγ-ray detection efficiency above 100 GeV was compared to that obtained for on-axis observations. The results are shown in figure 2.
Background efficiency was computed using data from observations of an empty FOV at low zenith angle. For the different considered angular distances, the number of background events were compared with that obtained at the camera center. The obtained values were combined with those of the gamma efficiencies to compute the sensitivity degradation:s0/s= Nγ/N
0
√ γ
Nh/Nh0, whereNγis the number of gamma events for a given off-axis angle, Nγ0the number of gamma events at angler= 0, and similarly for the number of hadrons (Nh). The values of the hadron efficiency and sensitivity degradation are shown in figure 2.
In order to check the results obtained with the MC simulation, we have analyzed a set of Crab Nebula obser- vations at 0, 0.3 and 0.4 degrees off-axis angle. We have applied to these data the same analysis as for the MC samples and compared both results (see figure 2). There is a good agreement between the results obtained for MC and data samples.
The integral flux sensitivity3of MAGIC above 100 GeV for point-like sources observed on-axis is2×10−11 cm2s−1[8]. From this value and those shown in figure 2 we can compute the sensitivity of MAGIC during sky-scans4. Figure 3 shows the map of sensitivities of MAGIC during a sky-scan along a given direction (e.g.
galactic longitude) for two different values of the angular distance between adjacent observation positions (d).
In real experimental conditions, the minimum detectable flux depends on the sensitivity and also on the time spent at each observation position. Thus, for a total observation timeT, covering a total angular distanceD, the minimum detectable integral flux above 100 GeV (absolute sensitivity of the scan) is given byFmin=q
50D T d S, whereS is the sensitivity averaged along the camera. S is proportional ton−1/2, wherenis the number of
3The flux sensitivity is defined here as the minimum integral flux observable with a statistical significance of 5 standard deviations in 50 hours of observation time.
4We are considering here a sky-scan in one direction, e.g. the galactic plane. We point the telescope at zero galactic latitude at a given galactic longitude, observe for a given time, and then move the telescope only in galactic longitude.
4 J. Rico et al.
Relative Galactic Longitude [deg]
-1 -0.5 0 0.5 1
Galactic Latitude [deg]
-1 -0.5 0 0.5
1 -2-1] sIntegral flux [cm
0 0.05 0.1 0.15 0.2 0.25 0.3 0.35
10-10
×
Relative Galactic Longitude [deg]
-1 -0.5 0 0.5 1
Galactic Latitude [deg]
-1 -0.5 0 0.5
1 -2-1] sIntegral flux [cm
0 0.1 0.2 0.3 0.4 0.5 10-10
×
Galactic latitude [deg]
-1 -0.5 0 0.5 1
Galactic latitude [deg]
-1 -0.5 0 0.5 1
]-1 s-2Integral flux [cm
0 0.1 0.2 0.3 0.4 0.5 0.6 0.7×10⁻¹⁰
0.1 degree step 0.5 degree step
Figure 3.Map of sensitivities for point-like sources above 100 GeV achieved by MAGIC for sky-scans with a distance of 0.1◦(left) and 0.8◦(center) between adjacent observation positions. Right plot: Average sensitivity as a function of the angular distance to the scan direction for the previously considered conditions.
times a given position in the sky is observed during the scan:n= 2R/dwithRthe radius of the sensitive area of the camera. Therefore, the absolute average sensitivity of the scan does not depend ond, although smaller values are preferred given the greater homogeneity of the sensitivity achieved (see figure 3). For instance, for a scan of a region ofD= 30◦along the galactic longitude in a total timeT = 300hours the absolute sensitivity averaged in the region [-0.5◦,0.5◦] isFmin= 6.3×10⁻¹¹cm2s−1(about 10% of the Crab-Nebula flux at that energy). The average in the region [-1◦,1◦] grows up to9.3×10−11cm2s−1.
4. Conclusions
The sensitivity of MAGIC for off-axis observations have been assessed by the study of a MC simulatedγ-ray sample and a set of Crab Nebula on- and off-axis observations. The results agree within the statistical errors.
We have also computed the MAGIC absolute sensitivity in an eventual sky-scan, obtaining detectable fluxes down to 10% the Crab-Nebula flux above 100 GeV for a 300 hours scan of a30◦length area.
References
[1] F. A. Aharonianet al., A&A 395, 803 (2002).
[2] F. Aharonianet al.Science 307, 1938 (2005).
[3] E. Domingo-Santamariaet al., “Disp analysis method for point-like off-axis and/or extended sources for the MAGIC Telescope”, these Proceedings.
[4] D. J. Fegan, J. Phys. G23, 1013 (1997).
[5] L. Breiman, Machine Learning 45, 5 (2001).
http://stat-www.berkeley.edu/users/breiman/RandomForests/cc home.htm.
[6] D. Sobczynska, internal note MAGIC-TDAS 02-10.
http:7/www-ik.fzk.de/heck/corsika/.
[7] A. Moralejo, internal note MAGIC-TDAS 02-11.
O. Blanch and A. Moralejo, internal note MAGIC-TDAS 04-07.
[8] A. Moralejo, internal note MAGIC-TDAS 04-04.