Research Report
Student mobility in the EHEA
Underrepresentation in student credit mobility and imbalances in degree mobility
Angelika Grabher
Petra Wejwar
Martin Unger
Berta Terzieva
Projektbericht Research Report
Student mobility in the EHEA
Underrepresentation in student credit mobility and imbalances in degree mobility
Angelika Grabher Petra Wejwar Martin Unger Berta Terzieva
With the collaboration of Julia Litofcenko
Study commissioned by the Austrian Ministry of Science (BMWF)
January 2014
Institut für Höhere Studien (IHS), Wien
Institute for Advanced Studies, Vienna
Contact:
Angelika Grabher
: +43/1/599 91-269 email: grabher@ihs.ac.at http://www.ihs.ac.at http://www.equi.at
Content
Executive Summary ... 7
Credit Mobility: which groups are underrepresented and why? ... 7
Degree Mobility: Imbalanced Student mobility in Europe ... 8
Introduction ... 9
1. Credit Mobility: Which groups are underrepresented and why? ... 11
1.1 Underrepresented groups regarding enrolment abroad among students in Europe ...12
1.1.1 Enrolment abroad and students’ age ...16
1.2 Perceived obstacles to enrolment abroad ...19
1.3 Underrepresented groups and perceived obstacles to enrolment abroad – more detailed insights from Austria ...23
1.3.1 Underrepresented groups regarding enrolment abroad among Austrian students ...23
1.3.2 Destination and costs of the stay ...27
1.3.3 Perceived obstacles to enrolment abroad ...28
1.4 Summary ...30
2. Degree Mobility: Imbalanced Student mobility in the EHEA ... 31
2.1 Mobility flows ...33
2.1.1 Worldwide mobility flows ...33
2.1.2 European Higher Education Area ...34
2.2 Imbalanced mobility flows in the EHEA ...38
2.2.1 Imbalanced mobility flows from a national point of view ...39
2.2.2 Imbalanced mobility flows from a regional point of view ...45
2.3 Summary ...48
Annex ... 51
Additional tables on data availability and GDP per capita ...51
Additional tables on obstacles to student credit mobility ...53
Graphs on incoming and outgoing mobility flows for all EHEA countries ...53
Executive Summary
The present report was commissioned by the Austrian Federal Ministry of Science and Re- search as an input for the BFUG Working group “Mobility and Internationalisation” regarding differences and inequalities in student mobility in the EHEA. The authors chose two different perspectives on student mobility, focussing on underrepresented groups in temporary credit mobility in chapter 1 and on imbalances in long-term degree mobility flows between coun- tries in chapter 2.
Credit Mobility: which groups are underrepresented and why?
The identification of underrepresented groups and the analysis of reasons for underrepre- sentation is based on data from the EUROSTUDENT database1 of 25 countries. 17 of those countries delivered additional data for the present analysis. The survey data covers 5A stu- dents who have a permanent residency and finished prior education in the country of survey.
Across Europe, there are primarily three groups underrepresented in temporary en- rolment: students from low education background, students with delayed transition into higher education and older students.
These three groups are often intersectional: Older students have often started a working career after graduating from secondary school and found their way into higher education more than two years after graduation from secondary school. As students from lower educa- tion background are more likely to choose a non-traditional education track or to enter higher education at a higher age and with a delay between secondary school and tertiary education.
Financial issues are the most obstructing ones for students across Europe, for older students it is more their living conditions (family/ partner/ children) that are hindering a temporary enrolment abroad.
Especially Students from Southern and Eastern European countries, in comparison with Northern European countries, rate financial and also structural obstacles higher than other obstacles. In Northern European countries students stated personal reasons more often than other obstacles, in relation to other countries. Therefore financial and structural barriers are smaller in Northern European countries. This is also reflected by the generally high affinity towards enrolment abroad in Northern countries.
In-depth analysis of Austrian data yielded advanced results explaining the un- derrepresentation of certain groups of students.
Apart from older students and those with delayed transition or lower social background also students with impairments prove to be underrepresented to enrolment abroad. Also students from different fields of study are very different regarding their affinity towards enrolment
1 https://eurostudent.his.de/eiv/report/index.jsp?x=30&y=24
abroad. Detailed data about destination, duration and cost of the stay corroborate the trend that financial issues are crucial for students with lower social background: they choose shorter stays (internships) and stay in Europe more often than students from high social background. Differences by social background take more effect for younger students, who are more dependent from family and state support. The effect of social background is weak- er among older students. For them, obstacles regarding their living conditions are more criti- cal than financial issues.
Degree Mobility: Imbalanced Student mobility in Europe
The secondary statistical analysis, based on data from the UNESCO – Institute for Statistics on (long-term) degree mobility of students in tertiary education (ISCED 97 level 5 & 6) out- lines the presence and distribution of mobile students in the EHEA. It analyses imbalanced mobility flows across EHEA countries from a national, bilateral and a regional perspective.
The identification of imbalanced mobility flows is based on two approaches: absolute and relative imbalances
Absolute imbalances occur if the net difference of mobile students exchanged by two coun- tries exceeds 1.000 students. In contrast, relative imbalances take the sizes of the national student populations into account and are represented by the share of incoming mobile stu- dents of a certain country among all students in the host country being >1%. Even though the two concepts approach imbalanced mobility differently, both show imbalances especially between neighbouring countries, in case the absolute number of students in one country is significantly smaller than in the other.
Mobility flows from Eastern and Southern EHEA to Western end Northern EHEA but also between countries of North-Western EHEA are imbalanced.
Generally speaking, imbalanced mobility flows between larger regions in the EHEA mostly occur from Eastern, Southern and Non-European EHEA countries to Western and Northern Europe. Imbalances often occur between countries in Western and Northern Europe. Similar imbalances can be observed within Eastern Europe, but due to missing data the list of de- tected imbalances in this region might not be exhaustive.
English-speaking countries show highly imbalanced incoming mobility flows.
EHEA countries with English as their official language receive a highly imbalanced number of mobile students from Non-English speaking countries. This is especially the case for the UK.
Imbalanced mobility flows can also be detected looking at national GDPs per capita.
In absolute numbers, considerably more mobile students from countries with lower GDPs per capita are studying in countries with higher GDPs than vice versa. Referring to the size of the destination country, only mobility flows from countries with GDPs per capita between 30.000 and 39.000 US$ to countries with GDPs per capita over 39.000 US$ can be consid- ered imbalanced. In terms of relative imbalance, students from countries with lower GDPs are not overrepresented in High-GDP-countries.
Introduction
This report has been commissioned by the Austrian Federal Ministry of Science and Re- search. It aims at provide the discussions of the BFUG Working group “Mobility and Interna- tionalisation” with input regarding the explanation of differences and inequalities in student mobility within and between countries of the EHEA. This matter will be approached from two perspectives.
The first part focuses on credit mobility, which is defined as a temporary enrolment abroad with the aim of pursuing one’s studies but finishing them in the home country. These anal- yses are based on national student survey data, whose results have been reported to a cen- tral database. Those surveys were conducted within the EUROSTUDENT V (E:IV) project, which also provides the data in a publicly accessible database.2 These data do not allow any conclusions about the actual mobility quotas, as the surveys only addressed students. Actual mobility quotas could only be determined through a graduate survey. However, a student survey approach brings other advantages into play: students not only give information about their experiences abroad, but also about their future plans of going – or not going abroad to pass part of their studies in another country. Most importantly, those who have not spent a study period abroad can report the obstacles that might deter them from doing so. Therefore, underrepresented groups can be detected, though not as sufficiently as with a graduate sur- vey. In exchange for this waiving of completeness the reasons for certain groups of students being underrepresented to student mobility can be described and taken as a basis for policy measures to overcome these inequalities.
The second part of this report focuses on degree mobility, which is defined as long term mobility of students with the purpose of completing a whole study cycle and the acquisition of a degree (Bachelor-, Master- or PhD) abroad. Using 2010 data on student mobility from the data centre of the UNESCO Institute for Statistics this chapter describes the presence and distribution of mobile students worldwide and in the EHEA. The balance and imbalance of mobility flows across EHEA countries from a bilateral and regional perspective are as well analysed.
Thanks are due to national researchers who participated in E:IV and contributed to this pro- ject through providing additional analyses not included in the E:IV database. Those were Sarah Gerhard (CH), Nikolai Netz (DE), Jesper Risom (DK), Hanna-Stella Haaristo (EE), Ramon Llopis-Goig (ES), Vesa Virtanen and Hannele Keckman-Koivuniemi (FI), Simon LeCorgne and Carol Waldvogel (FR), Giovanni Finocchietti and Maria Pannone (IT), Tomislav Vodička and Mirna Cvitan (HR), Christine Scholz (MT), Bas Kurver (NL), Dag F.
Gravem (NO), Maria Antelo Frazão (PT), Per Gillström (SE), Stojan Sorcan (SI) and Maria Fusekova (SK). Additionally, we thank Nikolai Netz and Dominic Orr for their experienced comments.
2 https://eurostudent.his.de/eiv/report/index.jsp?x=42&y=17
1. Credit Mobility: Which groups are underrepresented and why?
Student mobility is one of the key topics in European higher education policy. Thus, there is a great interest in data on student mobility. Simultaneously, awareness of unequal chances of participation has risen, which is why also the interest for subjective and structural obsta- cles to mobility is increasing (see European commission 2011, BFUG 2012).3
The EUROSTUDENT project4 regularly collects obstacles to (credit) mobility within interna- tionally comparative student surveys in several European countries. General results from EUROSTUDENT IV (E:IV) can be found in the last report from 2012,5 or in the intelligence brief about “short-term mobility and mobility obstacles”.6 Netz et al. (2012), respectively Netz (2013)7 further exploited the EUROSTUDENT IVdatabase8 in the frame of the Steeple- chase-project – an in-depth analysis of five exemplary countries. Among other things, they found out, that the odds of planning and eventually realising an enrolment phase abroad, are multifaceted. Therefore, a set of target group specific measures might be needed to support students in becoming temporarily mobile. In a related paper Orr (2013)9 analysed inequali- ties in short-term student mobility on the basis of E:IV data and concluded that “mobility is not for all”. The present paper takes the analysis a step further by using the existing E:IV database and additional deliveries of national E:IV data which were, apart from Austria itself, delivered by 16 countries participating in the E:IV network.
Thus, the following analysis is not only based on the E:IV database, consisting of 25 national student surveys conducted between 2009 and 2010, but also on additional data that allow a more condensed view on underrepresented groups in student mobility. The target group for the E:IV survey was ISCED 5A10 students, covering Bachelor, Master and other national degrees of this level, who have a permanent residency in the respective country. Students who temporarily were enrolled abroad at the time of the survey (incoming and outgoing) and those who did not complete their prior education in the country of the survey, were excluded.
3 European Commission (2011): Supporting growth and Jobs – an agenda for the modernisation of Europe’s higher education systems. Brussels.
http://eur-lex.europa.eu/LexUriServ/LexUriServ.do?uri=COM:2011:0567:FIN:EN:PDF BFUG (2012): Final report by the Working Group Mobilty.
http://www.ehea.info/Uploads/%281%29/Mobility%20WG%20Report.pdf
4 www.eurostudent.eu.
5 http://www.eurostudent.eu/download_files/documents/EIV_Synopsis_of_Indicators.pdf
6 http://www.eurostudent.eu/download_files/IB_Short_term_mobility_091211.pdf
7 Netz, Orr, Gwosc, Huß (2012): What deters students from studying abroad? DZHW, Hannover.
Further elaborated in Netz, N. (2013): What deters students from studying abroad? Evidence from four European countries and its implications for higher education policy, in: Journal of higher educa- tion policy, online publication 17.12.2013, http://dx.doi.org/10.1057/hep.2013.37.
8 https://eurostudent.his.de/eiv/report/index.jsp?x=30&y=24
9 Orr (2012): Mobility is not for all - An international comparison of students’ mobility aspirations and perceptions of barriers to temporary enrolment abroad. In: Wächter, B. et al.: Tying it all together.
Excellence, mobility, funding and the social dimension in higher education; Bonn: Lemmens.
10 Referring to ISCED 97.
The questions on credit mobility refer to students’ former enrolment abroad and their future plans of enrolling abroad during their study career.
The following chapters will give an overview on credit mobility and students’ assessment of obstacles to enrolment abroad, focussing on underrepresented groups and reasons for ine- qualities in access to student mobility. In addition to the international comparison, a chapter on student mobility in Austria will add up an in-depth view to the analyses of obstructing fac- tors to enrolment abroad.
The figures displayed below cannot be regarded as mobility quotas11 but as shares of stu- dents that have already passed part of their studies abroad when the survey was conducted.
In the following the share of students that have been temporarily enrolled abroad but pursue their studies at home will therefore be referred to as Percentage of Enrolled Students –
“PES”.
1.1 Underrepresented groups regarding enrolment abroad among students in Europe
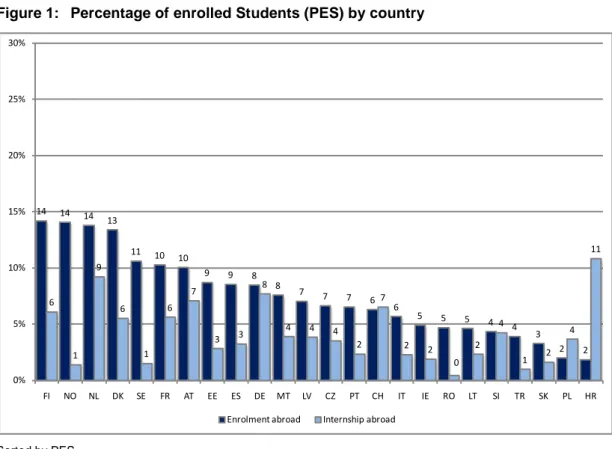
Among the countries of the E:IV network, the percentage of students that have already been enrolled abroad lies between 2% and 14%. Northern European countries have a relatively high percentage of enrolled students (PES), which is highest in Finland, Norway and The Netherlands (14%). On the contrary, the majority of Eastern European countries have a rela- tively low PES, with Romania at the upper end (5%) and Croatia on the lower (2%).
11 Full quotas could only be shown on the basis of graduates.
Figure 1: Percentage of enrolled Students (PES) by country
Sorted by PES.
Source: E:IV database.
However, Croatia is a good example for countries, where internships or work placements abroad are (almost) as important for students as spending a study period abroad. Having the highest share of students that did an internship abroad during their studies (11%), Croatia catches up with those countries that have the highest PES in the E:IV network. Besides Cro- atia, it is mainly the German (and Dutch) speaking countries that show similar shares of stu- dents that passed an internship or work placement abroad.
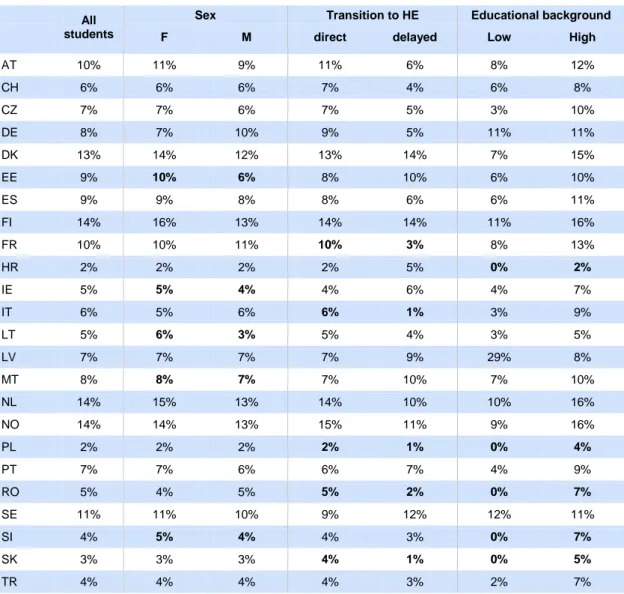
As far as gender differences are concerned, women show a higher affinity towards enrol- ment abroad than men in almost all countries (except for DE, FR and IT). For example in Estonia, 10% of all female students have already been mobile when the survey was con- ducted, but only 6% of all male students (Table 1). In Latvia those differences are similar, as the PES among women is almost 1.5 times higher than among men. In that sense, in most countries men are underrepresented among mobile students.
14 14 14 13
11 10 10
9 9 8
8 7 7 7 6 6
5 5 5 4 4 3
2 2
6
1 9
6
1 6
7
3 3
8
4 4 4
2 7
2 2
0 2
4
1 2
4 11
0%
5%
10%
15%
20%
25%
30%
FI NO NL DK SE FR AT EE ES DE MT LV CZ PT CH IT IE RO LT SI TR SK PL HR
Enrolment abroad Internship abroad
Table 1: Percentage of enrolled students (PES) by groups of students All
students
Sex Transition to HE Educational background
F M direct delayed Low High
AT 10% 11% 9% 11% 6% 8% 12%
CH 6% 6% 6% 7% 4% 6% 8%
CZ 7% 7% 6% 7% 5% 3% 10%
DE 8% 7% 10% 9% 5% 11% 11%
DK 13% 14% 12% 13% 14% 7% 15%
EE 9% 10% 6% 8% 10% 6% 10%
ES 9% 9% 8% 8% 6% 6% 11%
FI 14% 16% 13% 14% 14% 11% 16%
FR 10% 10% 11% 10% 3% 8% 13%
HR 2% 2% 2% 2% 5% 0% 2%
IE 5% 5% 4% 4% 6% 4% 7%
IT 6% 5% 6% 6% 1% 3% 9%
LT 5% 6% 3% 5% 4% 3% 5%
LV 7% 7% 7% 7% 9% 29% 8%
MT 8% 8% 7% 7% 10% 7% 10%
NL 14% 15% 13% 14% 10% 10% 16%
NO 14% 14% 13% 15% 11% 9% 16%
PL 2% 2% 2% 2% 1% 0% 4%
PT 7% 7% 6% 6% 7% 4% 9%
RO 5% 4% 5% 5% 2% 0% 7%
SE 11% 11% 10% 9% 12% 12% 11%
SI 4% 5% 4% 4% 3% 0% 7%
SK 3% 3% 3% 4% 1% 0% 5%
TR 4% 4% 4% 4% 3% 2% 7%
Bold figures for the top 5 countries with the biggest group differences according to the PES.
Source: E:IV database.
In most countries, so-called non-traditional student groups are less likely to temporarily enrol abroad during their study career. These are students who study part-time (low study intensi- ty), students from a lower social background12 or students with delayed transition into higher education (Orr 2012).13 Students who enrolled in higher education directly after completing secondary education have a higher PES, whereas students with delayed transition into high- er education have a lower affinity towards enrolment abroad. In most countries there also occur strong differences depending on the education background of students. Students from lower educational background often have a lower likelihood of spending a study period abroad. These differences range from almost zero in Germany to a sevenfold higher PES of
12 The present analysis refers to the education background, i.e. highest educational attainment of student’s parents as a proxy for social background.
13 Those who entered higher education more than two years after graduating from secondary school or with a non-traditional entrance qualification will in the following be called delayed transition stu- dents.
students with high education background in Romania and Slovenia. In many countries, these two characteristics correlate highly as the non-traditional track into tertiary education is more often followed by students from lower educated families (Table 1).
Inclusion of students with lower education background
In Germany and Sweden students with lower (ISCED 0-2) and higher education back- ground (ISCED 5 or higher) are more or less equally mobile. In Sweden, the former even have a slightly higher percentage of enrolled students (PES) than the latter. It is important to note that this does in no way represent the social distribution of the stu- dent body itself. In Germany, only 2% of students have parents with an educational at- tainment of ISCED 0-2, while 69% have parents who hold a tertiary education degree (ISCED 5).14 In Sweden it is 5% vs. 39%.
However, looking at the obstacles to mobility cannot sufficiently explain the inclusion mechanisms. Students with lower education background in both countries asses the loss of opportunities to earn money as well as the additional financial burden signifi- cantly more often as a (big) obstacle to mobility, than students with higher education background. These two obstacles, together with the separation from family and part- ner, are generally often reported by students with lower education background.
On the contrary, in Denmark, where the difference in the PES between students from low or high educational background is relatively high, those typical obstacles were re- ported equally or even less often by students with lower education background. One possible explanation lies in the different attendance to enrolment abroad that varies by field of study and students’ choices of their studies depending on their educational background.
This finding probably only holds true for relatively wealthy, Western European states.
Due to limited data availability and quality it is not yet possible analyse this phenome- non in Eastern European countries in more detail.
14 In the German national report, a share of 51% of students with parents having a higher education degree is reported (see Isserstedt et al. (2010): Die wirtschaftliche und soziale Lage der Studieren- den in der Bundesrepublik Deutschland 2009. 19. Sozialerhebung des Deutschen Studentenwerks durchgeführt durch HIS Hochschul-Informations-System. Bonn). Those figures do not include ISCED 5B certificates, which are indeed included in this report.
Inclusion of students with delayed transition into higher education
In France, the PES of direct transition students is almost three times higher than the one of delayed transition students. Only Italy has a higher difference (Factor: 3). De- layed transition students generally state their living standard that comes with their higher age more often as a reason not to take a study period abroad than direct transi- tion students. Hence, the loss of opportunity to earn money is one of the main reasons not to temporarily enrol abroad. As this sphere can hardly be met by higher education measures, it is difficult to implement respective instruments.
Source: additional E:IV data.
Tables on obstacles by country are available at www.equi.at/student-mobility.
Looking at the PES in different fields of study, we see a similar pattern in all countries of the E:IV network. In most countries students of humanities and arts as well as social sciences, business and law have the highest affinity towards enrolment abroad, while students of (nat- ural) sciences or engineering, manufacturing and construction are less likely to belong to the group of mobile students.
1.1.1 Enrolment abroad and students’ age
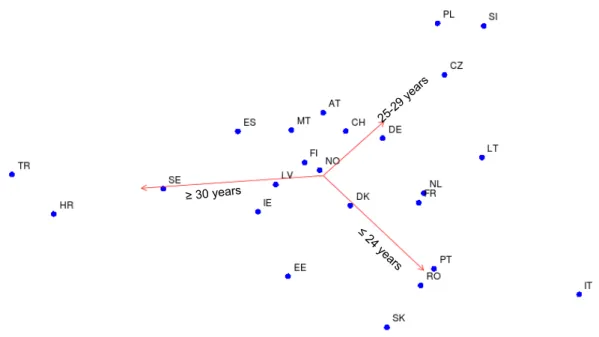
Apart from the PES per country it is interesting to look at general trends that result from dif- ferent tendencies, when to enrol abroad, per country. Especially students’ age determines the affinity towards enrolment abroad very differently among the countries of the E:IV net- work. Figure 2 shows the relative differences between the countries of the E:IV network ac- cording to their students’ affinity towards enrolment abroad, dependent on their age. The more distant a country lies from the centre, the stronger the relative differences to other countries are in favour of the respective age group. Countries that lie between the 3 dimen- sions of age groups (represented by the arrows) have no explicit tendency towards one age group but still follow the given trends. For example, in countries within the triangle shaped by the dimensions of 25-29 years and 30 years or older, students tend to have a higher affinity towards enrolment abroad than the youngest ones, but not as definite as e.g. in Poland or Turkey respectively. Thereby, students from countries like Austria and Switzerland tend to have the highest PES among 25-29 year olds, while in Spain also the oldest age group has a high affinity towards enrolment abroad.
Figure 2: Mapping of countries according to the relative difference in PES by age
Graphical representation of relative distances between age groups and countries according to PES, based on a correspondence analysis.15
Source: E:IV database.
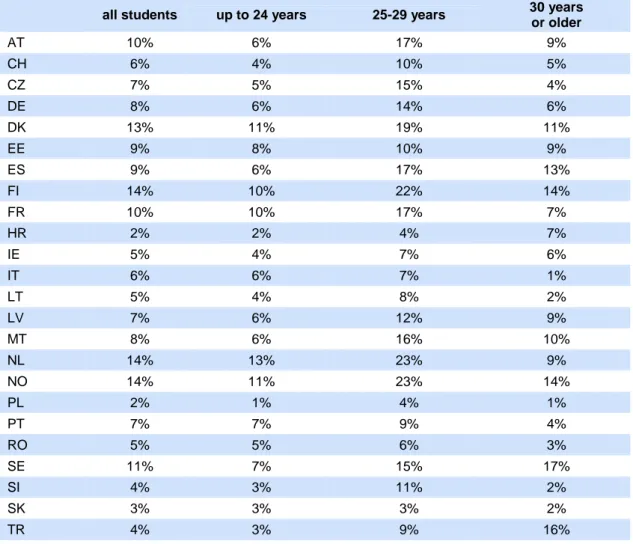
The likelihood of having passed an enrolment period during one’s studies abroad rises with the progress of studies (see Chapter 1.3), which also produces a positive age effect, though older students tend to be less mobile than younger ones. Thus, the PES is highest among students between 25 and 29 years (Table 2). Especially in Poland, Slovenia and the Czech Republic this group has by far the highest affinity to temporarily enrol abroad. Romania, Slo- vakia, Italy and Portugal are examples for countries where the youngest age group already has a quite high PES. Table 2 clearly shows that there are only a few countries where stu- dents are likely to enrol abroad after their 30th birthday. Students at the age of 30 or older generally tend to have a low affinity towards mobility, as their living conditions often hinder or even don’t allow them to leave for one or more semesters (work, family/ children, liabilities, etc.). Nevertheless, there are some countries where older students do have a relatively high PES compared to younger students, these are Turkey, Croatia16 and Sweden (Figure 2 and Table 2).
15 For further information see Greenacre, M. (2007). Correspondence Analysis in Practice. London:
Chapman & Hall.
16 Note: For Croatia there is a relatively small number of students being 30 years or older in the sam- ple (n=52). Therefore, the high enrolment quota among those might be a statistical outlier.
Table 2: Percentage of enrolled students (PES) by student’s age
all students up to 24 years 25-29 years 30 years or older
AT 10% 6% 17% 9%
CH 6% 4% 10% 5%
CZ 7% 5% 15% 4%
DE 8% 6% 14% 6%
DK 13% 11% 19% 11%
EE 9% 8% 10% 9%
ES 9% 6% 17% 13%
FI 14% 10% 22% 14%
FR 10% 10% 17% 7%
HR 2% 2% 4% 7%
IE 5% 4% 7% 6%
IT 6% 6% 7% 1%
LT 5% 4% 8% 2%
LV 7% 6% 12% 9%
MT 8% 6% 16% 10%
NL 14% 13% 23% 9%
NO 14% 11% 23% 14%
PL 2% 1% 4% 1%
PT 7% 7% 9% 4%
RO 5% 5% 6% 3%
SE 11% 7% 15% 17%
SI 4% 3% 11% 2%
SK 3% 3% 3% 2%
TR 4% 3% 9% 16%
Source: E:IV database.
These findings observed by age also result in a much higher PES among Master students than among Bachelor students. The reason is, as stated before, that the longer the study period has been up to time of the survey, the higher the likelihood of having already been enrolled abroad becomes. On E:IV average, the enrolment rate among MA students is about three times higher than among BA students. In cross-country comparison though, age is not necessarily a determinant of these trends. In Turkey for example, 88% of students are younger than 25 years. Nevertheless, students at the age of 30 or older have the highest affinity towards enrolment abroad, although this age group is underrepresented in terms of student mobility in many other E:IV countries.
Inclusion of older students – the Swedish case
In Sweden, the highest PES can be observed among 30 or more year old students.
The PES is indeed higher among MA students. BA students are though not as far be- hind MA students as in other countries. Sweden is also the country with the highest PES among delayed transition students, which can partly explain the high quota in the
oldest group of students. Another reason might be that many obstacles to enrolment abroad that were reported by students at that age in other countries do not apply for Swedish students. For example in Sweden, far less students than in other E:IV coun- tries assess the information issue as an obstacle to enrolment abroad. Also, especially among older students, giving up an employment/ source of income is, compared to other countries, rarely rated as an obstacle.
In contrast, in France and the Netherlands the PES of students aged 30 years or older is below the national average. Especially giving up the employment is characteristical- ly hindering older students from studying abroad. Dutch students at that age also as- sess the separation from family, partner and friends as an obstacle for temporarily en- rolling abroad. That also indicates a strong impact of the living situation on the deci- sion whether to pass a study period abroad or not.
Source: additional E:IV data.
Tables on obstacles by country are available at www.equi.at/student-mobility.
1.2 Perceived obstacles to enrolment abroad
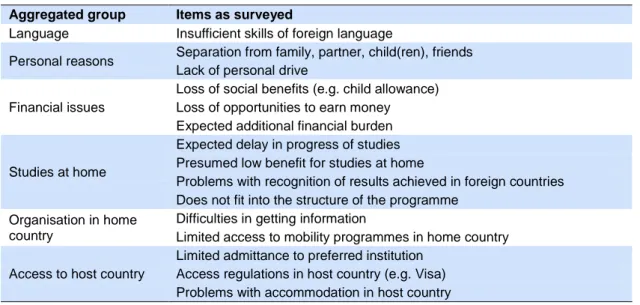
This analysis can only refer to obstacles to enrolment abroad assessed by students that have not been enrolled abroad (yet), no matter whether they have plans to enrol abroad or not. Netz et al. (2012) published results on this matter separately for those who plan to enrol abroad but haven’t been enrolled yet and those who refuse to enrol abroad. Orr (2012) fo- cussed mainly on students who do not plan to enrol abroad, but also examined the effect of certain obstacles on mobility plans of students. Both found that the obstacles differ between those who plan to go abroad and those who don’t. However, the expected additional financial burden was the most critical obstacle for both groups. In the present analysis, we can only refer to the obstacles of both groups together as a proxy to show which factors hinder stu- dents the most from passing a study period abroad. However, a pattern of different types of obstacles to enrolment abroad will be identified, showing different tendencies between the countries. The original items on obstacles were grouped as presented in Table 3, in order to aggregate the information from the original items. To group the items, the shares of students who rated the respective items as (big) obstacles were added up according to the dimension they aim to represent.17
17 Since there are only shares of students but no micro data per country, it was not possible to calcu- late a more elaborated index.
Table 3: Obstacles to enrolment abroad included in E:IV Aggregated group Items as surveyed
Language Insufficient skills of foreign language
Personal reasons Separation from family, partner, child(ren), friends Lack of personal drive
Financial issues
Loss of social benefits (e.g. child allowance) Loss of opportunities to earn money Expected additional financial burden
Studies at home
Expected delay in progress of studies Presumed low benefit for studies at home
Problems with recognition of results achieved in foreign countries Does not fit into the structure of the programme
Organisation in home country
Difficulties in getting information
Limited access to mobility programmes in home country Access to host country
Limited admittance to preferred institution Access regulations in host country (e.g. Visa) Problems with accommodation in host country Source: E:IV database.
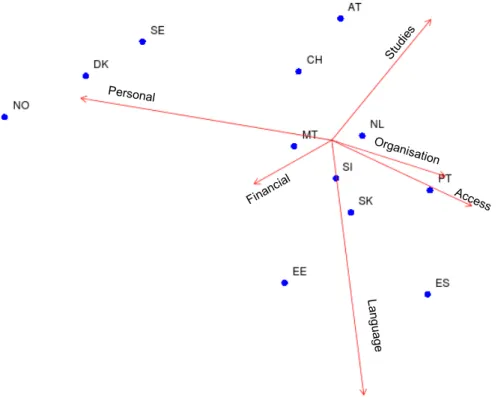
Figure 3 identifies six dimensions of obstructions to enrolment abroad. Four groups of obsta- cles lie on separate dimensions, which are financial issues, personal reasons, problems regarding studies at home and insufficient language skills. The remaining two groups of ob- stacles – problems resulting from access barriers to the host country and organisational is- sues – point in the same direction and can therefore be seen as highly correlated. Again the relative difference of the countries towards each other locates them along those four dimen- sions, where their distance from the centre shows the extent of the relative difference to oth- er countries, or in other words, the strength of the trend in comparison to other countries.
Figure 3: Mapping of countries according to the relative difference in assessment of obstacles to enrolment abroad
Graphical representation of relative distances between countries according to students’ assessment of obstacles to enrolment abroad, based on a correspondence analysis. 18
Only countries, that included all E:IV items in their survey.
Source: E:IV database.
Denmark, Sweden and Norway as representatives of the Scandinavian countries, show highest values on the personal dimension, though Norwegian students tending to rate finan- cial issues higher than other Nordic countries. Looking at Table 4, we can nevertheless see that in these countries financial or organisational issues are stated by a far smaller share of students than in other countries, mostly in Eastern and Southern Europe. Compared to other countries in the E:IV network, the conclusion thereof would be that in Northern Europe struc- tural barriers to enrolment abroad are smaller. This goes along with a high enrolment rate in those countries (Figure 1). In relation to other countries, Croatian, Austrian and Swiss stu- dents report obstacles related to their studies more often than other obstacles. Those coun- tries have a comparably high share of students that passed an internship abroad (which was not subject to the questions on obstacles).
Another trend observed is that structural or organisational problems as well as too little lan- guage skills or financial obstructions are reported more often in Eastern and Southern Euro- pean countries. In Spain and Portugal, but also Slovenia, limited access to mobility pro- grammes is stated as an obstacle by about 1/3 of non-mobile students, which is the highest
18 For further information see Greenacre, M. (2007). Correspondence Analysis in Practice. London:
Chapman & Hall.
share among E:IV countries (Table 4). Spanish and Slovakian students remarkably frequent- ly report insufficient language skills as hindering for their enrolment plans. In Estonia and Slovenia about ¾ of non-mobile students assess the additional financial burden of an enrol- ment period abroad to be an obstacle to mobility. The conclusion that can thus be drawn is that students in those regions are likely to face structural barriers to mobility that lie within the education system, as well as financial obstructions. This interpretation is also supported by a relatively low enrolment quota especially in Eastern European countries (Figure 1).
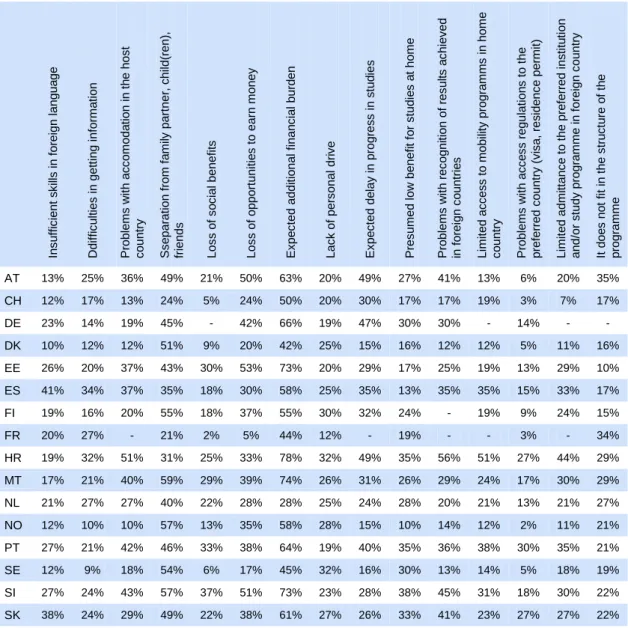
Table 4: Perceived obstacles to enrolment abroad
Insufficient skills in foreign language Ddifficulties in getting information Problems with accomodation in the host country Sseparation from family partner, child(ren), friends Loss of social benefits Loss of opportunities to earn money Expected additional financial burden Lack of personal drive Expected delay in progress in studies Presumed low benefit for studies at home Problems with recognition of results achieved in foreign countries Limited access to mobility programms in home country Problems with access regulations to the preferred country (visa, residence permit) Limited admittance to the preferred institution and/or study programme in foreign country It does not fit in the structure of the programme AT 13% 25% 36% 49% 21% 50% 63% 20% 49% 27% 41% 13% 6% 20% 35%
CH 12% 17% 13% 24% 5% 24% 50% 20% 30% 17% 17% 19% 3% 7% 17%
DE 23% 14% 19% 45% - 42% 66% 19% 47% 30% 30% - 14% - -
DK 10% 12% 12% 51% 9% 20% 42% 25% 15% 16% 12% 12% 5% 11% 16%
EE 26% 20% 37% 43% 30% 53% 73% 20% 29% 17% 25% 19% 13% 29% 10%
ES 41% 34% 37% 35% 18% 30% 58% 25% 35% 13% 35% 35% 15% 33% 17%
FI 19% 16% 20% 55% 18% 37% 55% 30% 32% 24% - 19% 9% 24% 15%
FR 20% 27% - 21% 2% 5% 44% 12% - 19% - - 3% - 34%
HR 19% 32% 51% 31% 25% 33% 78% 32% 49% 35% 56% 51% 27% 44% 29%
MT 17% 21% 40% 59% 29% 39% 74% 26% 31% 26% 29% 24% 17% 30% 29%
NL 21% 27% 27% 40% 22% 28% 28% 25% 24% 28% 20% 21% 13% 21% 27%
NO 12% 10% 10% 57% 13% 35% 58% 28% 15% 10% 14% 12% 2% 11% 21%
PT 27% 21% 42% 46% 33% 38% 64% 19% 40% 35% 36% 38% 30% 35% 21%
SE 12% 9% 18% 54% 6% 17% 45% 32% 16% 30% 13% 14% 5% 18% 19%
SI 27% 24% 43% 57% 37% 51% 73% 23% 28% 38% 45% 31% 18% 30% 22%
SK 38% 24% 29% 49% 22% 38% 61% 27% 26% 33% 41% 23% 27% 27% 22%
Only students that have not (yet) been enrolled abroad (i.e. students who plan to and students who refuse to).
“-“ indicates missing data where the respective Item was not included in the survey. IT only asked for aggregated items and is therefore not included in the table.
Further tables on obstacles by country are available at www.equi.at/student-mobility.
Source: E:IV database.
1.3 Underrepresented groups and perceived obstacles to enrolment abroad – more detailed insights from Austria
The previous chapter gave an overview of underrepresented groups to students’ credit mo- bility and the reasons not to temporarily enrol abroad throughout the E:IV network. The fol- lowing chapter aims at analysing students’ mobility from the Austrian perspective. Having a broader set of variables than those collected within the E:IV survey, the Austrian national student survey allows an in-depth analysis of student mobility and the obstacles and struc- tural barriers that hinder students from passing an enrolment period abroad. Thus, the awareness of obstructions to enrolment can be fostered, revealing further groups that are underrepresented in student mobility which have not been analysed in other countries due to a lack of data. Nevertheless, these groups of students also exist in other countries and hence the analysis of the Austrian data can possibly provide more general tendencies re- garding the mobility behaviour of potentially underrepresented groups.
Again, the figures reported in this chapter cannot be regarded as mobility quotas,19 present- ing shares of students that have already passed part of their studies abroad when the survey was conducted. The figures will therefore again be referred to as Percentage of Enrolled Students – “PES”.
1.3.1 Underrepresented groups regarding enrolment abroad among Austrian stu- dents
In Austria, mainly older students who are working a lot besides their studies and are likely to have family and children, as well as students from lower social background20 reported not to plan a temporary enrolment abroad.21 These factors prove to be intersectional: students from lower social background are on average older than the majority of students, as they often chose a vocational track at first and continue with employment before entering higher educa- tion at a later stage in life. The share of students that have already been enrolled abroad increases with growing age of students, as the likelihood of having been enrolled abroad during the studies increases with age. It can also be shown that, from age 29 years onwards, the PES decreases again (Figure 4). This goes along with the European trend that the affini- ty towards enrolment abroad is highest among students between 25-29 years and in many countries clearly lower in the oldest age group. Figure 4 also shows a linear trend in social background: the better the social standing of students’ parents, the higher the affinity to- wards enrolment abroad.
19 Full quotas could only be shown on the basis of graduates.
20 For the Austrian data social background is operationalised through an index combining the highest educational and occupational attainment of student’s parents. See Unger et al. 2012: Studierenden- Sozialerhebung 2011. Bericht zur sozialen Lage der Studierenden. Band 2: Studierende. Wien.
21 Austria extended its grant system for student mobility during the last years – especially for students from lower social background. These new or increased grants have not yet been covered by the here presented study.
In comparison, the differences among students of different social backgrounds are smaller for internships abroad. On average, Austrian students spend less time on internships abroad than on an enrolment period. Therefore, it is, on the one hand, easier to leave commitments and liabilities behind for a shorter period of time and on the other hand, it is a lower financial burden.
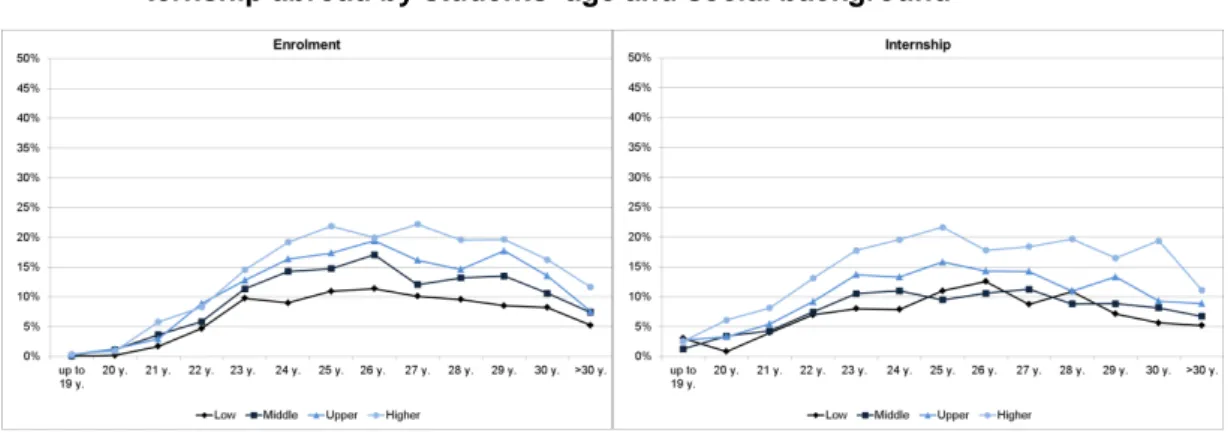
Figure 4: Austria: percentage of students having spent an enrolment period or in- ternship abroad by students’ age and social background
Source: Austrian national student survey 2011.
Additionally, there is a linear correlation between social background and the affinity towards enrolment abroad: The lower the social background of a student, the lower the affinity to- wards enrolment abroad, which remains constant over students’ age. Towards the end of studies, the differences grow even bigger, as especially students from a higher education background tend to spend their study period abroad later in their study career. Therefore, the differences between social backgrounds tend to be underestimated when looking at the PES in a student population. From this perspective, also the differences in internships abroad according to social background of the students grow bigger along with the progress of stud- ies.
Figure 5: Austria: percentage of students having spent an enrolment period or in- ternship abroad by study progress and social background
Source: Austrian national student survey 2011.
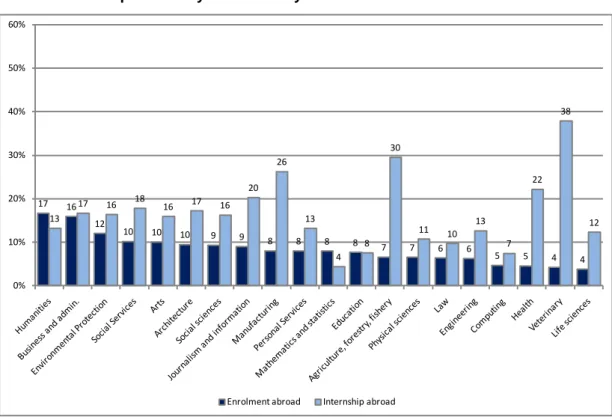
As Figure 6 shows, the PES differs notably according to the field of study. While students of humanities or business and administration have the highest affinity towards temporary en- rolment abroad and an almost as high affinity towards internships abroad, students of veteri- nary or life sciences have the lowest PES. However, students of veterinary on the other hand show a high affinity to internships abroad. The affinity towards credit mobility among students of life sciences is generally far below average.
Figure 6: Austria: percentage of students having spent an enrolment period or in- ternship abroad by field of study
Sorted by PES.
Field of study according to ISCED classification.
Source: Austrian national student survey 2011.
These differences might have various reasons. As already stated, students’ age and social background are crucial in terms of affinity towards credit mobility. Since the choice of field of study is especially dependent of social background, it also affects the distribution of mobile students among the different fields of study. Another possible reason is the local labour mar- ket and importance of an enrolment period abroad in terms of career possibilities. Also the (supposed) national focus of the field – e.g. legal studies being highly bound to national law vs. interpreting/ translation which strongly supposes an enrolment period abroad – influences students’ affinity towards credit mobility.
Table 5 shows potentially underrepresented groups in student mobility. Just as in most other countries in the E:IV network, delayed transition students have a PES below average, though they pass internships abroad almost on average. But there are several groups one would expect to be underrepresented regarding student mobility, but which are not in the
17 16
12 10 10 10 9 9 8 8 8 8 7 7 6 6 5 5 4 4
13
17 16 18
16 17 16
20 26
13
4 8
30
11 10 13
7 22
38
12
0%
10%
20%
30%
40%
50%
60%
Enrolment abroad Internship abroad
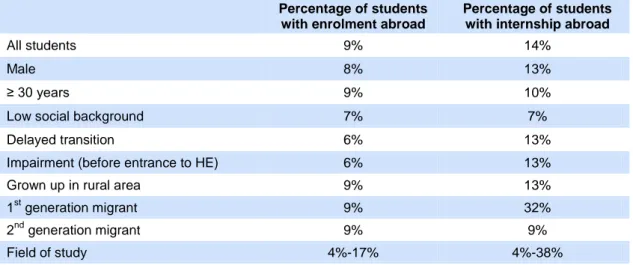
Austrian case. Different to many E:IV countries, students at the age of 30 years or older have an average percentage of students who have spent an enrolment period abroad, but are underrepresented among those who passed an internship abroad. Also students grown up in a rural area or having migration background, who can be considered as more or less non-traditional student group, have an average PES. This outlines the fact that groups that are generally underrepresented in the student body are not necessarily underrepresented regarding student mobility and vice versa. For the Austrian case we therefore can identify students from lower social background or delayed transition into higher education as un- derrepresented groups regarding enrolment abroad, in accordance with the abovementioned European trends. In addition, also students with an impairment (hindering them in their stud- ies) are less likely to temporarily enrol abroad. Regarding internships though, this group al- most reaches an average share. In contrast, 1st generation migrant students have an aver- age PES but an outstandingly high share of students that have passed an internship abroad.
One explanation for that is that those students very often pass an internship in their country of birth, where they are likely to have social contacts. Hence, barriers like accommodation and costs in the host country as well as leaving family and friends in the country of study are less hindering as they are familiar with the host country, moreover they can more easily find a place for their internship through local connections.22 These trends though cannot be ob- served for enrolment abroad.
Table 5: PES in different groups of students
Percentage of students with enrolment abroad
Percentage of students with internship abroad
All students 9% 14%
Male 8% 13%
≥ 30 years 9% 10%
Low social background 7% 7%
Delayed transition 6% 13%
Impairment (before entrance to HE) 6% 13%
Grown up in rural area 9% 13%
1st generation migrant 9% 32%
2nd generation migrant 9% 9%
Field of study 4%-17% 4%-38%
Source: Austrian national student survey 2011.
22 This finding points to the fact that capturing student credit mobility exhaustively is always tricky.
Even though, current studies and databases tend to define mobile students through their location of prior education instead of their nationality, there are still some minor groups that can have a heavy weight in certain regions (e.g. students crossing a boarder to study but keep living in the home country, or, as in this case, students who at the first glance seem to be mobile but actually only “vis- it” home.
1.3.2 Destination and costs of the stay
The top countries for Austrian students to temporarily enrol abroad are Spain, France, Ger- many, the UK and Italy. For internships abroad, Germany is the favourite destination of Aus- trian students. About one third of those who passed an internship abroad chose Germany.
English speaking countries are generally often chosen for a study related period abroad.
The choice of destination proves to differ between students from higher social background and those from lower social background. When planned destinations and actual destinations of students are juxtaposed, it can be concluded that students from lower social background cannot realise their preferred destination as often as students from higher social background can. The main issue therefore is a question of cost. While students from higher social back- ground spend their stay abroad more often in countries outside Europe, students from lower social background enrol often in European countries, although the planned destinations do not differ so much between students from lower or higher social background. Especially re- garding internships abroad, which usually last shorter than temporary enrolments abroad, students from lower social background relatively seldom plan to pass them in Germany but more often in the UK or USA. Nevertheless, they actually pass them more often in Germany than students from higher social background.
As already stated above, the most obstructing factor of enrolment abroad for students from lower social background is the cost issue. The average monthly amount at disposal during an enrolment period abroad is about 950€ (excluding travel costs), while family support ac- counts for 38% of the monthly disposal. Again, we see differences according to the social background of students. The average monthly disposal is about 50€ less for students from lower social background than from higher social background, while family support accounts for 20% of the monthly disposal for students from lower social background, respectively for 49% for students from higher social background. This lack of family support can be buffered by national grants and student support. However, probably due to lower travel costs students from lower social background often choose a European or EHEA country, although there is a similar affinity regarding enrolment plans towards a non-European or non-EHEA destination as among students from higher social background.
Figure 7 Austria: Sources of funding during temporary enrolment abroad by social background of students
Other: Employment during enrolment period, loans/ depts, other.
EU grant: ERASMUS grant incl. co-financing.
Source: Austrian national student survey 2011.
Students passing an internship abroad fund a significant share of their study abroad with income gained from that internship. However, women are at disadvantage concerning the income earned during internships abroad. First, female students pass unsalaried internships more often than male, which partly relates to the different fields of study. Additionally, their average earnings are about 230€ less than those of men, which also relates to the field of study chosen but also to the country the internship was passed in.
1.3.3 Perceived obstacles to enrolment abroad
As we could see, financial issues are crucial for a decision pro or contra a temporary enrol- ment abroad or at least for the design of this stay (country, duration etc.). Especially for younger students from a lower social background it is quite often financial issues that hinder them from temporarily enrolling abroad as their families cannot support them financially as much as families with a higher social standing can. This can also be shown through students’
self-assessment of obstacles to enrolment abroad.
The differences in social background decrease among older students as they hardly receive any social or family support anymore. Among older students it is not so much their social background but their living conditions (employment, family/ children) that hinder them from enrolling abroad.
Family Own savings EU grant Other grants/ support Other
190 € 301 € 376 € 494 €
266 €
234 € 214 €
198 € 167 € 162 € 163 €
173 € 260 €65 € 183 €81 € 132 €57 € 81 €53 €
0 € 200 € 400 € 600 € 800 € 1.000 € 1.200 €
Low Middle Upper High
20% 31% 40% 49%
28%
24%
23%
18% 17% 17% 20%17%
27%7% 19%8% 14%6% 8%5%
0%
20%
40%
60%
80%
100%
Low Middle Upper High
Table 6: Austria: Obstacles to mobility by students’ age
All students Up to 24y. 25-29y. 30y. or over
Information and access 24% 33% 27% 14%
Affect on studies at home 50% 64% 53% 32%
Living conditions 72% 62% 70% 83%
Financial burden 48% 53% 53% 40%
Loss of social benefits 8% 12% 7% 4%
Conditions in host country 16% 20% 16% 12%
Duration 8% 12% 6% 5%
Figures for students who do not plan to enrol abroad.
Source: Austrian national student survey 2011.
A lack of student support lowers the likelihood of an enrolment abroad even more. Hence, among those that do not plan to enrol abroad, students with lower social background more often feel obstructed from studying abroad by financial issues than students from a higher social background. Among students up to the age of 24 years, even 2 out of 3 students from lower social background state that financial burden is a reason for not enrolling abroad while among younger students from higher social background it is only 1 out of 3.
Table 7: Austria: Obstacles to mobility by students’ social background
All students Lower Middle Upper Higher
Information and access 34% 23% 24% 25% 23%
Affect on studies at home 64% 46% 51% 52% 54%
Living conditions 58% 78% 75% 73% 71%
Financial burden 53% 50% 50% 47% 40%
Loss of social benefits 12% 9% 8% 7% 7%
Conditions in host country 23% 17% 17% 15% 14%
Duration 14% 7% 8% 8% 8%
Figures for students who do not plan to enrol abroad.
Source: Austrian national student survey 2011.
The aforementioned results show that for Austrian students mainly two characteristics are crucial in terms of international student mobility: First, the social background of students determines the mobility behaviour. Second, students’ age and the associated living condi- tions play the most important role for understanding students’ affinity towards enrolment abroad. Both factors are closely related to financial issues. The former case concerns mainly supporting issues while the latter addresses more the living conditions as a whole. Especially for younger students state support is crucial for their decision whether to pass part of their studies abroad or not. Also students with impairment are less affine towards enrolment abroad than the average of Austrian students, though they almost reach an average share regarding internships abroad.