Development of a reliable single-cell aCGH suitable for clinical samples
DISSERTATION ZUR ERLANGUNG DES DOKTOGRADES DER
NATURWISSENSCHAFTEN (DR. RER. NAT.) DER FAKULTÄT FÜR BIOLOGIE UND VORKINISCHE MEDIZIN DER UNIVERSITÄT REGENSBURG
vorgelegt von Zbigniew Tadeusz Czyż
aus
Czarnków, Polen im Jahr
2014
2
Zusammensetzung des Prüfungsausschusses
1. Vorsitzender: Prof. Dr. Stephan Schneuwly 2. Erstgutachter: Prof. Dr. Thomas Dresselhaus 3. Zweitgutachter: Prof. Dr. Christoph A. Klein 4. Drittprüfer: Prof. Dr. Gunter Meister 5. Ersatzgutachter: Prof. Dr. Richard Warth
3 Das Promotionsgesuch wurde eingereicht am:
14.11.2014
Die Arbeit wurde angeleitet von:
Prof. Dr. Christoph A. Klein
Unterschrift:
4 Pracę tę dedykuję moim rodzicom,
Hannie i Tadeuszowi Czyż,
w podzięce za ich miłość, nieustające wsparcie, i nieoceniony wysiłek włożony
w każdy etap mojego wychowania.
5 This work I dedicate to my parents,
Hanna and Tadeusz Czyż,
thanking for their love, unfailing support and invaluable efforts invested
in every stage of my upbringing.
6
“Pain is temporary.
It may last for a minute, or an hour, or a day, or (even) a year, but eventually it will subside
and something else will take its place.
If I quit, however, it lasts forever”.
– Lance Armstrong
7
Index of contents.
List of abbreviations. ... 10
1. Introduction. ... 12
1.1. Metastasis as the major cause of cancer related deaths. ... 12
1.1.1. Incidence and caused of cancer related deaths. ... 12
1.1.2. Metastasis as a multistep, evolutionary process. ... 12
1.1.3. Models of metastatic cancer progression. ... 13
1.2. Detection and analysis of metastatic cancer spread. ... 15
1.2.1. Overview of methods for detection of minimal residual disease. ... 15
1.2.2. Overview and clinical application of immunological assays for detection of occult micrometastatic tumor cells. ... 17
1.2.3. The need for more detailed analysis of mircometastatic cancer cells. ... 19
1.3. Genomic analysis of single cells. ... 19
1.3.1. Overview of the methods available for the analysis of single cell genomes. ... 19
1.3.2. Comprehensive analysis of single cell genomes. ... 21
1.4. Aim of dissertation. ... 24
2. Materials and methods. ... 25
2.1. Materials. ... 25
2.1.1. Reagents. ... 25
2.1.2. Enzymes. ... 27
2.1.3. Kits. ... 27
2.1.4. Consumables. ... 28
2.1.5. Laboratory Hardware. ... 29
2.1.6. Buffers and solutions. ... 30
2.1.7. Patients. ... 32
2.1.8. Cell lines. ... 33
2.2. Methods. ... 33
2.2.1. Fluorescent in situ hybridization (FISH). ... 33
2.2.2. Tissue processing and immunocytochemical screening for DCCs. ... 34
2.2.3. Laser microdissection. ... 35
2.2.4. Primary whole genome amplification (WGA). ... 35
2.2.5. Re-amplification of the WGA products... 38
2.2.6. Quality control of the WGA products. ... 38
2.2.7. Isolation of bulk genomic DNA. ... 40
2.2.8. DNA labeling and CGH hybridization on metaphase spreads (mCGH). ... 40
Index of contents
8
2.2.9. DNA labeling and aCGH hybridization on oligonucleotide microarrays... 41
2.2.9.1. Random-primed DNA labeling approach (RP labeling). ... 41
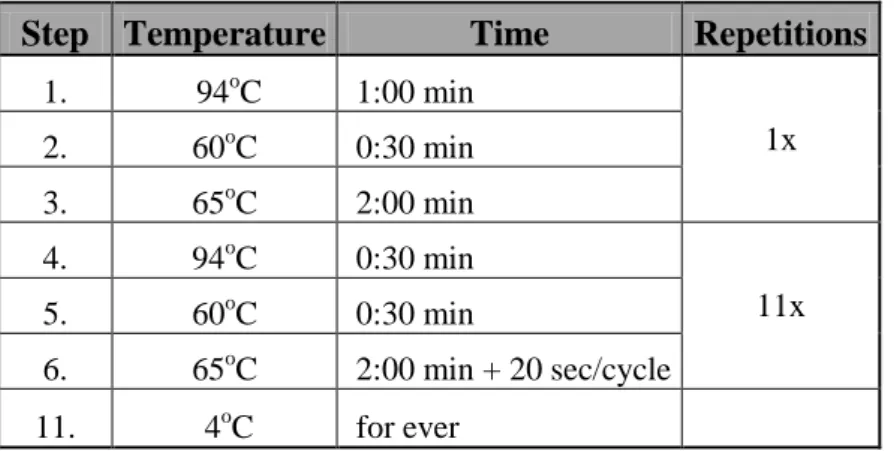
2.2.9.2. PCR-based labeling techniques for WGA products generated by SCOMP. ... 43
2.2.9.2.1. PCR-based labeling using dye-conjugated universal primer (PCR-T1). ... 43
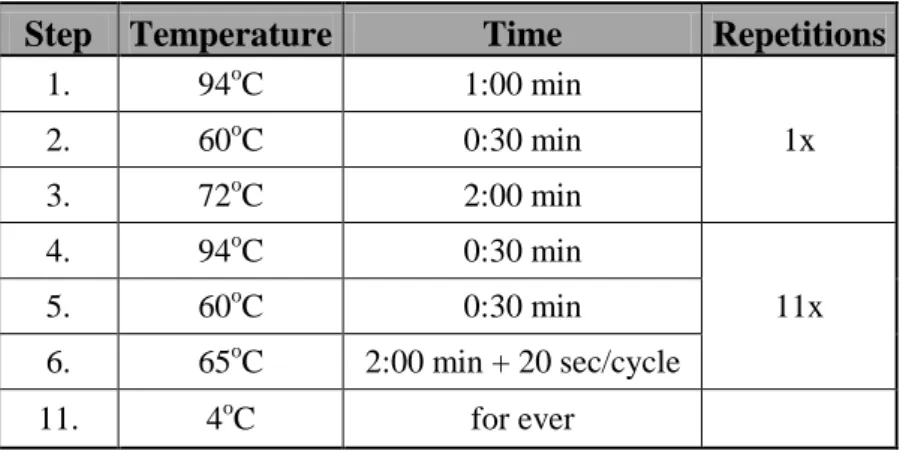
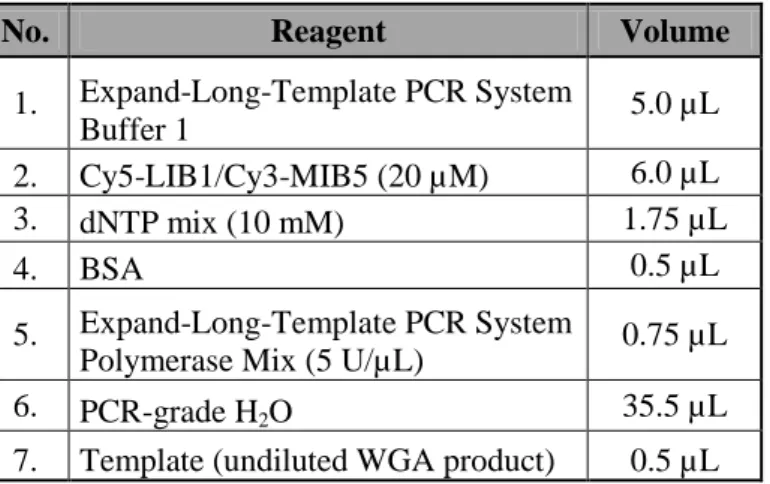
2.2.9.2.2. PCR-based labeling using incorporation of dye-conjugated dNTPs (PCR-T2). 45 2.2.9.3. Array comparative genomic hybridization on oligonucleotide arrays... 46
2.2.9.4. Processing and analysis of the aCGH data. ... 46
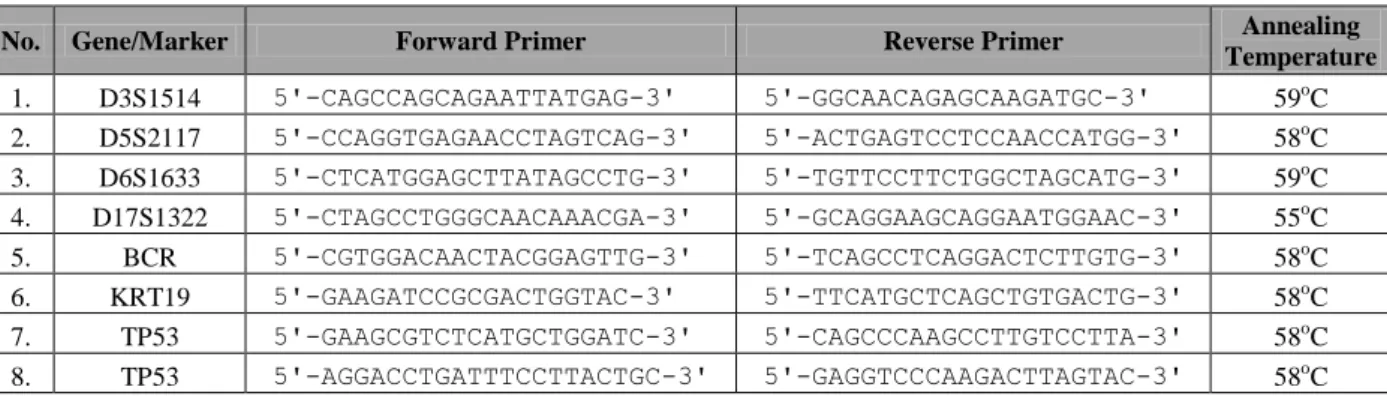
2.2.9.5. Identification of minimal regions of aberration (MRAs). ... 47
2.2.9.6. ROC analysis and hierarchical clustering of the aCGH data. ... 47
2.2.10. DNA labeling and aCGH hybridization on BAC based microarrays. ... 48
2.2.10.1. The design of the BAC aCGH microarrays. ... 48
2.2.10.2. Labeling of WGA product. ... 48
2.2.10.3. Hybridization on BAC aCGH microarrays. ... 49
2.2.10.3.1. Blocking of the microarray slides and denaturation of BAC DNA probes. ... 49
2.2.10.3.2. Hybridization of WGA products on the BAC aCGH microarrays. ... 50
2.2.10.4. Washing of the BAC aCGH microarrays. ... 51
2.2.10.5. Scanning of the BAC aCGH microarrays. ... 51
2.2.10.6. Analysis of the BAC aCGH microarrays. ... 51
2.2.11. Single-cell quantitative PCR (qPCR) assay for detection of genomic gains in ERBB2 locus. ... 52
2.2.12. Statistical analysis. ... 53
3. Results. ... 54
3.1. Development of a new single-cell aCGH assay. ... 54
3.1.1. Optimization and validation of new DNA labeling approaches customized for the processing of SCOMP WGA products. ... 54
3.1.2. Comparison of the PCR-T2 approach with the random primed isothermal amplification DNA labeling system (RP labeling). ... 57
3.1.2.1. Analysis of freshly isolated, unfixed cells. ... 57
3.1.2.2. aCGH analysis of cells after immunostaining. ... 59
3.1.3. Reproducibility of the single-cell aCGH analysis. ... 61
3.1.4. Selection of the best performing type of reference sample. ... 62
3.1.5. Suitability of re-amplified single-cell WGA product for high resolution aCGH . ... 63
3.2. Performance of the high-resolution single-cell aCGH assay. ... 64
3.2.1. Detection of genomic heterogeneity between individual cells. ... 64
3.2.2. Quantitative assessment of CNAs in the single cells. ... 66
3.2.3. Comparison with previously available methods for single-cell CGH. ... 68
9
3.3. Application of the new single-cell aCGH assay to the analysis of single DCCs. ... 70
4. Discussion. ... 74
4.1. Development of a high-resolution aCGH assay for accurate mapping of genomic aberrations in single cells. ... 74
4.1.1. Selection of the most suitable aCGH platform. ... 74
4.1.2. Selection of WGA technology. ... 75
4.1.3. Selection of a strategy for DNA labeling. ... 76
4.1.4. Selection of reference samples. ... 77
4.2. Advantages of the novel single-cell aCGH assay. ... 77
4.3. Applicability of the new analysis to monitor genomic heterogeneity of clinical DCCs – proof-of-principle case report. ... 78
4.4. Utility of the new method in the era of high-throughput sequencing. ... 80
5. Summary. ... 82
6. References. ... 83
7. Acknowledgments. ... 95
8. Curriculum vitae. ... 96
List of abbreviations
10
List of abbreviations.
# Abbreviation Description
1. µL Micorliter
2. aCGH Array comparative genomic hybridization
3. ADO Allelic drop-out
4. AML Acute myeloid leukemia
5. APAAP Alkaline phosphatase - anti-alkaline phosphatase technique 6. ATCC American Type Culture Collection
7. ATP Adenosine triphosphate
8. AUC Area under the curve
9. BAC Bacterial artificial chromosome 10. BCIP 5-bromo-4-chloro-3-indolyl phosphate
11. BSA Bovine serum albumin
12. CEP Centromere enumeration probe
13. CHORI Children’s Hospital Oakland Research Institute
14. CKs Cytokeratins
15. CNAs Copy number alterations
16. CTCs Circulating tumor cells 17. DAPI 4',6-diamidino-2-phenylindole
18. dATP Deoxyadenosine
19. DCCs Disseminated cancer cells
20. dCTP Deoxycytidine
21. DEP Dielectrophoresis
22. dGTP Deoxyguanosine
23. DLRS Derivative log2 ratio spread
24. DMEM Dulbecco's Modified Eagle's Medium
25. DNA Deoxyribonucleic acid
26. dNTPs Deoxyribonucleotides
27. DOP-PCR Degenerate oligonucleotide-primed PCR
28. DSMZ Deutsche Sammlung von Mikroorganismen und Zellkulturen/
German Collection of Microorganisms and Cell Cultures
29. dTTP Deoxythymidine
30. dUTP Deoxyuridine
31. ECACC European Collection of Cell Cultures 32. EDTA Ethylenediaminetetraacetic acid 33. EpCAM Epithelial cell adhesion molecule 34. FACS Fluoresce activated cell sorting 35. FAST Fiber-optic array scanning technology
36. FCS Fetal Calf Serum
37. FDA U.S. Food and Drug Administration 38. FFPE Formalin fixed paraffin embedded 39. FISH Fluorescent in situ hybridization
11
40. gDNA Genomic DNA
41. GEO Gene Expression Omnibus
42. HPLC High-performance liquid chromatography 43. IARC International Agency for Research on Cancer 44. ISET Isolation by size of epithelial tumor cells
45. kb Kilobase
46. m/v Mass to volume
47. MACS Magnetic activated cell sorting
48. MALBAC Multiple annealing and looping based amplification cycles
49. Mb Megabase
50. mCGH Metaphase comparative genomic hybridization 51. MDA Multiple displacement amplification
52. MEMS Micro-electro-mechanical system
53. mL Milliliter
54. MRA Minimal region of Aberration
55. NBT Nitroblue tetrazolium
56. NGS Next generation sequencing
57. OPA One-phor-all buffer
58. PBS Phosphate Buffered Saline buffer
59. PCR Polymerase chain reaction
60. PCR-T1 PCR-based labeling using dye-conjugated universal primer 61. PCR-T2 PCR-based labeling using incorporation of dye-conjugated dNTPs 62. PEP-PCR Primer-extension preamplification PCR
63. PFGE Pulse field gel electrophoresis 64. PGD Preimplantation genetic diagnosis
65. PMT Photomultiplier tube
66. PSA Prosate specific antigene
67. ROC Receiver operating characteristic
68. RP labeling Random-primed DNA labeling approach
69. rpm Revolutions per minute
70. SCOMP Single-cell comparative genomic hybridization
71. SDS Sodium dodecyl sulfate
72. SSC Saline-sodium citrate
73. TAE Tris-Acetate-EDTA buffer
74. TBE Tris-borate-EDTA buffer
75. Thr Threshold
76. ULS Universal linkage system
77. v/v Volume to volume
78. WGA Whole genome amplification
Introduction
12
1. Introduction.
1.1. Metastasis as the major cause of cancer related deaths.
1.1.1. Incidence and caused of cancer related deaths.
Population based studies showed that cancer is among the leading causes of death worldwide.
A recent report of the International Agency for Research on Cancer (IARC) on global patterns of cancer related incidence and mortality indicated that in 2012 alone 8.2 million people died of cancer and another 14.1 million new cases have been diagnosed [1]. Furthermore, it is projected that by 2030 the global cancer incidence will reach 22.2 million causing 13.2 million deaths and thereby becoming the major cause of morbidity and mortality worldwide [2]. The most common cancers are carcinomas, solid tumors arising in epithelial tissues, among which five tumor entities account for close to 50% of all deaths related to cancer: lung, breast, colorectal, prostate and stomach cancers [1]. Moreover, more than 90% of mortality from solid cancers can be attributed to metastasis, defined as the outgrowth of cancer cells in organs anatomically distant to the tissue of cancer origin [3]. Despite significant progress in cancer treatment, in particular introduction of novel therapeutic agents targeting specifically cancer relevant genes (e.g. Trastuzumab, a drug modulating activity of HER2/neu, which drives tumor progression in ~20% of breast cancer patients) [4,5], the prognosis for patients with late stage (metastatic) carcinomas has not changed over the last four decades with majority of patients dying within five years after the initial diagnosis and disease remaining largely incurable at this stage [6,7]. Compared to metastatic patients the average survival rate is higher in individuals with locally confined tumors (e.g. in breast cancer the expected 5-year survival rates estimated at diagnosis for patients with localized and metastatic disease amounts to 98.4 or 23.9%, respectively) [7]. Nevertheless, even in early-stage cancer patients metastatic lesions can arise after long latency periods. For instance, in breast cancer relapse can occur even twenty years after the initial diagnosis and treatment [8]. Consequently, the outcome of cancer treatment largely depends on the capacity to prohibit the process of metastatic spread or inhibit it at the earliest possible stage.
1.1.2. Metastasis as a multistep, evolutionary process.
Metastatic outgrowth and generation of clinically detectable metastases is a final product of a series of events collectively termed invasion metastasis cascade [9]. During the course of this process cancer cells of the primary tumor need to pass through various steps, all of which
13 pose a selective pressure for cancer cells: (1) invade locally through extracellular matrix and stromal tissue, (2) enter the hematogenous or lymphatic circulation, (3) survive the transit through the vasculature, (4) arrest at the metastatic site, (5) extravasate into the parenchyma of the distant tissue, (6) survive in the foreign microenvironment of the distant organ, and (7) reinitiate proliferation [9]. Each of these impediments exerts different selective pressure on cancer cells necessitating them to acquire new traits to adapt to the surrounding conditions.
Therefore, every step in the metastatic cascade can limit or terminate further spread, proliferation, and survival of cancer cells [9-11]. Consequently, selection of the cellular clone with the highest metastatic potential is likely to be based on the principles of asexual evolution of neoplastic cells [12]. For the succeeding cycles of selection and adaptation to take place, a mechanism is needed providing heterogeneity within the population of metastasizing cancer cells. Heterogeneity of the neoplastic cells may result from genome instability, a characteristic which is considered to be one of the hallmarks of cancer [13].
Acquisition of genetic changes results in generation of heritable phenotypes, which may confer selective advantage to overcome environmental barriers occurring along the metastatic cascade, ultimately leading to selection of full malignancy. Therefore, to effectively treat cancer it is critical to identify key genetic events preceding metastatic outgrowth of tumor cells in ectopic organs.
1.1.3. Models of metastatic cancer progression.
For a long time it was assumed that the genetic evolution of an individual cancer, from its ontogeny to full malignancy, takes place within the microenvironment of the primary tumor.
This was supported by an observation that accumulation of genetic and epigenetic alterations was strongly associated with the stepwise acquisition of morphological abnormalities by the tumor tissue [14]. Based on these findings, a linear progression model of metastasis was established (Figure 1A) [14]. According to this paradigm, tumor progression is associated with gradual acquisition of advantageous genetic changes, e.g. activation of oncogenes or inactivation of tumor suppressor genes caused by mutations, allowing clonal expansion of more aggressive cellular variants producing larger and more dysplastic tumors. In this process, the ability of cancer cells to metastasize is strongly associated with the accumulation of genetic and epigenetic changes [14]. Therefore, the capacity to metastasize was largely restricted to cancer cells of large, late-stage tumors only, which already acquired full malignancy. Consequently, the genetic landscape of cancer cells present in the circulation
Introduction
14 (both lymphogenous and hematogenous) and the matched primary tumor should be similar.
Should this model be true, then the primary tumors could be used as good surrogate markers for selection of therapies, as it would comprise the complete set of genetic event that have led to the development of metastases. Although the linear progression model of cancer has been widely accepted, several clinical observations are not fully compatible with this concept. First, distant metastases can develop at early stages of cancer progression from small tumor lesions.
For instance, systemic spread of cancer cells, manifested by the presence of disseminated cancer cells (DCCs) in the bone marrow, could be detected in 13-21% of patients with ductal carcinoma in situ (a premalignant lesion of mammary epithelium) [15-17] and in 29% of breast cancer patients with T1 stage tumors (tumor size < 2cm) [18]. Second, 5-10% of cancer patients are diagnosed with so called cancer of unknown primary origin, wherein metastatic disease was detected even though the location of the primary lesion could not be determined [19]. Third, seemingly non-metastatic early-stage cancer may relapse even after a complete resection of the primary tumor [20,21]. Due to these contradictions, a second model of tumor progression was established, termed “parallel progression model” (Figure 1B) [22].
According to this model, cancer cells leave the primary tumor early and simultaneously disseminate to various distant sites, where they progress in parallel with the primary lesion and acquire various traits, while adapting to the local microenvironment. Apart from the clinical observations stated above, this model was further supported by experimental data from studies on murine models of breast cancer. In the study published by Hüsemann and colleagues it was shown that systemic spread of cancer cells can be detected at the premalignant stage of tumor progression [17]. In addition, results of another study, by Podsypanina et al. showed that phenotypically normal, untransformed, mammary epithelial cells may survive in the circulation and, after oncogene activation has occurred, form metastases in distant organs [23]. Given that systemic spread of cancer cells is early, the course of tumor progression at the ectopic sites and in the primary tumor may vary substantially leading to development of distinct cancer genotypes and phenotypes. If this would be the case, then the genetic information confined in the primary tumor alone would have to be deemed insufficient to accurately identify patient subsets that could benefit from targeted anti-cancer therapies necessitating concurrent analysis of cancer cells present in the circulation.
15 Figure 1.
Models of systemic cancer progression.
In the linear progression model (A) genetic clones of cancer cells (here depicted symbolically as circles; various colors represent unique genetic subclones) accumulate oncogenic changes gradually becoming increasingly malignant. The ability to metastasize is restricted to cells that have acquired full malignant potential.
Consequently metastatic spread is a late event in the systemic progression and the level of genetic diversity between primary tumor and metastasis will remain low. In contrast in parallel progression model (B) dissemination starts early – before cancer cells attained a fully malignant potential. Consequently, further steps of cancer progression take place in parallel at multiple anatomical sites (both in primary tumor or distant sites) generating heterogenic cancer clones. Figure adapted from Caldas C. [24] and Greaves M. et al [25].
1.2. Detection and analysis of metastatic cancer spread.
1.2.1. Overview of methods for detection of minimal residual disease.
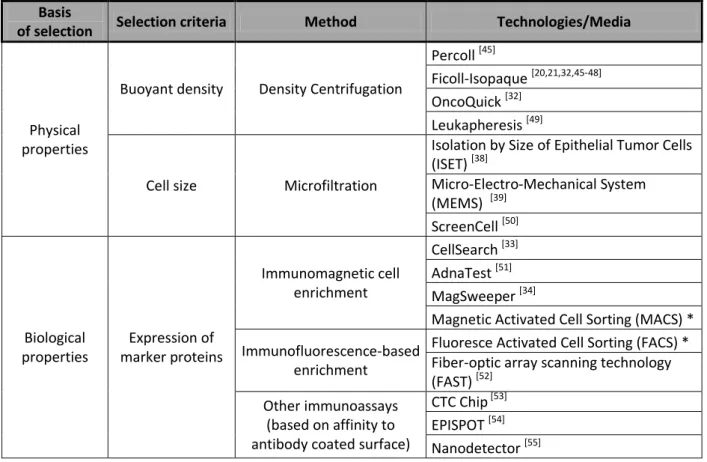
Multiple assays were developed to identify and enumerate DCCs in lymph nodes or bone marrow and circulating tumor cells (CTCs) in the blood [26-28]. However, due to the extremely low tumor burden in the circulation of cancer patients (approximately 1 tumor cell in 105 to 107 of nucleated blood or bone marrow cells [29]), which is well beyond the detection limit of standard histopathological analysis, direct detection and isolation of tumor cells is not practical without prior enrichment. This is achieved by means of density centrifugation, selection based on physical properties (such as cell size) or expression of
Introduction
16 tumor associated markers (Table 1) [30-40]. A variety of methods have been used for the subsequent identification of DCCs or CTCs [41-43]. Detection of tumor cells is based on methods capable of distinguishing cells of different origin, i.e. hematopoietic white blood cells from epithelial tumor cells. Among those, the most widely used protocols are: (i) immunological assays or (ii) molecular methods based on polymerase chain reaction (PCR) (Table 2). Immunological assays utilize monoclonal antibodies to select cells based on the expression of various proteins, e.g. epithelial markers such as epithelial cell adhesion molecule (EpCAM) or cytokeratins (CKs) (used for positive selection) and/or common leukocyte antigen CD45 (used for negative selection) [26,27,44].
Table 1. Methods for enrichment of DCCs and CTCs.
Basis
of selection Selection criteria Method Technologies/Media
Physical properties
Buoyant density Density Centrifugation
Percoll [45]
Ficoll-Isopaque [20,21,32,45-48]
OncoQuick [32]
Leukapheresis [49]
Cell size Microfiltration
Isolation by Size of Epithelial Tumor Cells (ISET) [38]
Micro-Electro-Mechanical System (MEMS) [39]
ScreenCell [50]
Biological properties
Expression of marker proteins
Immunomagnetic cell enrichment
CellSearch [33]
AdnaTest [51]
MagSweeper [34]
Magnetic Activated Cell Sorting (MACS) * Immunofluorescence-based
enrichment
Fluoresce Activated Cell Sorting (FACS) * Fiber-optic array scanning technology (FAST) [52]
Other immunoassays (based on affinity to antibody coated surface)
CTC Chip [53]
EPISPOT [54]
Nanodetector [55]
* - multiple reagents and systems customizable to various marker proteins.
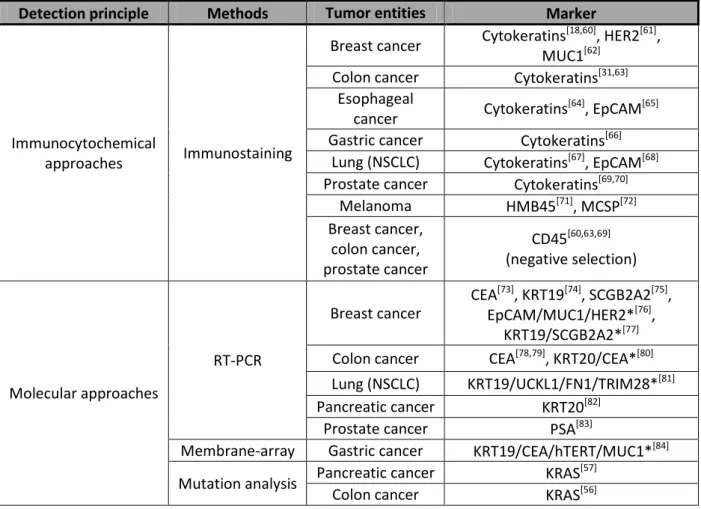
Molecular approaches on the other hand, target known genetic alterations of the DNA sequence (e.g. mutations of KRAS or TP53 gene [56,57]) or aberrant expression of tissue specific or tumor associated markers [26,27,29,58,59]. Both detection systems provide clinically relevant information on the prognosis of cancer patients. However, the advantage of the immunological assays is that they allow morphological identification and subsequent isolation of tumor cells for further analyses, thereby allowing more comprehensive studies of
17 DCCs and CTCs, in particular enabling analysis of cellular heterogeneity and clonal composition of these cell populations. Due to this limitation of the molecular detection methods, the remaining part of this chapter will be focused exclusively on the immunocytochemical detection of occult metastatic cells.
Table 2. Methods for detection of DCCs and CTCs.
Detection principle Methods Tumor entities Marker
Immunocytochemical
approaches Immunostaining
Breast cancer Cytokeratins[18,60], HER2[61], MUC1[62]
Colon cancer Cytokeratins[31,63]
Esophageal
cancer Cytokeratins[64], EpCAM[65]
Gastric cancer Cytokeratins[66]
Lung (NSCLC) Cytokeratins[67], EpCAM[68]
Prostate cancer Cytokeratins[69,70]
Melanoma HMB45[71], MCSP[72]
Breast cancer, colon cancer, prostate cancer
CD45[60,63,69]
(negative selection)
Molecular approaches
RT-PCR
Breast cancer
CEA[73], KRT19[74], SCGB2A2[75], EpCAM/MUC1/HER2*[76],
KRT19/SCGB2A2*[77]
Colon cancer CEA[78,79], KRT20/CEA*[80]
Lung (NSCLC) KRT19/UCKL1/FN1/TRIM28*[81]
Pancreatic cancer KRT20[82]
Prostate cancer PSA[83]
Membrane-array Gastric cancer KRT19/CEA/hTERT/MUC1*[84]
Mutation analysis Pancreatic cancer KRAS[57]
Colon cancer KRAS[56]
* - panels of markers used for detection.
1.2.2. Overview and clinical application of immunological assays for detection of occult micrometastatic tumor cells.
In the late 1980s and early 1990s several immunocytochemistry assays were designed employing monoclonal antibodies to detect occult micrometastatic cells based on the expression of various epithelial markers, including CKs (component of epithelial cytoskeleton), mucin (membrane-bound protein forming protective mucous barriers on epithelial surfaces), prostate specific antigen (PSA) and EpCAM (also known as 17-1A or HEA125) [85,86]. However, the detection rates of these approaches varied considerably
Introduction
18 depending on the tumor type, tumor stage and the monoclonal antibody used [87,88]. For this reason, attempts have been made to standardize the immunocytochemistry protocols for detection of DCCs [44]. As a result guidelines have been established for detection of DCCs in the bone marrow of breast cancer patients recommending detection of cancer cells by pan- cytokeratin antibodies directed against a wide spectrum of CKs (i.e. antibody A45-B/B3 directed against a common epitope of CKs 8, 18 and 19) [44]. In a similar study, EpCAM was shown to be the most reliable marker for detection of DCCs in the lymph nodes of carcinoma patients [89]. Detection of cytokeratin positive cells in bone marrow or EpCAM positive cells in lymph nodes of non-metastatic cancer patients was strongly associated with an inferior outcome of breast, prostate, lung and esophageal cancer patients indicating that cells detected by both assays are truly cancer cells [18,64,70,90-92]. In a more recent study, similar association was also found between the survival time of breast cancer patients and the presence of occult cytokeratin positive (CK+) cancer cells in the peripheral blood. Strikingly, detection of CK+ cells was prognostically relevant only for metastatic but not for early stage cancer patients [93]. Nevertheless, since the peripheral blood is easy to obtain and its biopsy is less invasive than the aspiration of bone marrow, a series of techniques have been developed to specifically detect CTCs [26,28,59]. The most relevant approach in this context is the CellSearch® System, a device allowing semi-automated positive immunomagnetic enrichment (using EpCAM specific antibodies) and subsequent enumeration of CKs(+)/ CD45(-)/nucleated (DAPI(+)) cancer cells [33]. In prospective clinical studies positive detection of CTCs by the CellSearch® system (defined as ≥ 5 or 3 CTCs in 7.5 mL of blood) showed a significant association with overall and progression-free survival time of patients with metastatic breast, prostate and colon cancer [60,63,69]. These findings led to the clearance of the approach by the U.S. Food and Drug Administration (FDA) for the detection of CTCs in the peripheral blood of patients with afore the mentioned malignancies. More recent reports showed that CTCs detected by the CellSearch® System of non-metastatic cancer patients allowed prediction of early recurrence and decreased overall survival in breast cancer patients. This, however, was only possible when using larger sample volumes (i.e.
mononucleated cell fraction extracted from the whole circulating blood by means of diagnostic leukapheresis) and/or reduction of the detection thresholds to only one CTC per specimen, thereby reducing the feasibility of these approach [49,94-96]. Therefore, at least for early stage cancer patients, detection and enumeration of occult micrometastatic cells is more reliable if using manual immunologic detection methods mentioned before.
19 1.2.3. The need for more detailed analysis of mircometastatic cancer cells.
Presence of occult micrometastatic lesions in the circulation of carcinoma patients allows to discriminate between individuals with poor and favorable prognosis. In the future this approach may become a valuable tool for therapeutic decision making and monitoring of the effectiveness of administered therapies. However, to better understand the biology underlying the early stages of systemic cancer spread it is necessary to comprehensively analyze detected metastatic cancer cells and identify the genetic programs governing this stages of disease [97].
Due to extremely low abundance of detectable CTCs and DCCs as well as their genetic heterogeneity, the true extent of genetic alterations in these cell populations can be assessed only at the single-cell level.
1.3. Genomic analysis of single cells.
1.3.1. Overview of the methods available for the analysis of single cell genomes.
Application of single-cell analysis allows to analyze minimal amounts of DNA material and reveals the biological complexity of cell populations, which would be obscured by analyzing bulk DNA. However, owing to the limited amount of genomic DNA in a single cell (approximately 6.5 pg) [98] direct analysis of single-cell DNA is challenging and the number as well as the type of downstream assays becomes significantly diminished allowing simultaneous analysis of a maximum of 96 loci by assays based on PCR or 12 loci by methods based on fluorescent in situ hybridization (FISH) [99,100]. Single-cell PCR was first used in the clinic in preimplantation genetic diagnosis (PGD) of monogenic diseases, such as cystic fibrosis, sickle cell anemia or β-thalassemia [101-103], sex determination of embryos at risk of X-linked diseases and, more recently, for the quantitative aneuploidy screening [99].
Single-cell PCR approaches were partially replaced by FISH, as it allowed detection of chromosomal mosaicism within the embryo and screening for translocations [104,105].
However, both methods (PCR and FISH) have several inherent shortcomings, in particular suboptimal reliability and accuracy, as well as limited amount of loci that can be simultaneously tested [106-108]. Hence, over the last twenty five years substantial efforts have been invested to develop and improve methods allowing amplification of the entire human genome [47,109-118]. These approaches, collectively termed whole genome amplification (WGA), were design to provide a comprehensive, accurate and unbiased representation of the starting material in amounts sufficient for extensive downstream testing.
Introduction
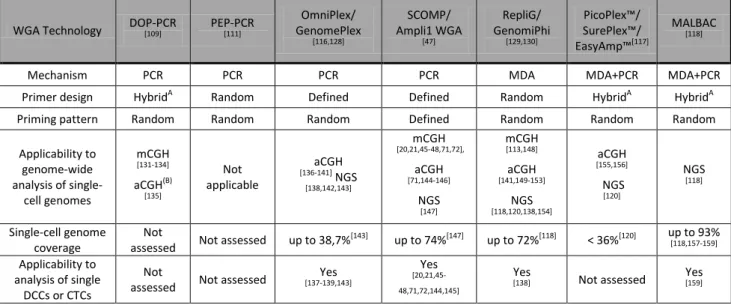
20 Currently existing WGA approaches are based on multiple displacement amplification (MDA) [113-115], variants of polymerase chain reaction (PCR) [47,109-112,116] or a combination of both of these technologies (Table 3) [117,118]. However, none of these technologies is without drawbacks and, due to inherent characteristics of their design, all WGA methods are prone to introduce different types of bias, which may influence the evaluation of downstream analyses.
The WGA-related amplification bias may include the following:
(i) Quantitative amplification bias causing considerable representation bias of individual loci and random losses of alleles (allelic drop-out; ADO) [113,119- 121].
(ii) Qualitative amplification bias caused by formation of amplification artefacts such as chimeric sequences linking non-contiguous loci in the DNA [115,120,122].
(iii) Incomplete coverage of the amplified genomes leading to underrepresentation of template DNA [115,120,123].
(iv) Poor performance with partially degraded template DNA [114,124-127].
(v) Stochastic priming of template DNA molecules, which may hamper the downstream analysis of WGA products [115,126].
Table 3. Overview of WGA technologies.
WGA Technology DOP-PCR
[109] PEP-PCR
[111]
OmniPlex/
GenomePlex
[116,128]
SCOMP/
Ampli1 WGA
[47]
RepliG/
GenomiPhi
[129,130]
PicoPlex™/
SurePlex™/
EasyAmp™[117]
MALBAC
[118]
Mechanism PCR PCR PCR PCR MDA MDA+PCR MDA+PCR
Primer design HybridA Random Defined Defined Random HybridA HybridA
Priming pattern Random Random Random Defined Random Random Random
Applicability to genome-wide analysis of single-
cell genomes
mCGH
[131-134]
aCGH(B)
[135]
Not applicable
aCGH
[136-141] NGS
[138,142,143]
mCGH
[20,21,45-48,71,72],
aCGH
[71,144-146]
NGS
[147]
mCGH
[113,148]
aCGH
[141,149-153]
NGS
[118,120,138,154]
aCGH
[155,156]
NGS
[120]
NGS
[118]
Single-cell genome coverage
Not
assessed Not assessed up to 38,7%[143] up to 74%[147] up to 72%[118] < 36%[120] up to 93%
[118,157-159]
Applicability to analysis of single
DCCs or CTCs
Not
assessed Not assessed Yes
[137-139,143]
Yes
[20,21,45- 48,71,72,144,145]
Yes
[138] Not assessed Yes
[159]
A – primer contain random and defined sequence B – poor performance in aCGH
21 Inherent characteristics of the different WGA approaches make them better suited for specific types of samples, e.g. formalin fixed paraffin embedded (FFPE) tumor tissue specimens [114,125,127], or specific downstream applications [120,141]. For instance, approaches using random primer design, e.g. DOP-PCR, PEP-PCR and MDA are considered to be suboptimal for analysis of partially degraded DNA samples [114,124-127] and PCR-based approaches were shown to be more accurate for the assessment of copy number changes in single-cell WGA products [120,141]. Therefore, WGA methods should be carefully selected depending on the type of analysis to be conducted and the type of samples under investigation. Due to their high reliability of processing samples with compromised DNA quality [125-127] WGA methods based on adaptor mediated PCR, in particular GenomPlex and SCOMP, were used in most studies on CTCs and DCCs [8,20,21,45,46,48,71,137-140,143-146,160]. Genomic profiling of these samples is especially challenging due to fixation of cells performed prior to the amplification of DNA. Therefore, WGA approaches used to process DCCs and CTCs need to be highly robust and show high tolerance to the adverse effects of fixation [144].
1.3.2. Comprehensive analysis of single cell genomes.
With the advent of WGA technologies more comprehensive analysis of single-cell genomes became possible. Combination of WGA approaches with metaphase comparative genomic hybridization (mCGH) allowed genome-wide screening for copy number alterations in single cells [47,131,134]. mCGH utilizes two samples, test (putatively aberrant) and reference (harboring no copy number changes), which after differential labeling are hybridized to metaphase spreads (Figure 2). This approach proved to be very useful for both PGD and analysis of single DCCs allowing to screen the whole complement of chromosomes for the presence of copy number changes [17,20,21,45,47,132,161-164]. However, due to limited resolution (10-20 Mb), high labor intensity and lack of high-throughput capabilities of mCGH it was soon replaced by array-based CGH (aCGH) approaches (Figure 2). Standard DNA microarrays constructed of BAC clone libraries allowed detection of submicroscopic copy number alterations as small as 2.8 Mb in single trophectoderm cells and 8.3 Mb in unfixed tumor cells [136,155]. Later, utilization of an improved BAC clone based aCGH platform allowed detection of copy number alterations of 1-2 Mb in unfixed cells and 4.4 Mb in DCCs [145].
Introduction
22 Figure 2.
Principle of CGH.
In an CGH experiment test and reference DNA are differentially labeled with two fluorescent dyes (e.g. Cy5 or Cy3, respectively) and co-hybridized on an array of defined DNA probes (array CGH – aCGH) or metaphase spreads (metaphase CGH – mCGH). Following hybridization, florescent ratios (Cy5/Cy3) are quantified revealing copy number variations between test and reference samples. Genomic gains and losses are recognized as fluorescent ratios higher or lower than one, respectively. The accuracy of mCGH is limited by the observable banding resolution of metaphase chromosomes to a level of approximately 450 cytobands (5-10 Mb). In contrast, in array aCGH up to several millions of loci (represented by defined DNA probes) can be quantified simultaneously resulting in higher resolution of the method.
Further improvements were achieved by the introduction of modern oligonucleotide aCGH platforms. Denser distribution of probes in the pre-selected regions of interest allowed detection of 1 Mb-sized genomic alteration in unfixed lymphoblastoid cell and 2.6-3.0 Mb in
23 DCCs [137,156]. However, Möhlendick and coworkers have shown that copy number changes as small as a remarkable 56 kb in size can be detected in unfixed single cells without the need to use targeted array designs [146]. This, however, was only possible when using SCOMP WGA technology [146]. Collectively, studies using single-cell aCGH provided conceptual evidence that cost-effective, high resolution screening for copy number changes in genomes of single CTCs and DCCs is feasible with the use of modern DNA microarray platforms. However, attention needs to be paid to the experimental design and selection of analytical tools. With the advent of next generation sequencing (NGS) technologies, several groups attempted to analyse single-cell genomes with higher resolution. The efficacy of single-cell NGS was first shown by Navin et al., who applied low resolution sequencing to single nuclei of fresh frozen tumor cells allowing to study the genetic structure of cancer cell population in tumor tissue [142]. Subsequently, other groups utilized whole genome or whole exome sequencing approaches on single cells, allowing to study the rate of aneuploidy and de novo mutations in human gametes and unfixed cancer cells [118,165,166]. More recently, whole genome and whole exome NGS approaches were also applied to DCCs and CTCs enabling to capture copy number changes or mutation profiles of single cancer cells [138,143,159]. However, given the high cost for sequencing of a single-cell genome and high complexity of the subsequent computational analysis, NGS technologies are not feasible for routine use for screening of large patient collectives. Therefore, if the aim of the analysis is focused on the high-throughput analysis of copy number alterations in single cells, it still seems to be more rational to use more cost effective methods based on DNA arrays.
Introduction
24 1.4. Aim of dissertation.
The aim of this thesis was to develop a reliable method for comprehensive, high-resolution copy number analysis of single-cell genomes after whole genome amplification (WGA). At the start of the project, single-cell metaphase CGH (mCGH) or BAC-based array CGH (aCGH) allowed detection of chromosomal imbalances with resolution of 10-20 or 1-2 Mb, respectively, concealing smaller (< 1Mb) aberrations and limiting the accuracy of breakpoint detection. To overcome these limitations, a novel high-resolution aCGH workflow had to be developed allowing more precise mapping of copy number variations in single-cell genomes.
To maximize the reliability and the generality of use, the new method should allow the following: (1) applicability to amplified DNA samples, in particular single-cell WGA products, (2) qualitatively and quantitatively faithful genome-wide assessment of chromosomal imbalances, (3) high sensitivity enabling detection of copy number aberrations with a resolution of <1Mb, (4) high specificity minimizing the rates of false-positive detection of chromosomal imbalances, (5) robustness to process clinical samples with decreased DNA quality such as immunostained DCCs or tumor FFPE tissue specimens, (6) uncomplicated experimental and analytical procedures allowing rapid processing and analysis of samples.
25
2. Materials and methods.
2.1. Materials.
2.1.1. Reagents.
# Description Manufacturer
1. 1 kb DNA Ladder Invitrogen
2. 1× TE (pH 8.0), Molecular grade Promega
3. 2-Log DNA Ladder (0.1-10.0 kb) New England Biolabs
4. 4',6-Diamidine-2'-Phenylindole Dihydrochloride (DAPI), 10 mg Roche Diagnostics
5. AB-Serum (human) Biotest AG
6. Acetonitrile Merck
7. Adenosine-5'-Triphosphate (ATP)-Lithiumsalt Solution, 100 mM Roche Diagnostics
8. Agarose Sigma Aldrich
9. Anti-Digoxigenin-FITC, Fab Roche
10. Anti-Digoxigenin-Fluorescein, Fab Fragments Roche Diagnostics
11. APAAP- Komplex Dako
12. Avidin Cy3.5, Purified Biomol
13. Avidin-Cy3.5 USBIO
14. Barrycidal PAN Biotech
15. BCIP/NBT (AP Color Reagent) Bio-Rad
16. BerEP4 Mouse, Monoclonal, M0804, 250 µg/mL Dako
17. Biotin-16-dUTP, 1 mM Roche
18. Boric Acid Sigma Aldrich
19. Bovine Serum Albumin (BSA), 20mg/ml Roche Diagnostics
20. Bovine Serum Albumin (BSA), Factor V Sigma Aldrich
21. CEP 17 FISH Probe, 17q11.1-11-1, Alpha Satellite SpectrumGreen Abbott Molecular
22. Chloric Acid (HCl), 37% (12M) J.T. Baker
23. Cot-1 DNA, 1.0 mg/mL Roche Diagnostics
24. Cot-1 DNA, 1.0 mg/mL Invitrogen
25. Cy3-dCTP (25 nM) GE Healthcare
26. Cy3-dUTP (25 nM) GE Healthcare
27. Cy5-dCTP (25 nM) GE Healthcare
28. Cy5-dUTP (25 nM) GE Healthcare
29. Digoxigenin-11-dUTP, 1 mM Perkin Elmer
30. Disodium Phosphate (Na2HPO4) Sigma Aldrich
31. DMEM/F12 Without L-Glutamate PAN Biotech
32. dNTP Set (100 mM Each dATP,dCTP,dGTP,dTTP) GE Healthcare
33. Dulbecco’s PBS + MgCl2 And CaCl2 Sigma Aldrich
34. Eosin Sigma
35. Ethanol Abs. J.T. Baker
36. Ethidium Bromide, 1% Fluka
37. Ethylenediaminetetraacetic Acid (EDTA) Sigma Aldrich
38. Expand Long Template PCR System Buffer 1 Roche Diagnostics
Materials and methods
26
39. FCS/FBS PAN Biotech
40. Ficoll Paque Plus GE Healthcare
41. Formamide Merck
42. Formamide Sigma Aldrich
43. GelPilot DNA Loading Gel, 5x Qiagen
44. Hanks’ Balanced Salt Solution (HBSS) With Phenol Red Biochrom AG 45. Hanks’ Balanced Salt Solution (HBSS) Without Ca2+, Mg2+,
Without Phenol Red, 0.35 g/L NaHCO3
Biochrom AG
46. Hematoxilin (Mayer's) Sigma
47. Heparin Sigma Aldrich
48. HER-2/neu FISH Probe, 17q11.2-q12 LSI, SpectrumOrange Abbott Molecular
49. Herring Sperm DNA, 10 mg/mL Invitrogen
50. Igepal CA-360 Sigma Aldrich
51. KaryoMAX® Colcemid™ Solution Sigma Aldrich
52. L-Glutamate (L-Glu), 200 µM PAA
53. Low Molecular Weight DNA Ladder New England Biolabs
54. Magnesium Acetat Solution Bio Ultra, ~1M in H2O Sigma Aldrich
55. Magnesium Chloride Sigma Aldrich
56. Methanol (CH3OH) Merck
57. Monopotassium Phosphate (KH2PO4) Merck
58. MOPC21-Isotypkontroll-Antibody (M5284), 1 mg/mL Sigma Aldrich 59. Mouse Monoclonal Antibody A45-B/B3, 0.2 mg/mL Micromet
(AS Diagnostics) 60. Mouse Monoclonal Anti-Cytokeratin 18 Antibody, Clone CK2 Roche
61. Natrium Acetate Solution, 3M (pH = 5.2) Calbiochem
62. Natrium Chloride (NaCl) AppliChem
63. N-Lauroylsarcosine Sigma Aldrich
64. Oligo aCGH/ChIP-on-chip Wash Buffer 1 Agilent
65. Oligo aCGH/ChIP-on-chip Wash Buffer 2 Agilent
66. OnePhorAll (OPA) Buffer, 10X Amersham
67. Pepsin, 1 g Roche
68. Pepton GE Healthcare
69. Percoll GE Healthcare
70. Polyethylene Membrane P.A.L.M. Microlaser
Technologies 71. Potassium acetat solution BioUltra, 5M in H2O Sigma Aldrich
72. Potassium chloride (KCl) Sigma Aldrich
73. Proteinase K recombinant, PCR grade solution Roche Diagnostics
74. Proteinase K, rec. PCR grade Solution Roche Diagnostics
75. RPMI Medium without L-Glutamate PAN Biotech
76. Sephadex G50 Sigma Aldrich
77. Sodium Hydroxide (NaOH) Sigma Aldrich
78. Sodium Pyruvate Sigma
79. Stabilization And Drying Solution Agilent
80. Thermosequenase Buffer GE Healthcare
27
81. Tris(Hydroxymethyl)-Aminomethan (Tris) AppliChem
82. Trisodium citrate AppliChem
83. Tru1I, HC - 50u/µL) Fermentas
84. Trypan Blue VWR International
85. TWEEN® 20 Sigma Aldrich
86. TWEEN® 20, For Molecular Biology, Viscous Liquid Sigma Aldrich
87. Vectashield Vector Laboratories
88. Water HPLC Grade Merck
89. Xylol Carl Roth
90. Penicillin, 10.000 U/mL + Streptomycin, 10 µg/mL (Pen/Strep), 100x
PAN Biotech
2.1.2. Enzymes.
# Description Manufacturer
1. DNA T4 Ligase, 5U/µL Roche
2. DNA Taq Polymerase PanScript, 5U/µL PAN Biotech
3. DNA Taq Polymerase, 5 U/µL Roche
4. Expand Long Template PCR System PolMix Roche Diagnostics
5. MseI Restriction Endonuclease Recombinant, 50 U/µL New England Biolabs
6. Ribonuclease A (100 mg/ml) Qiagen
7. Thermosequenase, 32 U/μl GE Healthcare
8. TruI, 50 U/µL Fermentas
9. Trypsin (10x) PAN Biotech
2.1.3. Kits.
# Description Manufacturer
1. Ampli1™ WGA Kit Silicon Biosystems
2. DNeasy Blood & Tissue Kit Qiagen
3. Oligo aCGH/ChIP-on-chip Hybridization Kit Agilent
4. PathVysion HER-2 DNA Probe Kit Abbott Molecular
5. SureTag Complete DNA Labeling Kit Agilent
6. Light Cycler® SYBRGreenI- Faststart-DNA-Master Mix Roche
Materials and methods
28 2.1.4. Consumables.
# Description Manufacturer
1. 250 mL capacity slide-staining dish
2. 96 Well PCR Adhesive Foil ABGene
3. 96 Well PCR Plate ABGene
4. Acu-Jet® Pro Pipette Controller Brand GmbH + Co KG
5. Adhesion Slides - 2 Chambers Carl Roth
6. Adhesion Slides - 3 Chambers Carl Roth
7. Amicon® Ultra-0.5 Centrifugal Filter Devices; 100kDa Milipore 8. Amicon® Ultra-0.5 Centrifugal Filter Devices; 30kDa Milipore 9. Centrifugation Tubes (Sterile): 15 mL, 50 mL Greiner Bio-One 10. Combitips® Plus, Repetitive Positive Displacement Dispenser/
Pipette Tip
Eppendorf
11. Cover Glass For The Hemocytometer Schubert & Weiss
OMNILAB
12. Cryogenic Tubes Nalgene
13. Dextran Sulfate (Mw > 500000 g/M) Sigma Aldrich
14. EASYstrainer™ Cell Sieve 40 µM Greiner Bio One
15. EASYstrainer™ Cell Sieve 70 µM Greiner Bio One
16. Epoxy Coated Slides Corning
17. Eppendorf Repeater® Stream Electronic Pipette Eppendorf
18. Eppendorf® Research® Pro Electronic Pipette, 8-Channel, 0.5–10 µL
Eppendorf 19. Eppendorf® Research® Pro Electronic pipette, 8-Channel,
20–300 µL
Eppendorf
20. Erlenmeyer Flask VWR International
21. Filter 0.22 µM Millipore
22. Filter Tips For Micropipette 0.1-10 µL Eppendorf
23. Filter Tips For Micropipette 10 µL, 200 µL, 1000 µL Biozym
24. Fixogum (Rubber Vement) Marabu
25. Forceps Agilent
26. Glass Bottle 100 mL, 500mL, 1000 mL, 2000mL, 5000 mL Schott
27. Glass Micro-Hematocrit Capillaries Brand GmbH + Co KG
28. Hellendahl Cuvette Carl Roth
29. Hybridization Chamber, Stainless Agilent
30. LifterSlip (70 µL Volume) Implen
31. LightCycler® 480 Multiwell Plate 96 With PCR Adhesive Foil Roche
32. Magnetic Stir Bar VWR International
33. Measuring Cylinder, Glass Duran Group
34. Measuring Cylinder, Plastic VWR International
35. Microarray Gasket Slide 4-plex format Agilent
36. Microtubes 0.2 mL Thermo Scientific
37. Microtubes Racks Brand GmbH + Co KG
29
38. Neubauer Hemocytometer Schubert & Weiss
OMNILAB
39. Ozone-Barrier Slide Cover Agilent
40. Pipettes: P10, P20, P200, P1000 Gilson
41. Polypropylene Reaction tubes: 0.2 mL, 1.5 mL, 2.0 mL Eppendorf 42. Serological Pipettes (Sterile): 5 mL, 10 mL, 25 mL Greiner Bio-One
43. Slide Holder Agilent
44. SurePrint G3 Human CGH Microarray Kit 4×180K (design code: 022060)
Agilent
45. Surigical Disposable Scalpels Brand GmbH + Co KG
2.1.5. Laboratory Hardware.
# Description Manufacturer
1. Agilent G2565CA Microarray Scanner System Agilent
2. Axioskop 40 Zeiss, Mikroscope Zeiss
3. Benchtop Microcentrifuge Grant Bio / Kisker
4. Centrifuge 5810 R Eppendorf
5. DMRXA-RF8 Fluorescence Microscope Leica
6. Electrophoresis PerfectBlue Gelsystem Peqlab Biotechnologie
GmbH
7. HERAsage Laminar Flow Cabinet Heraeus
8. Hybridization Oven Agilent
9. Hybridization Oven Rotator For Agilent Microarray Agilent
10. Incubator Memmert
11. Inverted Microscope OPTECH
12. Magnetic stir plate with heating element Chemikalien und
Laborbedarf Nierle (CLN)
13. Medimachine DAKO
14. Microcentrifuge, 5417 R Eppendorf
15. Microcentrifuge, 5424 Eppendorf
16. Microdissection Microscope P.A.L.M. Microlaser
Technologies
17. NanoDrop 2000c Thermo Scientific
18. NanoDrop ND-1000 Peqlab Biotechnologie
GmbH
19. Orbital Shaker Schmidt
20. PatchMan NP2 Micromanipulator Eppendorf
21. Peltier Thermal Cycler Tetrad Bio-Rad
22. pH Meter Sartorius AG
23. Scale, Electronic Kern
24. Thermal Shaker (Thermomixer Confort) Eppendorf
25. Thermocycler qPCR, Roche LightCycler® Roche
26. Thermocycler, FlexCycler Analytik Jena
Materials and methods
30
27. Thermocycler, PCT-200 Thermocycler, MJ Research Bio-Rad
28. UV-Transilluminator & CCD Camera Intas
29. Vortex mixer VELP Scientifica
30. Water bath Memmert
2.1.6. Buffers and solutions.
Trypsin/EDTA in 1xPBS 5 mL Trypsine (10x), 20 mL PBS (1x) 10x Tris-Borate-EDTA (TBE) Buffer 0.9 M Tris, 0.9 M H3BO3, 20 mM EDTA
in H2O (deionized)
10x Tris-Acetate-EDTA (TAE) Buffer 0.4 M Tris, 0.2 M Acetic Acid, 10 mM EDTA in H2O (deionized); pH = 8.0
1x Tris-EDTA (TE) Buffer 10 mM Tris (ultrapure), 1mM EDTA in H2O (HPLC Grade); pH = 8.0
10x Phosphate Buffered Saline (PBS) Buffer 85 mM Na2HPO4, 20 mM KH2PO4, 1.5 M NaCl in H2O (deionized)
20x Saline-Sodium Citrate (SCC) Buffer 3M NaCl,300 mM Trisodium Citrate in H2O (Millipore Grade)
4x SSC 20x SSC (see above) diluted five times
with H2O (deionized)
2x SSC 20x SSC (see above) diluted ten times
with H2O (Millipore grade)
1x SSC 20x SSC (see above) diluted twenty times
with H2O (Millipore grade) 2x SSC with 0.1% NP40 0.1% (v/v) Igepal in 2x SSC 0.4x SSC with 0.3% NP40 0.3% (v/v) Igepal in 0.4x SSC
4x SSC + 0.2% Tween-20 0.2 % (v/v) Tween-20 in 4x SSC; pH = 7.4
2x SSC + 0.1 % SDS 0.1% (v/v) SDS in 2x SSC
30% Dextran Sulfate in 4x SCC 30% (m/v) Dextran Sulfate in 4x SSC