The Angola Current in a
Tropical Seasonal Upwelling System
Seasonal Variability in Response to Remote Equatorial and Local Forcing
Dissertation
zur Erlangung des Doktorgrades
der Mathematisch-Naturwissenschaftlichen Fakult¨ at der Christian-Albrechts-Universit¨ at zu Kiel
vorgelegt von
Robert Kopte
Kiel, 2017
Tag der m¨undlichen Pr¨ufung: 28. September 2017 Zum Druck genehmigt: 28. September 2017
gez. Prof. Dr. Natascha Oppelt, Dekanin
Abstract
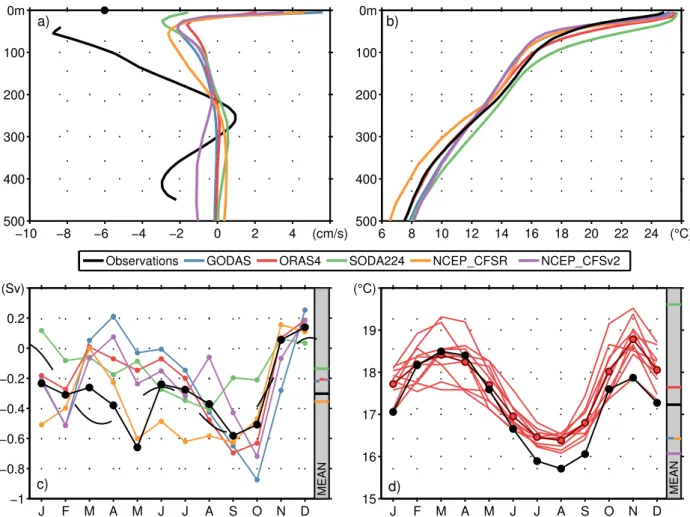
In this thesis, the flow and hydrographic characteristics of the boundary circulation off Angola are investigated, with particular emphasis on the mean properties and the seasonal cycle of the Angola Current. Moored velocity observations acquired at the Angolan shelf at 11◦S between 2013 and 2016 reveal a highly variable alongshore flow with velocities in the range of±40 cm s−1 superimposed on a weak poleward mean current with core velocities not exceeding 8 cm s−1. These measurements question the former view of a permanently poleward flowing Angola Current, which was based on results from few ship campaigns. During the observational period a mean Angola Current southward transport of 0.32±0.05 Sv is determined. Pronounced annual and semiannual oscillations are found in the alongshore current characterized by distinct baroclinic structures. In the equatorial Atlantic, annual and semiannual oscillations are associated with resonant equatorial basin-modes of the fourth baroclinic mode for the annual cycle and the second baroclinic mode for the semiannual cycle. Equatorial basin-modes represent standing modes in a zonally bounded basin being composed of equatorial Kelvin and Rossby waves. A series of shallow water model experiments differing in the basin geometry and/or the applied forcing show a structural robustness of the corresponding horizontal patterns associated with the annual and semiannual cycles. A substantial part of the observed seasonal Equatorial Undercurrent variability can be explained by the linear superposition of the two dominant basin-modes. The off-equatorial lobes of the basin-modes also impact alongshore velocity at the eastern boundary off Angola. In a suite of shallow water model simulations the remote equatorial forcing related to basin-modes is isolated from the effects of local forcing. The observed annual cycle of alongshore velocity at 11◦S is well reproduced by the remote equatorial forcing. For the semiannual cycle, the inclusion of local forcing improves the agreement between observed and simulated velocity oscillations at 11◦S.
Overall, the findings underline the importance of large-scale linear equatorial wave dynamics for the seasonal variability of the boundary circulation off Angola.
Additionally, as part of this study a large data set containing shipboard velocity and hydro- graphic measurements covering the Angolan shelf on a quasi-semiannual basis since 1995 was post-processed and quality-controlled in a capacity building effort with Angolan scientists. These data substantially contribute to the determination of the seasonal cycles in temperature and salinity at 11◦S, in which the main periods of upwelling in July/August and downwelling in March/April are reflected, but also a secondary upwelling season in December/January is indi- cated. Mean alongshore sections of velocity reveal a stronger, vertically more confined Angola Current during austral summer compared to austral winter along with a downstream strengthen- ing of the southward flow just north of the Angola-Benguela Front. In light of still existing severe regional biases in coupled climate model simulations and ocean reanalysis products, the derived velocity sections and similar sections of temperature and salinity might turn out valuable for the assessment of model performances in terms of current strength and hydrographic structure off Angola in the future.
Zusammenfassung
In der vorliegenden Arbeit wird die Zirkulation und Hydrographie im ¨ostlichen Randstrom vor der K¨uste Angolas untersucht. Ein Hauptaugenmerk liegt auf der Beschreibung der mittleren Eigen- schaften des Angolastroms, sowie auf einem verbesserten Verst¨andnis des saisonalen Zyklus der Str¨omung. Zwischen 2013 und 2016 wurden Zeitreihen der Geschwindigkeit mittels Verankerun- gen auf dem angolanischen Schelf bei etwa 11◦S gewonnen. Diese Beobachtungen offenbaren eine stark schwankende k¨ustenparallele Str¨omung mit Geschwindigkeiten im Bereich von ±40 cm s−1. F¨ur den Beobachtungszeitraum ergibt sich eine schwache s¨udw¨artige mittlere Str¨omung mit weni- ger als 8 cm s−1 im Kern des Angolastroms und einem damit verbundenen mittleren s¨udw¨artigen Volumentransport von 0.32 ±0.05 Sv. Die Messungen widerlegen fr¨uhere Annahmen, laut de- nen es sich bei dem Angolastrom um eine kontinuierlich nach S¨uden gerichtete Str¨omung han- delt. Die Variabilit¨at des Angolastroms ist von einem ausgepr¨agten Jahres- und Halbjahres- gang bestimmt, verbunden jeweils mit charakteristischen baroklinen Strukturen. Auch die Zo- nalstr¨omungen entlang des ¨Aquators zeigen einen ausgepr¨agten Jahres- und Halbjahresgang. Der Jahresgang in der Zonalstr¨omung wird mit einer so genannten resonanten ¨aquatorialen Becken- schwingung der vierten baroklinen Mode in Verbindung gebracht, w¨ahrend der Halbjahresgang mit einer Beckenschwingung der zweiten baroklinen Mode assoziiert wird. ¨Aquatoriale Becken- schwingungen entstehen in einem zonal begrenzten ¨aquatorialen Becken durch die ¨Uberlagerung von ¨aquatorialen Kelvin- und Rossbywellen. Die Stabilit¨at der mit Jahres- und Halbjahresgang verbundenen horizontalen Strukturen wird durch eine Reihe von Experimenten mit linearen Flach- wassermodellen best¨atigt. Die lineare ¨Uberlagerung der dominanten Beckenschwingungen erkl¨art wesentliche saisonale Eigenschaften des ¨Aquatorialen Unterstroms (engl. Equatorial Undercur- rent). Die polw¨artigen Ausl¨aufer der Beckenschwingungen im Ostatlantik beeinflussen zudem die k¨ustenparallele Str¨omung vor der K¨uste Angolas. In einer weiteren Serie von Experimenten mit dem Flachwassermodell wird der ¨aquatoriale Antrieb (welcher ¨aquatoriale Beckenschwingungen erzeugen kann) von einem potentiellen lokalen Antrieb vor Angola isoliert. Der beobachtete Jah- resgang im Randstrom vor Angola kann mit einem reinen ¨aquatorialen Antrieb erkl¨art werden.
Die Ber¨ucksichtigung von lokalem Antrieb verbessert jedoch die ¨Ubereinstimmung von beob- achteten und simulierten Halbjahresgang in der Str¨omung. Im Allgemeinen unterstreichen die Ergebnisse die Bedeutung der linearen ¨aquatorialen Wellendynamik f¨ur den saisonalen Zyklus im Randstrombereich vor Angola.
Im Rahmen dieser Studie wurde ein umfangreicher Datensatz in enger Zusammenarbeit mit Wissenschaftlern eines angolanischen Partnerinstitutes prozessiert und aufbereitet. Der Daten- satz enth¨alt schiffsgebundene Geschwindigkeits- und Hydrographiemessungen, welche seit 1995 auf halbj¨ahrlicher Basis erhoben wurden und den gesamten angolanischen Schelf abdecken. Die Daten tragen wesentlich zur Bestimmung des saisonalen Verlaufs von Temperatur und Salzgehalt bei 11◦S bei, welcher vor allem die Hauptphasen von Auftrieb (engl. Upwelling) im Juli/August und Absinken (engl. Downwelling) im M¨arz/April widerspiegelt. Ausserdem finden sich Hinweise
zum S¨udwinter. Beobachtet wird zudem eine Verst¨arkung der mittleren Geschwindigkeit strom- abw¨arts mit Maximalgeschwindigkeiten n¨ordlich der Angola-Benguela Frontalzone. Angesichts der starken systematischen Fehler in gekoppelten Klimasimulationen und Ozean-Reanalyseprodukten k¨onnten sich die gewonnenen mittleren Schnitte der Geschwindigkeit, aber auch von Temperatur und Salzgehalt als sehr wertvoll f¨ur die Verbesserung der zugrundeliegenden Modelle hinsichtlich der Repr¨asentation von Str¨omungen und hydrographischen Strukturen vor der K¨uste Angolas erweisen.
Contents
Abstract i
Zusammenfassung iii
Table of Contents v
List of Figures ix
List of Tables xi
List of Abbreviations xiii
1 Motivation, aim and outline 1
2 Scientific background 7
2.1 Ocean circulation and water masses in the tropical Angolan system . . . 7
2.2 Theory of eastern boundary circulation . . . 9
2.3 Theory of long equatorial waves and basin mode resonance . . . 10
2.3.1 Equatorial Kelvin waves . . . 13
2.3.2 Equatorial Rossby waves . . . 14
2.3.3 Equatorial basin modes . . . 14
3 The Angola Current: Flow and hydrographic characteristics as observed at 11◦S 17 3.1 Introduction . . . 18
3.2 Data and Methods . . . 20
3.2.1 Mooring Data . . . 20
3.2.2 Shipboard and Autonomous Glider Data . . . 21
3.2.3 Auxiliary Data Sets . . . 22
3.2.4 AC Transport Estimation . . . 22
3.2.5 Seasonality of Hydrographic Properties . . . 24
3.3 Results . . . 25
3.3.1 Alongshore Flow and Transport of the AC . . . 25
3.3.2 Seasonality of Hydrographic Properties in the Current Regime . . . 27
3.4 Discussion and Conclusions . . . 29
4 Eastern boundary circulation and hydrography off Angola – building oceano-
graphic capacities in Southwestern Africa 35
4.1 Introduction . . . 36
4.2 The EAF Nansen program . . . 40
4.3 Capacity building efforts . . . 41
4.4 Eastern boundary circulation and hydrography off Angola . . . 43
4.5 Interannual variability of hydrography . . . 49
4.6 Summary and discussion . . . 51
5 Annual and Semiannual Cycle of Equatorial Atlantic Circulation Associated with Basin-Mode Resonance 55 5.1 Introduction . . . 56
5.2 Mooring and CTD data . . . 58
5.3 Model simulations . . . 60
5.4 Results . . . 63
5.4.1 Characteristics of the annual and semiannual cycle . . . 63
5.4.2 Equatorial basin modes as simulated with the reduced-gravity model . . . 65
5.4.3 EUC variability associated with equatorial basin modes . . . 71
5.5 Summary and discussion . . . 74
6 Role of Basin-Mode Resonance for the Seasonal Variability of the Angola Current 79 6.1 Introduction . . . 80
6.2 Observational Data . . . 82
6.3 Shallow water model simulations . . . 84
6.3.1 Basic equations . . . 84
6.3.2 Model setup and forcing . . . 86
6.3.3 Scaling of model-computed modal amplitudes . . . 88
6.4 Results . . . 89
6.4.1 Frequency spectra of observed velocity fields at 23◦W-Equator and 11◦S- Angola . . . 89
6.4.2 Reconstruction of annual and semiannual cycles of zonal velocity at the equator using shallow water model simulations . . . 90
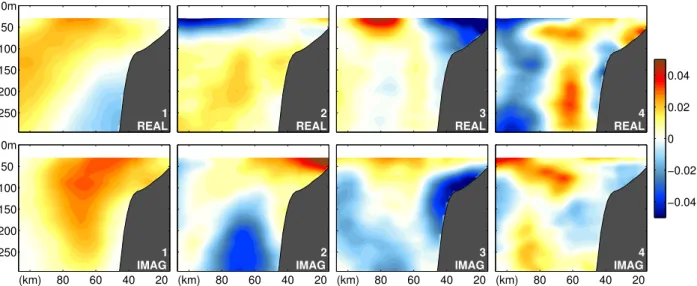
6.4.3 Horizontal structure of annual and semiannual oscillations . . . 94
6.4.4 Observed and reconstructed annual and semiannual cycles of alongshore velocity at 11◦S-Angola . . . 97
6.5 Summary and discussion . . . 99
7 Synthesis 107 7.1 Outlook . . . 113
Contents
Bibliography 117
Own Publications 131
Danksagung 133
Erkl¨arung 135
List of Figures
1.1 Seasonal cycle of SST and surface wind in Southeastern tropical Atlantic Ocean. 2
1.2 SST Bias in coupled general-circulation models . . . 3
2.1 Schematic ocean circulation in the Southeast Atlantic Ocean . . . 8
2.2 Sketch of the shallow water model in Cartesian coordinates . . . 12
2.3 Dispersion diagram of equatorial Kelvin and Rossby waves . . . 13
3.1 The study area off Angola . . . 19
3.2 Variability patterns of 11◦S ship sections . . . 23
3.3 Angola Current transport: Observed vs. reconstructed ship sections . . . 24
3.4 Time series of alongshore velocity at 11◦S-Angola during 2013-15 . . . 26
3.5 Time series of Angola Current transport at 11◦S during 2013-15 . . . 26
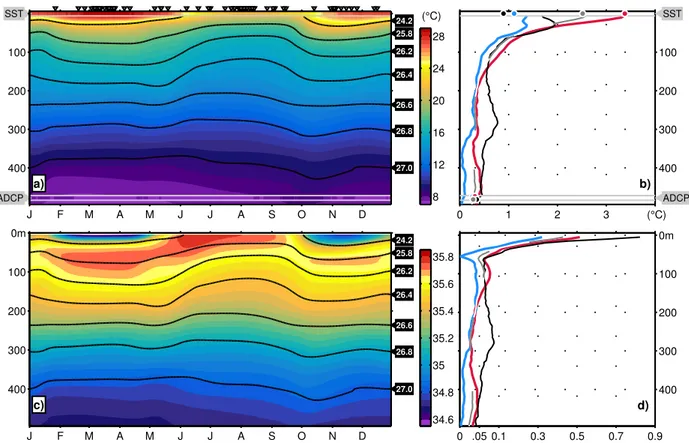
3.6 Seasonal cycle of temperature and salinity at 11◦S . . . 28
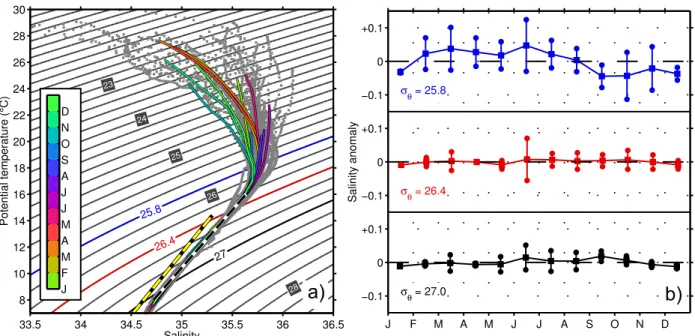
3.7 θ/S diagram at 11◦S . . . 29
3.8 Seasonal cycles of SST and SLA at 11◦S . . . 30
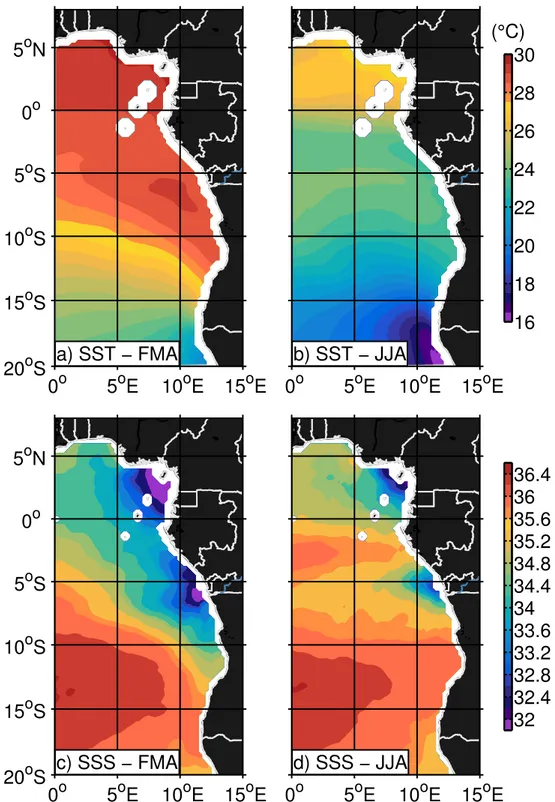
3.9 Observations vs. ocean reanalysis: Thermal structure and AC strength at 11◦S . 32 4.1 SST and SSS off Angola during FMA and JJA . . . 37
4.2 Hovm¨oller diagram of mean seasonal cycle of SLA along equator and off Angola 38 4.3 SST anomaly during Benguela Ni˜no 2011 . . . 39
4.4 Overview of EAF-Nansen data base off Angola . . . 40
4.5 Meridional sections of alongshore velocity off Angola . . . 44
4.6 Comparison of moored and shipboard alongshore velocity at 11◦S-Angola . . . . 45
4.7 Meridional sections of temperature off Angola . . . 46
4.8 Meridional sections of salinity off Angola . . . 46
4.9 Meridional sections of stratification off Angola . . . 47
4.10 Crossshore sections of hydrographic properties off Angola between 10◦S and 12◦S 48 4.11 ABA-Index and interannual subsurface temperature anomalies off Angola . . . . 49
4.12 Subsurface temperature anomalies from Argo profiles during warm and cold peri- ods off Angola . . . 50
5.1 Time series of zonal velocity at 23◦W-Equator during 2004-15 . . . 58
5.2 Vertical structure functions of the second and fourth baroclinic mode . . . 60
5.3 Seasonal cycle of EUC transport at 23◦W, 10◦W, and 0◦ . . . 61
5.4 Annual cycle of zonal velocity 23◦W-Equator . . . 63
5.5 Frequency and baroclinic mode spectra of zonal velocity from 23◦W-Equator . . 64
5.6 Amplitude and phase patterns of the second and fourth baroclinic mode in TRATL01 66 5.7 Basin mode resonance as function of frequency . . . 67
5.8 Amplitude and phase patterns of the second and fourth baroclinic mode from reduced gravity simulations for a square basin . . . 68
5.9 Amplitude and phase patterns of the second and fourth baroclinic mode from reduced gravity simulations for a realistic coastline domain . . . 69
5.10 Amplitude and phase patterns of the second and fourth baroclinic mode from reduced gravity simulations for a realistic coastline domain and spatially varying wind forcing . . . 70
5.11 Seasonal cycle of EUC transport . . . 72
5.12 Monthly mean EUC transport profiles at various longitudes . . . 73
5.13 Seasonal cycle of EUC properties . . . 75
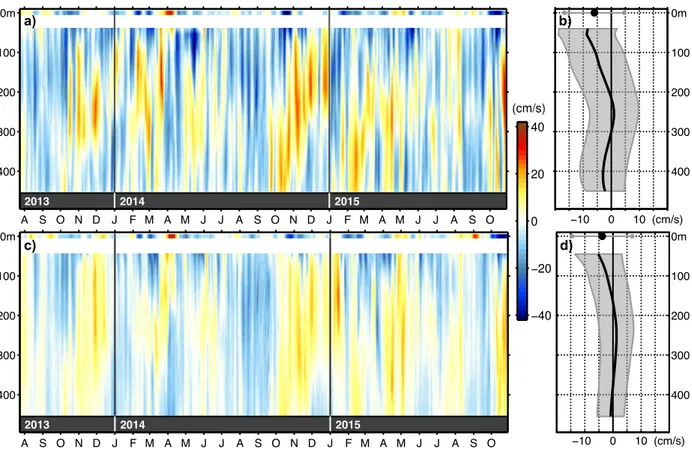
6.1 Time series of alongshore velocity at 11◦S-Angola during 2013-16 . . . 82
6.2 Moored velocity data availability at 35◦W-Equator, 23◦W-Equator, and 11◦S- Angola . . . 83
6.3 Modal decompostion of zonal velocity at 35◦W-Equator and 23◦W-Equator . . 85
6.4 Gravity wave speed optimization . . . 87
6.5 Frequency spectra of zonal and alongshore velocity at 23◦W-Equator and 11◦S- Angola, respectively . . . 90
6.6 Projection coefficients for shallow water simulations . . . 92
6.7 Annual and semiannual cycles of zonal velocity at 35◦W-Equator and 23◦W-Equator 93 6.8 Amplitude structure of annual and semiannual oscillations . . . 95
6.9 Phase structure of annual and semiannual oscillations . . . 96
6.10 Annual and semiannual cycles of alongshore velocity at 11◦S-Angola . . . 98
6.11 Semiannual cycle with amplified fourth baroclinic mode . . . 101
6.12 Semiannual cycle in alongshore velocity at 11◦S-Angola in TRATL01 . . . 103
6.13 Baroclinic mode spectra at 35◦W-Equator and 23◦W-Equator for observations, shallow water model, and TRATL01 . . . 103
6.14 Amplitude structure of annual and semiannual oscillations derived from TRATL01 105 7.1 Seasonal cycle of internal wave energy at 11◦S off Angola . . . 114
7.2 Observations vs. ocean reanalysis: Salinity at 11◦S . . . 115
List of Tables
5.1 Characteristics of baroclinic modes 1-5 . . . 59
6.1 Wind products used for shallow water simulations . . . 86
6.2 Gravity wave speeds for baroclinic modes 1-5 . . . 87
6.3 Projection coefficients for shallow water simulations . . . 92
6.4 Amplitude and phase differences between simulations with equatorial forcing and full forcing at 11◦S-Angola . . . 99
List of Abbreviations
ABFZ Angola-Benguela Frontal Zone
AC Angola Current
ADCP Acoustic Doppler Current Profiler
BC Benguela Current
CTW Coastally Trapped Wave
EBUS Eastern Boundary Upwelling System ESACW Eastern South Atlantic Central Water EKW Equatorial Kelvin Wave
ERW Equatorial Rossby Wave
EUC Equatorial Undercurrent NACW North Atlantic Central Water OGCM Ocean General Circulation Model
PUC Poleward Undercurrent
SACW South Atlantic Central Water
SSS Sea Surface Salinity
SST Sea Surface Temperature
SECC South Equatorial Counter Current SEUC South Equatorial Undercurrent
SLA Sea Level Anomaly
SWM Shallow Water Model
WOCE World Ocean Circulation Experiment
1 Motivation, aim and outline
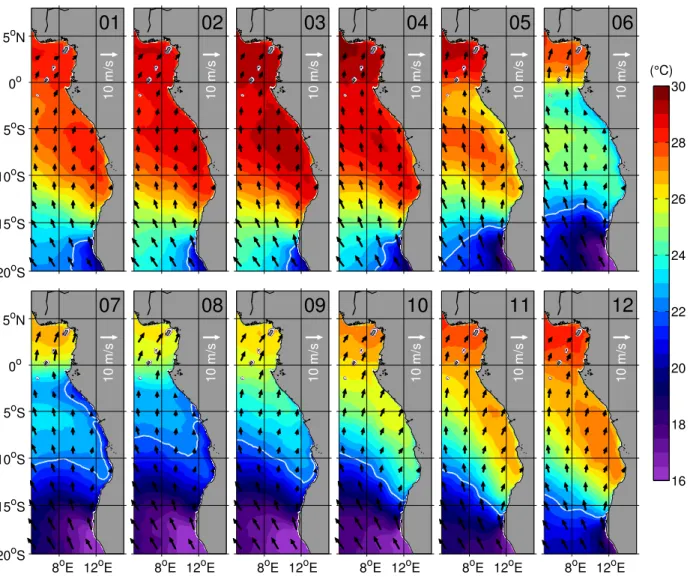
To the north of the Benguela upwelling region - one of the four major Eastern Boundary Upwelling System (EBUS) found in the World Oceans (Carr and Kearns, 2003; Chavez and Messi´e, 2009) - and separated by the Angola-Benguela Frontal Zone (ABFZ) (Shannon et al., 1987; Meeuwis and Lutjeharms,1990; Lass et al.,2000), the tropical Angolan system represents another highly productive marine ecosystem (Ostrowski et al., 2009). Contrary to the major EBUSs, where per- sistent alongshore winds drive quasi-permanent coastal upwelling, winds off Angola are generally weak throughout the year (Figure 1.1, Hellerman (1980)). Nonetheless, seasonal upwelling oc- curs in large parts of Angola’s coastal zone mainly during austral winter (June to August, Figure 1.1), being of tremendous importance for the country’s fishing sector and food security of the coastal population. Previous studies propose that the seasonal conditions on the shelf off Angola are controlled to a large extent by seasonal Coastally Trapped Waves (CTWs) emanating from the equator (Berrit, 1976; Picaut, 1983; Ostrowski et al., 2009). Satellite altimetry data reveal continuous and recurrent poleward propagations of four CTWs per year along the Angolan coast to at least 15◦S (Schouten et al., 2005; Lazar et al., 2006; Ostrowski et al., 2009; Rouault, 2012). Passing times of the first set of one downwelling (March/April) followed by one upwelling (July/August) CTW thereby coincide with the main periods of downwelling and upwelling off the coast of Angola (Ostrowski et al., 2009). The occurrence of a second pair of a downwelling and an upwelling CTW in October and December/January, respectively, is consistent with the idea of a secondary upwelling during December/January (Berrit and Dias,1977), which separates the major downwelling season in March from a secondary downwelling in October.
Ocean circulation in the tropical Angolan system is dominated by the poleward flowing Angola Current (AC). Supplied by the equatorial current system, the AC is assumed to represent a key component in the advection of warm tropical waters towards the northern Benguela, where it converges with the northward flowing Benguela Current (BC) (Peterson and Stramma, 1991;
Wacongne and Piton, 1992; Rouault et al., 2007). Descriptions of the AC exclusively relied on sporadic synoptic observations so far (Moroshkin et al. (1970); Dias (1983a,b); Mohrholz et al. (2001); Mercier et al. (2003), see Section 2.1 for a review), leading to the perception of a continuous poleward current, which is stronger during austral summer and weaker during austral winter. However, a detailed assessment of the current’s mean properties and associated variability is still pending.
Oceanographic conditions and fish-stock distributions off Angola show large variations on a broad range of time scales that can partly be associated with the occurrence of oceanic warm
01
10 m/s
20oS 15oS 10oS 5oS 0o
5oN 02
10 m/s
03
10 m/s
04
10 m/s
05
10 m/s
06
10 m/s
07
10 m/s
8oE 12oE 20oS
15oS 10oS 5oS 0o
5oN 08
10 m/s
8oE 12oE
09
10 m/s
8oE 12oE
10
10 m/s
8oE 12oE
11
10 m/s
8oE 12oE
12
10 m/s
8oE 12oE (°C)
16 18 20 22 24 26 28 30
Figure 1.1: Mean seasonal cycle of SST (contour) and surface wind (arrows) derived for the period 2010- 2016 from MW Fusion OI-SST and ASCAT altimeter data, respectively (both data sets are available athttp:
//www.remss.com). The white contour line corresponds to the 22◦C-isotherm.
events in the region. On interannual time scales these intermittent events are known as Benguela Ni˜nos (Shannon et al., 1986) and often are thought to be induced by a wave response to the remote equatorial forcing in the western equatorial Atlantic (Florenchie et al., 2003; Rouault et al., 2007; L¨ubbecke et al., 2010; Bach`elery et al., 2016). Nonetheless, also local forcing is assumed to modulate the characteristics and strength of these extreme events (Richter et al., 2010). Benguela Ni˜no events are characterized by the poleward intrusion of warm tropical waters into the northern Benguela upwelling region located off Namibia having substantial impact on primary production, fisheries and rainfall rates over adjacent land masses (Gammelsrød et al., 1998; Rouault et al., 2003). In this context, the AC is expected to be a major transport agent for the anomalously strong poleward advection of warm tropical waters (Rouault et al., 2007).
In addition to the intrinsic climate variability, Angola’s coastal zone faces challenges in response to global climate change. Recent studies suggest that particularly EBUSs will be heavily im- pacted by different global warming stressors such as increasing temperatures, acidification, and
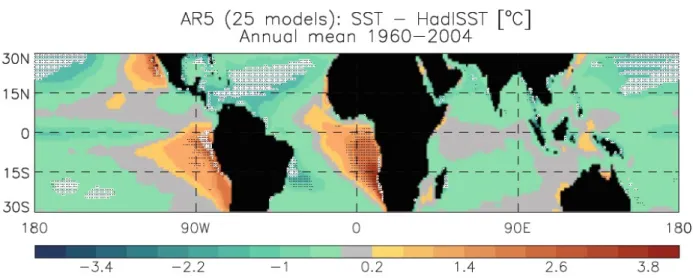
Figure 1.2: Mean SST error in a set of 25 coupled general-circulation models in the CMIP5 (Coupled Model Inter-comparison project 5) ensemble. In areas of white (black) hatching the sign of the error agrees in all (all but one) models (Figure adapted from Toniazzo and Woolnough(2014)).
deoxygenation (Gruber et al.,2011).
Together with the eastern equatorial Atlantic, the Southeast Atlantic Ocean exhibits the strongest Sea Surface Temperature (SST) biases seen in many state-of-the-art climate simu- lations (Figure 1.2,Davey et al.(2002);Richter et al.(2014);Toniazzo and Woolnough(2014)).
For coupled models, primarily deficiencies in the atmospheric component have been proposed as source of the bias (e.g. Huang et al. (2007); Patricola et al. (2012)). Recently it could be shown that a significant bias reduction can be achieved by enhancing the horizontal (Milinski et al., 2016) and simultaneously the vertical (Harlaß et al., 2015) resolution of the atmospheric model component, which results for example in an improved representation of near-coastal winds.
However, even widely-used ocean reanalysis data show large biases in the current structure, hy- drography, and upwelling strength off the coast of Southwest Africa, pointing to systematic errors in the ocean models potentially contributing to the bias problem (Large and Danabasoglu,2006;
Grodsky et al.,2012;Xu et al.,2014). In particular, ocean models tend to have difficulties to rep- resent the sharp thermocline off Angola (Xu et al.,2014) - a problem that usually is accompanied by an erroneous tilt of the equatorial thermocline. Owed to the incorrect thermal structure in the models, too-warm subsurface temperatures are advected southward and subsequently upwelled resulting in too-warm SSTs in the upwelling regions. Furthermore, the representation of the simulated ocean currents off Angola remains rather uncertain as publicly available observational data in the region, which could be used for the validation of the models, are sparse. The model biases in SST off Angola and northern Namibia do not only affect the reliability of future climate projections, but - due to their close spatial resemblance to Benguela Ni˜no events - also hamper the prediction of oceanic warm and cold events in the region (Xu et al., 2014). After all, an improved prediction of these extreme events would be of tremendous importance for the timely activation of suitable adaption strategies carried out by the coastal communities.
Despite the apparent importance of the marine ecosystem off Angola both regionally for the welfare of adjacent countries and globally for example for the improvement of climate change projections, still only little is known about the ocean circulation and hydrographic characteristics in the region. Observational studies off Angola have been restricted to either satellite measurements or synoptic-scale observations taken during sporadic ship surveys. The lack of publicly available observational data thereby has hampered not only the progress in understanding the processes driving the observed variability but also still hinders the evaluation of model biases in the region.
The first goal of this thesis is to provide a detailed description of the eastern boundary circu- lation and hydrography off the coast of Angola. In July 2013, a mooring array was installed on the continental slope near 11◦S. Being part of the array, two current meters have been profiling velocity in the upper 450 m for the last years yielding the first long-term measurements of both advective and wave signals in the boundary current. These data now for the first time facilitate a robust determination of the mean characteristics and associated variability of the AC, also in terms of volume transport and baroclinic structure (Chapter 3).
Furthermore, the thesis is part of the German BMBF-SPACES (Science Partnerships for the Assessment of Complex Earth System Processes, 2012-2018) and European Union PREFACE (En- hancing prediction of Tropical Atlantic climate and its impacts, 2013-2017) programs, that have fostered the cooperation and capacity building efforts with Angolan partner institutes. Within this framework, an extensive in-situ data set of shipboard velocity and hydrography observations was post-processed and quality-controlled in close cooperation with the Angolan partners. The previously not well-explored data set has been acquired within the EAF-Nansen program, that has been funded by the Food and Agricultural Organization of the United Nations (FAO) and executed by the Norwegian Agency for Development Cooperation (NORAD). First results from the analysis of these data are presented as part of this thesis revealing the seasonal cycle of temperature and salinity at 11◦S (Chapter 3) as well as the large-scale structure of currents and hydrography along the Angolan coast (Chapter 4).
In combination with already existing multi-year moored observations of the circulation in the equatorial Atlantic the newly acquired data set of velocity observations at 11◦S also allows the investigation of the role of remote equatorial forcing for the seasonal variability of the eastern boundary circulation. Seasonal variations of the zonal and alongshore velocities at 23◦W-Equator and 11◦S-Angola, respectively, are dominated by annual and semiannual oscillations. In the equatorial Atlantic, these oscillations are associated with basin-mode resonances of the fourth and second baroclinic mode, respectively (Claus et al., 2016). Equatorial basin modes represent low- frequency standing equatorial modes in a zonally bounded basin that are composed of eastward propagating Equatorial Kelvin Waves (EKWs) and westward propagating Equatorial Rossby Waves (ERWs) (Cane and Moore, 1981). Resonances with a forcing at a particular frequency might occur depending on the basin width and the gravity wave speed of the baroclinic mode involved (see also Section 2.3). By exploitation of a top-to-bottom time series of zonal velocity at 23◦W- Equator supported by Shallow Water Model (SWM) simulations, the impact of these resonant
equatorial basin-modes for the seasonal cycle of equatorial Atlantic circulation is investigated (Chapter 5). The off-equatorial lobes of the basin-modes are associated with meridional velocity fluctuations along the eastern boundary presumably also affecting the seasonal variability of the AC. Therefore, the role of these basin-modes and more generally the relative role of the remote equatorial versus the local forcing for the observed seasonality at 11◦S is analyzed by comparing SWM simulations differing in the applied forcing with the acquired observations (Chapter 6).
With this composite of newly acquired and already existing observational data sets at hand, supported by idealized linear wave models, the following main aspects will be addressed in this thesis:
• What are the characteristics of the boundary current flow off Angola locally at 11◦S and along the entire Angolan coastline? (Chapter 3 and Chapter 4)
• How is the seasonal upwelling off Angola reflected in the seasonal cycle of temperature and salinity? (Chapter 3 and Chapter 4)
• What is the importance of basin-mode resonance for the seasonal cycle of the equatorial circulation in the Atlantic? (Chapter 5)
• Given the connection of equatorial and coastal wave-guides, what is the importance of resonant equatorial basin-modes (and remote equatorial forcing in general) for the seasonal cycle of the Angola Current? (Chapter 6)
Chapter 3 through Chapter 6 of this thesis represent individual manuscripts, which either are already peer-reviewed and published in scientific journals, have been submitted and are currently under review for publication, or are in the final stage of preparation for submission. The author of this thesis is either the leading author of the publication (Chapter 3, Chapter 6) or one of the co-authors with significant contributions to the manuscript (Chapter 4, Chapter 5). The current status of each manuscript as well as the detailed contributions of the author to each manuscript are elucidated at the beginning of each chapter. The thesis is complemented by a chapter briefly introducing the scientific background (Chapter 2) and a closing chapter, where a synthesis of the results is presented and an outlook is given (Chapter 7).
2 Scientific background
In the following the scientific background for this study is briefly introduced. Even though winds off Angola are generally weak, present day knowledge shows the large-scale ocean circulation in the region (Section 2.1) being largely consistent with the theory of wind-driven eastern boundary currents (Section 2.2). One major objective of this study is to enhance the understanding of the dynamic response of the boundary current to the remote equatorial forcing, involving propagation of Equatorial Kelvin Waves (EKWs) and Equatorial Rossby Waves (ERWs) as well as Coastally Trapped Waves (CTWs). In this context, the focus will be put on the role of resonant equatorial basin-modes for the seasonal cycle of equatorial Atlantic and eastern boundary circulation off Angola. Therefore, the theoretical background of EKWs and ERWs as well as equatorial basin- modes is briefly given in Section 2.3.
2.1 Ocean circulation and water masses in the tropical Angolan system
The ocean currents off Angola seem to represent a typical eastern boundary circulation sys- tem (Section 2.2) that is dominated by the poleward flowing Angola Current (AC) (Figure 2.1).
The AC is suggested to be supplied by the eastward flow within the equatorial current sys- tem, namely the Equatorial Undercurrent (EUC), the South Equatorial Undercurrent (SEUC), and the South Equatorial Counter Current (SECC) (Peterson and Stramma, 1991; Wacongne and Piton, 1992; Rouault et al., 2007). At about 16◦S the AC converges with the northward flowing Benguela Current (BC), thereby forming a highly variable thermal boundary known as the Angola-Benguela Frontal Zone (ABFZ) (Shannon et al., 1987; Meeuwis and Lutjeharms, 1990). Historically, the velocity structure and transport of the AC had been described exclu- sively based on synoptic hydrographic data (Moroshkin et al., 1970; Dias, 1983a,b; Mercier et al.,2003). These former studies reported subsurface geostrophic southward flow between the surface and 300 to 400 m depth having velocities between 30 cm s−1 and 50 cm s−1 and subsur- face velocities exceeding 50 cm s−1 at times. Southward transports of the AC determined by Dias (1983a) were 1.2 Sv and 3.7 Sv from data collected in September 1970 and July 1971, respectively. However, Mercier et al. (2003) reported an AC transport of 11 Sv from an inverse study making use of World Ocean Circulation Experiment (WOCE) line A13, which was sam- pled during a major Benguela Ni˜no event in January to March 1995 (Gammelsrød et al., 1998).
0o 5oE 10oE 15oE 35oS
30oS 25oS 20oS 15oS 10oS 5oS 0o 5oN
SEUC EUC
GC
AG SECC
AC
BC ABF
ANGOLA
Cuanza Congo
Cape Basin Angola Basin
Figure 2.1: Ocean currents in the Southeast Atlantic Ocean (modified from Rouault et al. (2007)). Main features are the Equatorial Undercurrent (EUC), South Equatorial Undercurrent (SEUC), South Equatorial Counter Current (SECC), Gabon Current (GC), Angola Gyre (AG), Angola Current (AC), and Benguela Cur- rent (BC). The mean position of the Angola-Benguela Frontal Zone (ABFZ) is indicated (see also Figure 3.1a).
During a survey in April 1999 a secondary, off- shore branch of southward subsurface flow was identified in shipboard velocity data separated from the coastal branch (Mohrholz et al.,2001).
Both pathways were characterized by southward velocities of about 40 cm s−1 below the surface.
Based on the available synoptic snapshots, the general perception of the AC is that of a continu- ous poleward current which is stronger in austral summer and weaker in austral winter and plays a key role in the anomalously strong southward ad- vection of tropical waters during Benguela Ni˜no events. Yet, the AC has remained rather un- explored, as a solid description of the current’s mean properties and variability has not been fea- sible with the available data to date.
Off Angola, one of the most pronounced oxy- gen minimum zones of the global ocean is found below the productive surface layer. Mainly dur- ing austral summer the AC appears to be a key element for the southward spreading of warm, saline, low-oxygen South Atlantic Central Water (SACW) within the upper thermocline. SACW originally is formed in the subtropical conver- gence of the Brazil-Malvinas Confluence Zone (Poole and Tomczak, 1999). It enters the trop- ical Southeast Atlantic Ocean via the equato- rial current system, after being advected through the South Atlantic subtropical gyre. During this journey, SACW properties are constantly altered by continuous remineralization of organic mat- ter causing oxygen depletion and nutrient enrich- ment plus weak entrainment of North Atlantic
Central Water (NACW) within the equatorial current system (Poole and Tomczak,1999). After all these en route modifications an oxygen-poor subtype of SACW with an approximated pseudo- age of 50 years resides in the Angola Gyre (Mohrholz et al.,2008) that finally is advected poleward towards the northern Benguela by the Angola Current. With Eastern South Atlantic Central Wa- ter (ESACW) another central water subtype is present in the vicinity of the ABFZ. ESACW is formed in the Cape Basin representing a mixture of SACW from the subtropical gyre and Indian
Theory of eastern boundary circulation
Central Water that is transferred to the South Atlantic by the Agulhas Current (Mohrholz et al., 2008). From its source region ESACW, which is richer in oxygen than SACW, is transported northward along the Southwest African shelf by the BC. Particularly for the frontal region, the water mass composition, consisting of a mixture of SACW and ESACW, is crucial for the oxygen balance over the shelf (Mohrholz et al., 2008) and strongly depends on the relative strength of the AC and BC.
2.2 Theory of eastern boundary circulation
A number of studies have addressed the theory of wind-driven eastern boundary flows, using numerical or analytical models (Hurlburt and Thompson, 1973; Anderson and Gill, 1975; Mc- Creary,1981a;Suginohara and Kitamura,1984;Philander and Yoon,1982;Yoon and Philander, 1982; McCreary and Chao, 1985; Fennel, 1999). According to Philander and Yoon (1982), the response of an inviscid coastal ocean to the sudden onset of a spatially homogeneous alongshore (equatorward) wind can be divided in three phases:
1. Immediately after the onset of the alongshore wind, an accelerating equatorward coastally trapped jet develops inside the wind band. During this phase the flow is two-dimensional, i.e. no alongshore variations are found. Thus, the offshore Ekman transport associated with the coastal current has to be balanced by coastal upwelling.
2. With the onset of the wind, CTWs were initially excited at the equatorward end of the forced region. Propagating poleward, these waves induce alongshore variations in the flow.
After the time period the waves need to reach a certain location within the forced area the acceleration of the coastal jet is stopped at this particular spot, as the wind stress is now balanced by an alongshore pressure gradient. Furthermore, the CTWs introduce a Poleward Undercurrent (PUC) since the vertical structure of the waves differs from that of the surface jet. Another effect of the waves is the reduction of the intensity of the coastal upwelling. In a one-level model, upwelling ceases completely. In an N-layer model in which the Coriolis parameter f is constant, the passage of each baroclinic mode CTW would reduce the upwelling until upwelling has stopped after the the Nth mode has passed (Philander and Yoon,1982). Also, each of the baroclinic modes would modulate the vertical structure of the coastal jet and the PUC. However, since the upwelling has stopped, the Ekman rectification flow supplies the PUC after the passage of the CTWs. Only temporal variations of the wind field can excite new upwelling events (Fennel, 1999). In reality, the established balance might also be disturbed by the passage of remotely forced waves (Strub et al., 2013) or coastline irregularities that generate CTWs in a similar manner as alongshore wind variations (Cr´epon et al.,1984).
3. Considering the spherical shape of the Earth, the response is modified by the β-effect,
i.e. the variation of the Coriolis parameter f with latitude. The final phase to establish equilibrium conditions is then associated with the dispersion of the coastal jet into Rossby waves (Anderson and Gill, 1975). Equilibrium conditions are found in the wake of the Rossby waves, which in the case of an inviscid shallow water model forced by uniform alongshore winds would result in no motion at all.
The response of the coastal ocean as described above has to be considered oversimplified. As an example, frictional effects are not taken into account. Steady coastal upwelling is only possible for nonzero friction (Fennel, 1999), which limits the propagation distance of the CTWs particularly for higher baroclinic modes. In addition, by considering spatial and temporal variations of the wind field, the response of the coastal ocean becomes more complex. For example, the existence of a wind stress curl (as introduced by spatial variations of the wind stress) alters the coastal circulation and upwelling strength (Hurlburt and Thompson, 1973; McCreary and Chao, 1985).
Contrary to the coastal upwelling, curl-driven upwelling is not affected by CTW propagation, and thus provides a mechanism that is able to maintain upwelling independent of the wave response at the coast.
However, as winds are rather weak off Angola, it seems likely that the response to the local wind as described above is very sensitive to external disturbances like the passage of remotely forced waves. Previous studies have indeed noted that the seasonal conditions on the shelf off Angola appear to be controlled to large extent by remotely forced waves emanating from the equator (Ostrowski et al., 2009; Rouault, 2012). Furthermore, intermittent oceanic warm events in the region occurring on interannual time scales have often been explained with a wave response to anomalous wind forcing in the western equatorial Atlantic (e.g. Florenchie et al. (2003);Rouault et al. (2007); L¨ubbecke et al. (2010); Bach`elery et al. (2016)).
2.3 Theory of long equatorial waves and basin mode resonance
It is well-known that the tropical thermocline provides a wave-guide for several types of large- scale ocean waves (e.g. Gill (1982)), causing disturbances to remain trapped in the vicinity of the equator. The existence of this wave-guide is owed to the strong mean vertical stratification in the tropical oceans and in particular to the vanishing Coriolis force directly at 0◦, which leads to the equator acting like a natural boundary analogously to topographic boundaries for coastally trapped waves.
The best-known examples of long equatorial waves are eastward propagating EKWs and west- ward propagating ERWs that are excited by wind stress variations over the equatorial ocean and can cause thermocline displacements and Sea Surface Temperature (SST) anomalies along their propagation path. Thermocline displacements are thereby mirrored by Sea Level Anomaly (SLA)
Theory of long equatorial waves and basin mode resonance
(at least for the low baroclinic modes), offering opportunities to track propagating waves from space.
In order to introduce equatorial wave dynamics in the simplest possible context usually linear Shallow Water Models (SWMs) are employed (e.g. Matsuno (1966); Wunsch and Gill (1976);
Gill (1982);Pedlosky (1987);Philander (1990);Holton (2004)). In these models a shallow layer of relatively warm (and therefore less dense) water overlies a motionless much deeper layer of cold water. The interface between both layers represents the sharp and shallow tropical thermocline.
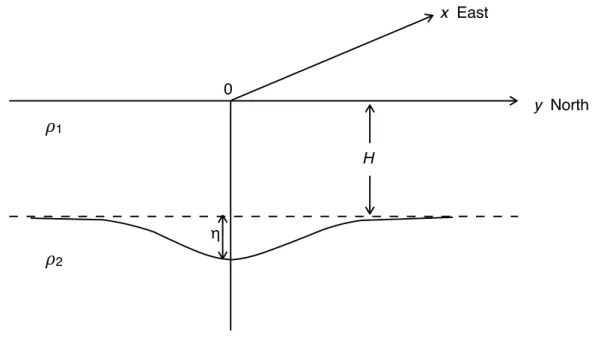
Linear hydrostatic motion in the upper layer is forced by the wind stress τs, which acts on the upper layer as a body force. This motion is associated with a vertical displacement of the interface η. To account for the special case of the Coriolis parameter vanishing at the equator, the equatorialβ-plane approximation is used (e.g. Gill (1982)). Therefore, the Coriolis parameter f in the momentum equations is replaced by βy, with β= 2.3×10⁻¹¹m−1s−1 representing the meridional gradient of f in the vicinity of the equator. In a Cartesian coordinate system (see Figure 2.2) considering free wave solutions (i.e. neglecting forcing and dissipation), the shallow water equations on the equatorial β-plane are given by (see Section 6.3.1 for the equations in spherical coordinates):
∂u
∂t −βyv =−g0∂η
∂x (2.1a)
∂v
∂t +βyu =−g0∂η
∂y (2.1b)
g0∂η
∂t +c2 ∂u
∂x +∂v
∂y
= 0 (2.1c)
where u and v are the zonal and meridional velocity components, respectively, and c = √ g0H represents the gravity wave speed. Because of the stratification, the gravitational acceleration g is effectively reduced to g0 = ρ2ρ−ρ1
1 g in Equations (2.1).
From Equations (2.1) a single equation for the meridional velocity component v can be ob- tained:
∂
∂t ∂2v
∂x2 +∂2v
∂y2
+β∂v
∂x − 1 c2
∂3v
∂t3 −f2 c2
∂v
∂t = 0 (2.2)
Waves solutions of the form
v =V(y) exp(ikx−iωt) (2.3)
where k = 2π/λ and ω represent zonal wave number and angular frequency, respectively, can be derived by substituting Equation (2.3) into Equation (2.2) yielding the ordinary differential equation
d2V dy2 +
ω2
c2 −k2− βk
ω − β2y2 c2
V = 0 (2.4)
When considering equatorially trapped waves a boundary condition is introduced, forcing the solutions to decay for large values of |y| (Matsuno, 1966) , i.e.
V →0 as y → ±∞ (2.5)
x East
y North
!1
0
H
η
!2
Figure 2.2: A sketch of the shallow water model in the Cartesian coordinate system (adapted from Philander (1990).
The meridional extent of the solutions is in fact defined by the equatorial Rossby radius of deformation given by
Req = rc
β (2.6)
Equation (2.4) together with the boundary condition of Equation (2.5) poses an eigenvalue problem, analogously to Schr¨odingers equation for a simple harmonic oscillator. The boundary condition is satisfied only for certain discrete values of the meridional wave numbern, which leads to the dispersion relation for equatorially trapped waves:
c β
ω2
c2 −k2− βk ω
= 2n+ 1 (2.7)
This dispersion relation permits the description of several types of equatorial waves, including:
• Gravity-inertial or Poincar´e waves (n= 1, 2, 3, ...)
• Rossby waves (n= 1, 2, 3, ...)
• Rossby-gravity or Yanai wave (n = 0)
• Kelvin wave (n =−1)
In the following the dispersion relation (Equation (2.7)) is explored for EKWs and ERWs (Figure 2.3).
Theory of long equatorial waves and basin mode resonance
−1.5 −1 −0.5 0 0.5 1
x 10
−30 0.005 0.01 0.015 0.02 0.025 0.03 0.035 0.04
ROSSBY
KELVIN
−(4/3)*L 4*L
Zonal Wave Number (km
−1)
Frequency (days
−1)
−10 −20 −L L 20 10
365 182 100 50 30
Period (days)
Wavelength ( ° long.)
Mode 1 Mode 2 Mode 3 Mode 4 Mode 5
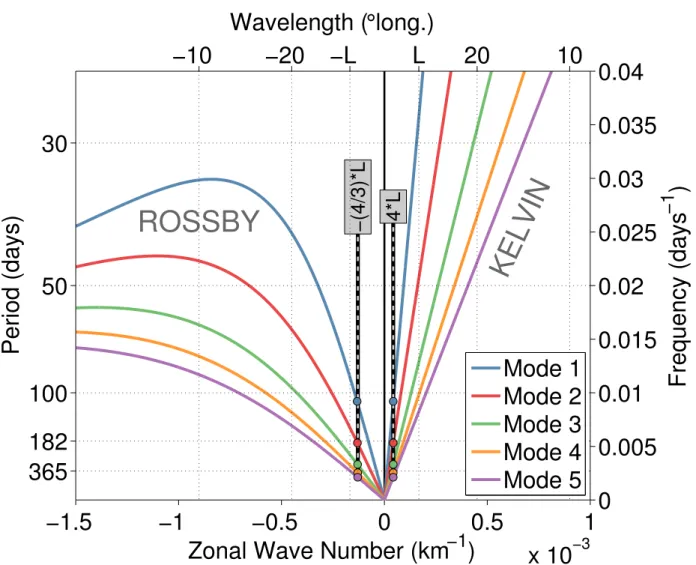
Figure 2.3:Dispersion diagram of equatorially trapped Kelvin and Rossby waves for the first five baroclinic modes (being a function of c in Equation (2.7)), first meridional mode for Rossby waves (n = 1 in Equation (2.7)).
Positive and negative wave numbers indicate eastward and westward propagation, respectively. Lmarks the basin width of the equatorial Atlantic corresponding to 52.8◦∼5.8×10⁶m. Colored dots indicate the wave numbers associated with resonance periods of the corresponding baroclinic mode in the equatorial Atlantic Ocean.
2.3.1 Equatorial Kelvin waves
EKWs represent a special case of the wave solutions, in which the meridional velocity vanishes everywhere. It is the trivial solution of Equation (2.4) forV = 0. For the Kelvin wave, represented by n=−1, the dispersion relation (Equation (2.7)) reduces to
ω=ck (2.8)
Thus, EKWs are non-dispersive propagating waves with constant phase speed corresponding to the gravity wave speed of a particular baroclinic mode (Figure 2.3). Only eastward propagating waves are trapped in the equatorial wave-guide by the Coriolis force, while westward propagation is ruled out as the solution is unbounded at large values of y. Note also the analogy to coastally trapped Kelvin waves, i.e. phase speed equal to gravity wave speed, absence of transverse flow, and decay over a deformation radius.
2.3.2 Equatorial Rossby waves
For low frequencies, ω2/c2 can be neglected in Equation (2.7) to obtain
ω =− βk
k2 + (2n+ 1)β/c (2.9)
This relationship represents ERWs, characterized by westward phase propagation (Figure 2.3).
The frequency has a maximum at kmax = √
2n+ 1/p
c/β = √
2n+ 1/Req, permitting a dis- tinction betweenlong (k kmax) and short (k kmax) ERWs. For long ERWs, group velocity (∂ω/∂k) is also westward, while for short ERWs the group velocity is eastward.
Furthermore, for long ERWs the approximation ω=− βk
(2n+ 1)β/c (2.10)
is valid, making these waves basically non-dispersive for the wave number range considered.
Consequently, their group velocity is given by
cgr =− c
2n+ 1 (2.11)
Thus, the propagation speed of a long ERW of the first meridional mode is three times slower than that of the corresponding EKW.
2.3.3 Equatorial basin modes
In a zonally bounded basin, equatorial wave propagation and reflection at the zonal boundaries can form standing modes under certain conditions. The modes involve eastward propagating EKWs and westward propagating ERWs and are known as equatorial basin-modes. Equatorial basin-modes have first been analytically discussed for both inviscid dynamics and in the presence of Rayleigh friction by Cane and Moore (1981). In the inviscid analytical solution a singularity is found in the centre of the basin due to focussing of the ERWs as a result of beta dispersion (Schopf et al.,1981). This effect is reduced when considering Rayleigh damping in the analytical solution. In the context of a SWM, Rossby wave focusing can be prevented by introducing lateral diffusion and/or mean flow, making solutions more realistic in comparison to observations (Greatbatch et al., 2012; Claus et al., 2014).
The characteristic oscillation period of the gravest basin-mode associated with a particular baroclinic mode (colored dots in Figure 2.3) is set by the time it takes both waves to cross the basin and is given by
T = 4L
c (2.12)
where L represents the basin width and c is the gravity-wave speed of the baroclinic mode con- sidered. According to Figure 2.3, the corresponding wave lengths of EKWs and ERWs associated with the basin-mode frequencies are set by the basin width, independent of the baroclinic mode.
Theory of long equatorial waves and basin mode resonance
The equatorial basin in the Atlantic Ocean has a zonal width of ∼ 52.8◦. The wave length of the EKWs and ERWs associated with the gravest basin-modes are approximately 210◦ and 70◦, respectively. Therefore, the equatorial basin width L corresponds to about one quarter of the Kelvin wave length and three quarters of the Rossby wave length (Figure 2.3), reflecting the differences in propagation speed between EKWs and ERWs.
Depending on the combination of basin width and wave speed, resonances with a forcing at a particular frequency can occur, which can lead to substantial basin-mode oscillations even though the forcing at this frequency might be weak.
As the previous sections showed, the underlying dynamics of the involved long equatorial waves are linear and a basin-mode can therefore be excited in a linear SWM representing a single baroclinic mode. An oscillatory forcing in the zonal momentum equations is thereby capable of generating the required waves. In this study SWM simulations representing various baroclinic modes are used to study the impact of the basin-modes on the seasonal cycles of both the equatorial Atlantic circulation and the boundary circulation off Angola (Chapter 5 and Chapter 6, respectively).
3 The Angola Current: Flow and hydrographic characteristics as observed at 11 ◦ S
The eastern boundary circulation off the coast of Angola has been only sparsely described in the past based on sporadic synoptic-scale measurements. In this chapter the first long-term direct velocity observations of the Angola Current obtained near 11◦S are presented, giving insights in its mean properties and variability. In combination with available shipboard velocity sections an Angola Current transport estimate is derived. Furthermore, an extensive set of shipboard hydrographic observations supplemented by autonomous glider observations allows the determination of the seasonal cycle of temperature and salinity at the shelf break off Angola. The acquired observational data is used for a first assessment of several ocean reanalysis products in terms of current strength and thermal structure off Angola.
The manuscript was published in Journal of Geophysical Research: Oceans in February 2017.
Citation: Kopte, R., P. Brandt, M. Dengler, P. C. M. Tchipalanga, M. Macu´eria, and M. Ostrowski (2017), The Angola Current: Flow and hydrographic characteristics as observed at 11◦S, J. Geophys. Res. Oceans, 122, 1177–1189, doi:10.1002/2016JC012374.
The candidate designed the study and carried out the analysis of both mooring and shipboard data sets as well as of several reanalysis products. He produced all figures and authored the manuscript from the first draft to the final version.
3.1 Introduction
North of the Benguela upwelling region - one of the world’s four major Eastern Boundary Upwelling Systems (Benguela-Canaries-Humboldt-California, e.g., Carr and Kearns (2003); Chavez and Messi´e (2009)) - the tropical Angolan system represents another highly-productive ecosystem (Ostrowski et al., 2009). Located en route from the equatorial Atlantic, the region off Angola thereby serves as the gateway for communicating equatorial oceanic variability to the northern Benguela, mainly via poleward propagation of coastally trapped waves (CTWs). At about 16◦S the Angola-Benguela Front (ABF) represents a sharp, yet highly variable thermal front, separating at the surface tropical, oligotrophic waters in the north from cold waters,enriched in nutrients by upwelling in the south (Mohrholz et al., 2008). Fluctuations in position and strength of the frontal system range from subseasonal (Kostianoy and Lutjeharms,1999;Mohrholz et al.,2001), via annual (Meeuwis and Lutjeharms, 1990), to interannual time scales. The latter are often associated with severe warm events during austral summer being referred to as Benguela Ni˜nos (Shannon et al., 1986). Most of the observed interannual variability is induced by wave response via equatorial Kelvin waves and CTWs to the remote equatorial forcing (Bach`elery et al., 2016;
Florenchie et al.,2003;L¨ubbecke et al.,2010;Rouault et al.,2007), yet modulated by local wind forcing (Bach`elery et al.,2016;Richter et al.,2010). Anomalous oceanic conditions in the region have been found to substantially impact precipitation variability over adjacent countries (Rouault et al., 2003) as well as the marine ecosystem and local fisheries (Gammelsrød et al., 1998).
Within the tropical Angolan system, the Angola Current (AC) is one key element in the poleward advection of warm tropical waters. It is suggested to be fed by eastward equatorial currents, namely the Equatorial Undercurrent, the South Equatorial Undercurrent, and the South Equatorial Counter Current, as well as the Gabon Current (Figure 3.1a) (Peterson and Stramma, 1991;
Rouault et al., 2007; Wacongne and Piton, 1992). Its variability in strength is found to be partly controlled by the passage of CTWs (Ostrowski et al., 2009; Rouault, 2012). The large- scale properties of the AC have been described exclusively based on synoptic measurements so far. Subsurface southward geostrophic velocities exceeding 50 cm s−1 were reported along the Angolan coast between 9◦S and 16◦S during a hydrographic survey in 1968 with southward velocities extending from the surface down to 250–300 m depth (Moroshkin et al.,1970). Current velocities were measured at 12◦S on four occasions between September 1970 and July 1971 (Dias, 1983a,b). In March 1971 southward flow was found to be stronger compared to July 1971: 50 cm s−1 versus 42 cm s−1 at the surface, 70 cm s−1 versus 33 cm s−1 at 100 m depth, respectively. Southward transports above 400 m depth were calculated in the range of 1.2–3.7 Sv between September 1970 and July 1971 (Dias, 1983a). However, results of an inverse model study making use of WOCE line A13, which was sampled during a major Benguela Ni˜no event between January and March 1995 (Gammelsrød et al., 1998), suggest a southward transport of 11 Sv of the AC within surface and thermocline layers (Mercier et al., 2003). During a survey in April 1999 a secondary, offshore branch of southward subsurface flow was identified in shipboard
Introduction
0o 5oE 10oE 15oE 35oS
30oS 25oS 20oS 15oS 10oS 5oS 0o 5oN
20 km
60 km
100 km
1200 m
500 m
800 m 200 m
40’ 13oE 20’ 40’ 14oE
20’
11oS
40’
20’
10oS
SEUC EUC
GC
AG SECC
AC
BC
a)
b)
ABF
ANGOLA
Cuanza Congo
Figure 3.1: (a) Schematic circulation in the Southeast Atlantic Ocean (modified fromRouault et al. (2007)).
Main features are the Equatorial Undercurrent (EUC), South Equatorial Undercurrent (SEUC), South Equatorial Counter Current (SECC), Gabon Current (GC), Angola Gyre (AG), Angola Current (AC), and Benguela Current (BC). The mean position of the Angola-Benguela Front (ABF) is indicated. (b) Enlargement of the study area indicating the positions of ADCP mooring (red star) and ADCP shield (red square) as well as the∼11◦S section (solid red line, white dots represent along-section distance to the coast (km)). Gray dots represent positions of all hydrographic profiles used in this study. Bathymetry is extracted from ETOPO2, with black lines representing individual isobaths.
velocity data separated from the coastal branch (Mohrholz et al., 2001). Both pathways were characterized by southward velocities of about 40 cm s−1 below the surface. However, below 150 m depth northward currents of 15–20 cm s−1 were observed in the coastal branch. Based on the available synoptic snapshots, the general perception of the AC is that of a continuous poleward current which is stronger in austral summer and weaker in austral winter. During Benguela Ni˜nos the AC appears to be a major agent in advecting warm tropical waters poleward into the northern Benguela (Gammelsrød et al., 1998; Rouault et al., 2007).
Along with the eastern equatorial Atlantic, the Southeast Atlantic Ocean and particularly the ABF region is subject to the strongest sea surface temperature (SST) biases seen in many state- of-the-art coupled climate simulations (Davey et al., 2002; Richter et al., 2014). A common indicator of the bias is an erroneous tilt of the equatorial thermocline associated with reduced zonal winds, nonetheless the origin of the bias remains highly controversial. Mainly deficiencies
in the atmosphere models have been proposed as source of the bias, such as a misrepresentation of convection over the Amazon and West Africa (Richter and Xie, 2008), erroneous localized Bjerknes feedback in the Gulf of Guinea (Patricola et al., 2012), or errors in radiation and low clouds over the upwelling regions (Huang et al.,2007). It could be shown that a reduction of the bias is possible particularly by improving the near-coastal winds when enhancing simultaneously the horizontal and vertical resolution of the atmospheric model in coupled simulations (Harlaß et al., 2015). However, also systematic errors in ocean models potentially contribute to the bias problem (Grodsky et al.,2012;Large and Danabasoglu,2006; Xu et al.,2014). In particular, the representation of the AC and the tropical Angolan system in ocean models as well as reanalysis products have been identified to cause biases in the Southeast Atlantic (Xu et al.,2014). First, based on comparisons with a reference reanalysis product, usually an overshooting of the AC is observed near the ABF causing a southward shift of the front and thus introducing a strong warm SST bias. Second, ocean models tend to have difficulties to simulate the sharp thermocline off Angola, which results in too-warm subsurface temperatures being advected southward into the northern Benguela by a deep continuation of the AC and subsequently upwelled to manifest in too-warm SSTs. In this context the need for in situ ocean observations to validate both AC strength and thermal structure off Angola in ocean models and reanalysis data has been emphasized.
For the first time, moored observations of the boundary circulation at ∼11◦S off the coast of Angola are available between July 2013 and October 2015. They give insight into the mean state and variability of the AC. Furthermore, based on an extensive set of hydrographic measurements from shipboard and autonomous glider measurements covering the period from 1968 to 2015, the seasonality of hydrographic properties at the eastern boundary off Angola is investigated.
Finally, the observed thermal structure and alongshore velocities are used to qualitatively assess the performance of various reanalysis products in the boundary current system off Angola.
3.2 Data and Methods
3.2.1 Mooring Data
Multiyear velocity measurements were obtained by a mooring array deployed at ∼11◦S off the coast of Angola for the period from July 2013 to October 2015 (Figure 3.1b). A bottom shield equipped with a 75 kHz Teledyne RDI’s Workhorse Long Ranger ADCP, which was sampling every 2.5 min, was located at 500 m water depth (13◦11.0’E, 10◦42.7’S, 53 km offshore, red square in Figure 3.1b), accompanied by a mooring sitting on the 1200 m isobath (13◦00’E, 10◦50.0’S, 77 km offshore, red star in Figure 3.1b) with another 75 kHz Long Ranger ADCP being installed at 500 m depth and sampling every hour. Both upward-looking instruments measured the current speed in the overlying water-column up to about 45 m below the sea surface. During data processing, a 40 h low pass filter was applied to hourly-interpolated current data to eliminate tidal currents
Data and Methods
followed by a subsampling of the detided data to 12 hourly resolution. The local orientation of the shelf break (−34◦) was used for the calculation of the alongshore component of the flow.
Additionally, temperature time series were recorded at the instrument depths.
3.2.2 Shipboard and Autonomous Glider Data
Since 1983, an extensive oceanographic data set from repeated ship surveys carried out in Angolan territorial waters has been acquired within the EAF-Nansen program executed by the Food and Agriculture Organization of the United Nations (FAO) and funded by Norwegian Agency for Development Cooperation (NORAD). Semiannual cruises (austral summer versus austral winter) have been carried out by R/V Dr. Fridtjof Nansen on a regular basis since 1995, collecting data to estimate the abundance and map the distribution of the main commercially important fish species, to perform biogeochemical measurements and to collect hydrographic data. Since 2005, shipboard ADCP measurements from a 150 kHz Teledyne RDI Ocean Surveyor are available.
Recently, shipboard CTD measurements and upper ocean velocities recorded by a 75 kHz Teledyne RDI Ocean Surveyor were collected along a section perpendicular to the topography (red line in Figure 3.1b, hereinafter referred to as ”∼11◦S section”) during R/V Meteor cruises M98 in July 2013 and M120 in October 2015, when the moorings described in Section 3.2.1 were deployed and serviced, respectively.
Shipboard Current Measurements
From the two data sets described above, we use a total number of 13 upper ocean velocity sections. Eleven sections were acquired within the EAF-Nansen program on a monitoring line perpendicular to the topography near 12◦S (sampling times: March 2007, March 2008, June 2008, March 2009, June 2009, March 2010, July 2010, March 2011, August 2011, February 2014, July 2014), another two stem from samplings of the ∼11◦S section by R/V Meteor (sampling times:
July 2013, October 2015).
Hydrographic Measurements
A total number of 707 temperature/salinity profiles sampled on the Angolan shelf break within 200 and 800 m water depth between 11.5◦S and 10◦S is used (grey dots in Figure 3.1b), incorporating 644 profiles obtained within the EAF-Nansen program between 1991 and 2015, as well as eight profiles collected during the two R/V Meteor cruises in 2013 and 2015. The majority of these profiles were obtained during March/April, July/August, and October. In particular these data sets do not provide hydrographic information for the December/January period. In order to improve the seasonal coverage, additional historic data were incorporated into the analysis: 52 temperature/salinity profiles were extracted from the input data set for the MIMOC climatology (Schmidtko et al., 2013), originating mainly from the 1980s but as early as 1968; one profile