The Angola Current
and its seasonal variability as observed at 11°S
Robert Kopte
[1], Peter Brandt
[1,2], Marcus Dengler
[1], Martin Claus
[1], Richard J. Greatbatch
[1,2][1] GEOMAR Helmholtz Centre for Ocean Research Kiel, Germany
[2] Kiel University, Kiel, Germany
EGU General Assembly 2016 Vienna, Austria
April 18, 2016
0o 5oE 1 0oE 1 5oE 3 0oS
2 5oS 2 0oS 1 5oS 1 0oS 5oS 0o
A N G O L A
N A M IB IA
EUC SEUC
GC
SECC AD
BC
AC
ABF
ABA region
11°S array
The Angola Current and its seasonal variability at 11°S
The Angola Current (AC) within the southeastern Atlantic upwelling region
adapted from
Rouault et al., 2007
▶ Key component for the upwelling region as the connecting element with the
tropical Atlantic
What drives the variability?
▶ Remotely generated coastal Kelvin waves
▶ Locally generated coastal Kelvin waves
▶ Advective processes?
Interannual SST variability in the upwelling region
Benguela Niño
Benguela Niña
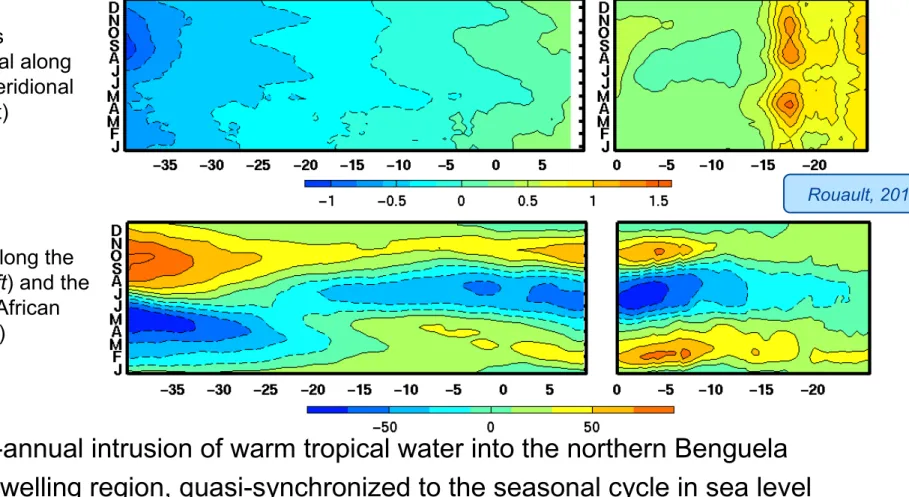
Figure S4:Annual cycle of wind stress (top) and SLA (bottom) along
the equator (left) and along the Southern African coast (right); Hovmoller plot of 1999-2009 weekly mean climatology of: top: QuikScat wind stress (zonal component
SLA (cm) along the equator (left) and the southwest African coast (right)
Wind stress
[N/m2] (zonal along equator, meridional along coast)
The Angola Current and its seasonal variability at 11°S
▶ Bi-annual intrusion of warm tropical water into the northern Benguela upwelling region, quasi-synchronized to the seasonal cycle in sea level anomaly (SLA)
Rouault, 2012
▶ What is the associated variability of the Angola Current?
Remotely forced semi-annual waves
The Angola Current and its seasonal variability at 11°S
Historic observations of the Angola Current
▶ Hydrographic survey to enhance understanding of the circulation in the Southeast Atlantic Ocean in 1968
▶ Name change from “South Current” to “Angola Current”
20 m depth 150 m depth
(cm/s)
Based on geostrophic circulation in various depth layers:
▶ Maximum velocities >50 cm/s below the surface (9°S – 16°S)
▶ Vertical extent to 250-300m depth
Moroshkin et al., 1968
The Angola Current and its seasonal variability at 11°S
Meteor cruises M98 and M120
▶ Snapshots of alongshore velocity and hydrography on several sections along the pathway of the Angola Current
▶ Mooring array installation / maintenance
▶ High temporal variability of the alongshore flow
1 2 . 8 °E 1 3 °E 1 3 . 2°E 1 3 . 4°E
0 − 5
0 5
5 5 2 5 . 7
2 6 . 4
2 6 . 8
2 7 . 1
0 m
1 0 0
2 0 0
3 0 0
4 0 0
5 0 0
6 0 0
1 2 . 8 °E 1 3°E 1 3 . 2°E 1 3 . 4°E
− 2 5 − 1 5 − 5
0
0
5 1 5
1 5 2 5
2 4 . 5 2 5 . 7
2 6 . 4
2 6 . 8
2 7 . 1
( c m / s )
− 2 5
− 2 0
− 1 5
− 1 0
− 5 0 5 1 0 1 5 2 0 2 5
ADCP shield Flotec ADCP
11°S M120 10 / 2015 11°S
M98
07 / 2013
Alongshore flow
(cm/s)
First moored observations of the Angola Current
KPO_1107 KPO_1106
▶ Weak mean southward flow of 5-8 cm/s at 50 m depth
▶ Mean southward current extends to about 200 m depth Geostrophic velocities derived from AVISO dynamic heights
inshore offshoreAlongshore flow
▶ Pronounced intra-seasonal to seasonal variability, slightly stronger on the inshore mooring position
The Angola Current and its seasonal variability at 11°S
Transport estimate of the Angola Current
Method
▶ Derive patterns of variability from ship sections and / or model output (following Brandt et al. 2014)
▶ Regress main patterns on mooring time series to reconstruct 3D flow field
▶ Integrate velocities within a box representing the mean limits of the Angola Current
Ship sections OGCM
Mean transport (Sv)
-0.28 -0.39
Standard dev. (Sv)
0.51 0.66
The Angola Current and its seasonal variability at 11°S
Intra-seasonal to seasonal variability
▶ Dominance of 120-day, semi- annual, and annual oscillations
▶ Longer periods show more
baroclinic structures offshore inshore
The Angola Current and its seasonal variability at 11°S
Influence of resonant equatorial basin modes?
Zonal velocity – 182-day – Baroclinic mode 2
cm/s
Meridional velocity – 182-day – Baroclinic mode 2
cm/s
Kelvin wave Rossby wave
▶ Equatorial basin modes: Low-frequency standing equatorial modes (Cane and Moore, 1981)
▶ 365-day, 182-day, and 120-day periods are close to resonance periods of baroclinic mode 4, 2, and 1
The Angola Current and its seasonal variability at 11°S
Summary and outlook
▶ First long-term observations of the AC (July 2013 – October 2015)
▶ Mean southward flow of 5-8 cm/s, AC penetrates down to ~200 m depth
▶ Weak mean southward transport of the AC of 0.28 Sv
▶ Seasonal variability is
dominated by 120-day, semi- annual, and annual oscillations
▶ How much of the observed seasonal variability can be explained by linear superposition of equatorial basin modes?
▶ Which parts of the spectrum are forced locally / remotely?