The role of HIG1/MYB51 in the regulation of indolic glucosinolate biosynthesis
Inaugural-Dissertation
zur
Erlangung des Doktorgrades
der Mathematisch-Naturwissenschaftlichen Fakultät der Universität zu Köln
vorgelegt von
Bettina Berger
aus Heilbronn Köln 2007
Berichterstatter: Prof. Dr. U.-I. Flügge Prof. Dr. M. Hülskamp Prüfungsvorsitzende: Prof. Dr. K. Schnetz Tag der mündlichen Prüfung: 2.Juli 2007
The most exciting phrase to hear in science, the one that heralds new discoveries, is not Eureka! (I found it!), but "That's funny....".
Isaac Asimov
Index i
1 Introduction ... 1
1.1 Glucosinolate biosynthesis... 1
1.2 A link between indolic glucosinolate, IAA and camalexin biosynthesis ... 2
1.3 The biological role of glucosinolates ... 5
1.4 The regulation of glucosinolate biosynthesis ... 7
2 Material and Methods ... 10
2.1 Material... 10
2.1.1 Chemicals, enzymes, oligo nucleotides... 10
2.1.2 Media, buffers ... 11
2.1.3 Antibiotics... 12
2.1.4 Organisms... 12
2.1.4.1 Bacterial strains ... 12
2.1.4.2 Yeast strains (Saccharomyces cerevisiae) ... 12
2.1.4.3 Yeast cDNA libraries for yeast-two-hybrid assays ... 13
2.1.4.4 Arabidopsis thaliana... 13
2.1.4.5 Nicotiana benthamiana... 13
2.1.5 Vectors... 13
2.1.5.1 Bacteria vectors... 13
2.1.5.2 Yeast vectors... 14
2.2 Methods... 14
2.2.1 Methods working with bacteria ... 14
2.2.1.1 Preparation of chemically competent E. coli cells ... 14
2.2.1.2 Transformation of chemically competent E. coli cells ... 15
2.2.1.3 Preparation of electro-competent Agrobacteria ... 15
2.2.1.4 Transformation of electro-competent Agrobacteria... 15
2.2.2 Methods working with yeast... 16
2.2.2.1 Yeast transformation on small scales... 16
2.2.2.2 Yeast transformation in a multi-well format ... 16
2.2.2.3 In vivo recombination (“gap repair”) ... 16
2.2.2.4 Mating of two haplotypes in a multi-well format ... 16
2.2.3 Plant methods ... 17
2.2.3.1 Plant growth... 17
2.2.3.1.1 Growth on soil... 17
2.2.3.1.2 Growth on sterile culture plates... 17
2.2.3.1.3 Growth in liquid germination medium ... 17
2.2.3.2 Stable plant transformation ... 18
2.2.3.3 Transient transformation ... 18
2.2.3.3.1 Transformation of A. thaliana suspension culture (Berger et al., 2007)... 18
Index ii
2.2.3.3.2 A. thaliana and N. benthamiana leaf infiltration with Agrobacteria... 18
2.2.3.3.3 Transfection of tobacco BY2 protoplasts... 19
2.2.3.4 Seed surface sterilisation ... 19
2.2.3.4.1 Wet method ... 19
2.2.3.4.2 Dry method ... 19
2.2.3.5 Histochemical GUS analysis, modified after Jefferson et al. (1987) ... 19
2.2.3.6 Quantitative GUS activity measurement ... 20
2.2.3.7 Microscopical documentation ... 20
2.2.3.8 Hormone treatment of plants... 20
2.2.3.9 Ethanol induction of transgenic lines... 21
2.2.3.10 Extraction and measurement of glucosinolates and free auxin ... 21
2.2.3.11 Dual choice assay with Spodoptera exigua (C. Müller, University Würzburg)... 22
2.2.4 Molecular biology methods ... 22
2.2.4.1 Small scale plasmid preparation from E. coli cells (miniprep)... 22
2.2.4.2 Large scale plasmid preparation from E. coli cells... 22
2.2.4.3 Extraction of genomic DNA from plant material (fast prep)... 22
2.2.4.4 Extraction of total RNA from plant material ... 22
2.2.4.5 DNase I treatment and reverse transcription ... 23
2.2.4.6 cRNA synthesis and microarray hybridisation... 24
2.2.4.7 Polymerase Chain Reaction... 24
2.2.4.8 Yeast Colony PCR... 24
2.2.4.9 Estimation of quantity and size of DNA fragments... 25
2.2.4.10 Purification of DNA fragments ... 25
2.2.4.11 Sequencing of DNA fragments... 25
2.2.4.12 Classical vector cloning... 25
2.2.4.13 Gateway® cloning ... 26
3 Results ... 27
3.1 Isolation of the HIG1-1D mutant ... 27
3.2 HIG1 encodes an R2R3 MYB transcription factor ... 29
3.3 HIG1/MYB51 is nuclear-localised ... 30
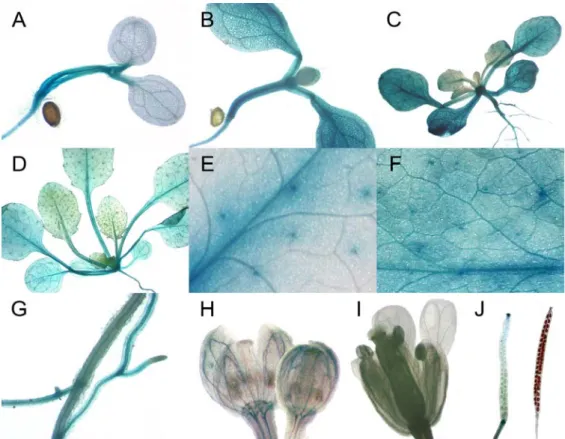
3.4 HIG1/MYB51 is mainly expressed in vegetative organs... 31
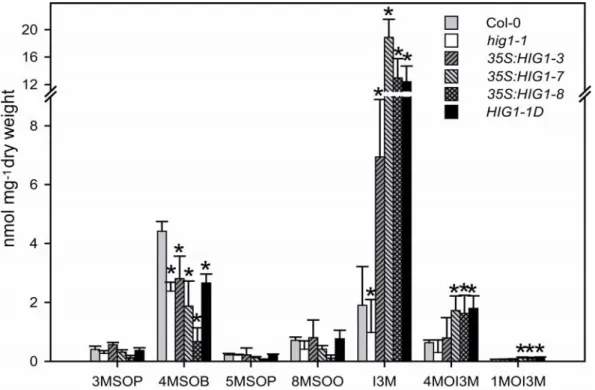
3.5 HIG1/MYB51 overexpression leads to a high glucosinolate profile ... 33
3.6 HIG1/MYB51 overexpression does not alter the growth phenotype... 35
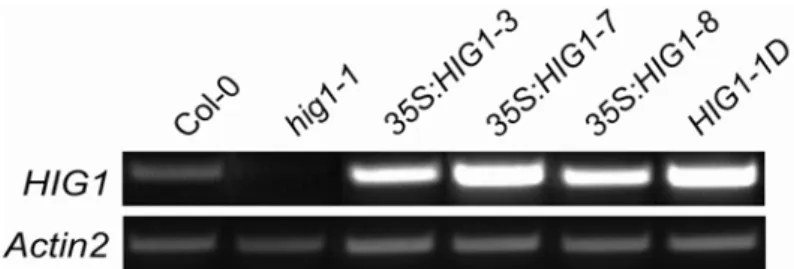
3.7 HIG1/MYB51 overexpression activates indolic glucosinolate pathway genes ... 37
3.8 HIG1/MYB51 activates promoters of indolic glucosinolate pathway genes... 43
3.9 HIG1/MYB51 expression is mechano-sensitive... 45
3.10 Ethylene activates the HIG1/MYB51 promoter in root tips ... 46
Index iii
3.11 Overexpression of HIG1/MYB51 leads to increased resistance against a generalist
herbivore ... 48
3.12 Screening for proteins interacting with HIG1/MYB51 ... 49
3.13 HIG1/MYB51 and ATR2/bHLH05 interact in vivo ... 55
3.14 ATR2/bHLH05 and HIG1/MYB51 expression overlap ... 56
3.15 ATR2/bHLH05 represses HIG1/MYB51 activation of indolic glucosinolate promoters... 57
4 Discussion... 60
4.1 HIG1/MYB51 is a positive regulator of indolic glucosinolate biosynthesis ... 60
4.2 HIG1/MYB51 is expressed at sites of indolic glucosinolate accumulation ... 64
4.3 HIG1/MYB51 plays a role in biotic stress response... 65
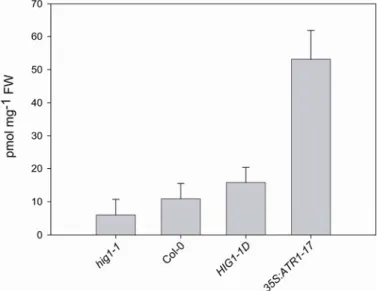
4.4 HIG1/MYB51 has a role distinct from its close homologue ATR1/MYB34 ... 66
4.5 Is HIG1/MYB51 differentially regulated in roots? ... 68
4.6 Is HIG1/MYB51 part of a complex regulatory network?... 68
5 References... 72
Appendix ... 84
Abbreviations... 104
Abstract ... 107
Kurzzusammenfassung ... 108
Danksagung………..…109
Erklärung ... 111
Lebenslauf... 112
1 Introduction 1
1 Introduction
Glucosinolates, also known as mustard oils, are a small but diverse class of sulfur and nitrogen containing secondary metabolites. They can be found in Brassicaceae and related plant families including important crop plants and vegetables, such as oilseed rape or cabbage. Their potential as a plant-defence system, along with recent findings suggesting cancer-protective properties of a glucosinolate-rich diet, led to an increased interest in this class of compounds. Substantial progess has thereby been achieved using the model plant Arabidopsis thaliana, which allowed unravelling the core biosynthesis pathway.
1.1 Glucosinolate biosynthesis
The precursors of glucosinolate biosynthesis are a few protein amino acids, mainly methionine, phenylalanine and tryptophan. Depending on the nature of the amino acid residue, the glucosinolates are classified as aliphatic, aromatic and indolic glucosinolates, respectively. The glucosinolate biosynthesis proceeds in three steps:
(i) side-chain elongation of amino acids, (ii) formation of the core structure and (iii) secondary side-chain modifications, where step (i) and (iii) give rise to the diversity of these compounds.
The enzymes mediating the biosynthesis of the core structure have been identified in A. thaliana (Fig. 1.1), and cytochrome P450 monooxygenases (CYPs) appeared to play a predominant role. CYP79F1 and CYP79F2 convert chain-elongated methionine to the aliphatic aldoxime (Reintanz et al., 2001; Hansen et al., 2001a;
Chen et al., 2003; Tantikanjana et al., 2004), CYP79B2 and CYP79B3 mediate the formation of indole-3-acetaldoxime (IAOx) from tryptophan (Mikkelsen et al., 2000;
Hull et al., 2000). The subsequent reaction giving rise to an aci-nitro-compound is catalysed by CYP83A1 and CYP83B1 in the aliphatic and indolic pathway, respectively (Bak et al., 2001; Naur et al., 2003; Hemm et al., 2003). The formation of the intermediate S-alkyl thiohydroximate might be a spontaneous reaction or dependant on glutathione-S-transferases (GSTs). The C-S lyase and an S- glucosyltransferase (UGT) catalyze the subsequent synthesis of the thiohydroximate and the desulfo-glucosinolate, respectively (Mikkelsen et al., 2004; Grubb et al., 2004). Finally, sulfotransferases mediate the last step of the core pathway resulting in
1 Introduction 2 the synthesis of the parent glucosinolate (Piotrowski et al., 2004; Klein et al., 2006), which can undergo secondary modifications.
1.2 A link between indolic glucosinolate, IAA and camalexin biosynthesis
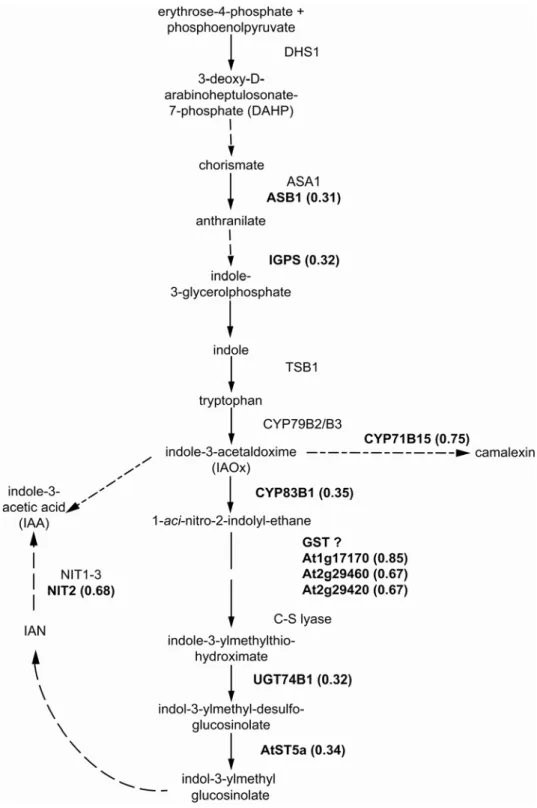
Analyses of mutants defective in the biosynthesis of indolic glucosinolates have revealed a tight link with auxin biosynthesis, since both pathways share the same Figure 1.1: Schematic representation of the aliphatic and indolic glucosinolate biosynthesis.
ASA1, anthranilate synthase alpha 1; TSB1, tryptophan synthase beta 1; CYP, cytochrome P450 monooxygenase; UGT, S-glycosyltransferase; AtST, A. thaliana sulfotransferase.
1 Introduction 3 precursors (Fig. 1.2). Knock-out plants of cyp83b1 and the C-S lyase were initially described as superroot (sur) mutants, with respect to their increased number of lateral and adventitious roots (Delarue et al., 1998; Barlier et al., 2000; Mikkelsen et al., 2004). Besides the observed root morphology, sur mutants showed elongated hypocotyls and epinastic cotyledons. The observed phenotype thereby resembled that of wild-type seedlings grown on auxin containing media. Indeed, the sur mutants contained an elevated indole-3 acetic acid (IAA) level compared to wild-type plants.
Moreover, partial or complete blockage of the indolic glucosinolate biosynthesis led to a redirection of IAOx into the IAA biosynthesis pathway, leaving to a high-auxin phenotype (Bak et al., 2001). Further evidence for an increased IAA accumulation in response to an impaired indolic glucosinolate biosynthesis, is provided by studies of an ugt74b1 mutant line, with stunted, mal formed plants (Grubb et al., 2004).
Figure 1.2: Simplified model of the IAA synthesis pathways in A. thaliana (modified after Zhao et al., 2002; Woodward and Bartel, 2005; Pollmann et al., 2006). Question marks indicate pathways with unknown enzymes. ASA1, anthranilate synthase alpha 1; ASB1, anthranilate synthase beta 1; TSB1, tryptophan synthase beta 1; CYP, cytochrome P450 monooxygenase; UGT, S-glycolsytransferase; AtST, A. thaliana sulfotransferase; NIT, nitrilase; MYR, myrosinase; AAO1, indole-3-acetaldehyde oxidase, YUCCA, flavin monooxygenase-like protein; IAOx, indole-3-acetaldoxime; I3M, indole-3-ylmethyl glucosinolate; IAAId, indole-3-acetaldehyde; IAA, indole-3-acetic acid; IAN; indole-3- acetonitrile.
1 Introduction 4 However, the pleiotropic phenotype of this mutant is caused by both, an accumulation of the thiohydroximate, and an increased auxin level.
An opposite effect was reported for a cyp79b2/cyp79b3 double knock-out mutant, which contained slightly decreased IAA concentrations (Zhao et al., 2002).
Nevertheless, the mutants were still able to produce sufficient amounts of IAA for plant growth and reproduction. A reason for that is the existence of multiple pathways for IAA biosynthesis. One possibility is the tryptophan-independent pathway; another way uses tryptophan as precursor and converts it to IAOx via tryptamine. The key enzyme is the flavin monooxygenase YUCCA. Even though this pathway also produces IAOx and is still functional in cyp79b2/cyp79b3 knock-out mutants, these plants do not contain any detectable indolic glucosinolates (Zhao et al., 2002).
Consequently, IAOx produced by CYP79B2 and CYP79B3 appears to be the sole source for indolic glucosinolate biosynthesis, whereas the IAOx pool derived from the YUCCA pathway is exclusively shuttled into IAA synthesis. Besides IAA and indolic glucosinolate biosynthesis, IAOx also serves as precursor for camalexin (Glawischnig et al., 2004), the main phytoalexin of the model plant A. thaliana, and like indolic glucosinolates involved in the biotic stress response. The rate-limiting step in camalexin biosynthesis is catalysed by CYP71B15 (Schuhegger et al., 2006) and the precursor IAOx seems to be solely derived from the CYP79B2/CYP79B3 pool, since the cyp79b2/cyp79b3 double knock-out contained no detectable amounts of camalexin (Glawischnig et al., 2004). Hence, IAOx constitutes an important branching point of several pathways derived from tryptophan.
A further link between synthesis of the precursor tryptophan and IAA accumulation could be observed in the cyp83b1 mutant. The increased IAA content was accompanied by an upregulation of ASA1 (Smolen and Bender, 2002), coding for the feedback-regulated subunit of anthranilate synthase. Along with that, the cyp83b1 phenotype could be partially rescued by complementation with asa1 knock-out mutants (Stepanova et al., 2005). This suggests that an increased auxin synthesis is strictly dependent on high ASA1 transcription. Accordingly, heterologous expression of a feedback-insensitive ASA1 subunit from rice in A. thaliana led to high tryptophan and auxin levels in transgenic plants (Ishihara et al., 2006). Taken together, tryptophan biosynthesis is not only important for providing the amino acid for protein synthesis, but there is a tight connection with the synthesis of indolic glucosinolates, camalexin and auxin that are derived from tryptophan.
1 Introduction 5 1.3 The biological role of glucosinolates
The capacity of plants to synthesise glucosinolates co-occurs with the expression of myrosinases. These are special β-thioglucoside glycohydrolases (also called TGGs), located in idioblasts (myrosin-cells) scattered throughout most tissues that accumulate glucosinolates (Husebye et al., 2002; Barth and Jander, 2006). Upon tissue rupture, the biologically inactive glucosinolates come in contact with myrosinases, which catalyze the hydrolysis of the glucose residue. The unstable aglucone subsequently gives rise to various biologically active breakdown products, including nitriles, thiocyanates and isothiocyanates among others. The nature of the breakdown product thereby depends on the surrounding conditions, such as pH, the presence of ferrous ions or myrosinase interacting proteins (Wittstock and Halkier, 2002; Bones and Rossiter, 2006).
The bipartite glucosinolate-myrosinase symstem has also implications for human nutrition. The uptake and bioavailability of glucosinolates and their breakdown products not only depend on the respective vegetable consumed, but also on growth conditions, transport, storage and food processing that influence glucosinolate concentration and myrosinase activity (Johnson, 2002). In general, isothiocyanates are believed to contribute predominantly to the anti-carcinogenic properties of Brassica vegetables. Case studies showed a negative correlation between cancer development and the uptake and secretion of isothiocyanates due to the consumption of glucosinolate-rich food. This could be shown for cancers of the respiratory and digestive system, but also for hormone-dependent cancers (review by Holst and Williamson, 2004; Keck and Finley, 2004). Interestingly, the protection against cancer may be achieved on two different levels of cancer development. First of all, isothiocyanates are known to stimulate phase II enzymes in the liver that inactivate carcinogens and target them for secretion (Surh, 2003). Second, they have been shown to induce apoptosis in cancer cell lines (Pledgie-Tracy et al., 2007).
Isothiocyanates might therefore not only inhibit cancer development but also reduce tumor growth and promotion.
Unlike the beneficial effects of moderate glucosinolate intake in human nutrition through Brassica vegetables, high ingestion can have adverse effects on animal health when large amounts of Brassica crops are used as fodder. Therefore, different methods are employed to reduce the glucosinolate concentration prior to feeding (Tripathi and Mishra, 2007). So far, the detoxification of high-glucosinolate crops
1 Introduction 6 seems to be the most appropriate way of using them as fodder, since breeding of cultivars with lower glucosinolate concentrations might affect the interaction of the plant with pathogens and herbivores.
Indeed, the primary function of the glucosinolate-myrosinase system is thought to be the deterrence of attacking herbivores. A high glucosinolate concentration acts as deterrent against generalist herbivores (Kliebenstein et al., 2002a). However, not only the absolute concentration, but rather the composition of the produced glucosinolates is crucial for plant-herbivore interaction (Mewis et al., 2006; Zhang et al., 2006). Kim and Jander (2007) could show that A. thaliana responds to attack by the green peach aphid (Myzus persicae) not with an increased glucosinolate biosynthesis but with the conversion of indole-3-ylmethyl glucosinolate (I3M) to 4-methoxyindol-3-ylmethyl glucosinolate (4MOI3M), which is a more potent aphid deterrent than I3M. In contrast to generalist herbivores, specialists have evolved various systems to overcome the glucosinolate-myrosinase system and have learned to take advantage of it. Certain specialist herbivores are able to secrete the glucosinolates and use them for their own defense (Muller et al., 2001), others express enzymes for the detoxification of glucosinolates (Ratzka et al., 2002; Wittstock et al., 2004). The glucosinolate profile can thereby be used by specialists for host-plant recognition and may function as an oviposition or feeding signal (Rask et al., 2000; Ulmer and Dosdall, 2006). Altering the glucosinolate profile of crop cultivars in combination with the growth of trap plants might therefore be a potential tool to delimit herbivory by specialists (Cook et al., 2006). A further possibility to reduce the damage by specialists is already present in nature. Volatiles released during herbivore attack can in turn attract natural enemies of the herbivore feeding on the plant (Agrawal, 2000). This offers plants a further possibility for the defence against specialist herbivores that are unaffected by high glucosinolate concentrations.
Besides the role of glucosinolates in the plant-insect interaction, there is emerging evidence that also microbial pathogens are affected by glucosinolates. Treatment with bacterial pathogens or oomycetes triggered an accumulation of indolic glucosinolates in leaves and roots of A. thaliana, respectively (Brader et al., 2001;
Bednarek et al., 2005) and a role of indolic glucosinolates as defence compounds was demonstrated upon infection with the fungal pathogen Botrytis cinerea, which was shown to produce larger lesions on low indolic glucosinolate mutants (Kliebenstein et al., 2005). Moreover, in vitro experiments showed adverse effects of
1 Introduction 7 aliphatic isothiocyanates, mainly 4-methylsulphinylbutyl isothiocyanate, on the growth of various plant pathogens, including bacteria and fungi (Tierens et al., 2001).
Therefore, it seems that different glucosinolates and their breakdown products have the potential to differentially influence the plant-pathogen interaction. Indeed, an alteration of the glucosinolate profile of A. thaliana by introducing new pathway enzymes was proven to enhance the resistance against various pathogens (Brader et al., 2006). Tailor-made glucosinolate compositions might also find application in agronomically important Brassica species. Besides the cultivation of Brassica vegetables and crops, the use of glucosinolate-containing plants in the so-called biofumigation has gained increasing interest. This describes the use of green manure derived from Brassica species to suppress soil-borne pests, ranging from bacteria, fungi and nematodes to insects (Matthiessen and Shackleton, 2005; Matthiessen and Kirkegaard, 2006).
Taken together, the concentration and more important the composition of glucosinolates in Brassica species is an important factor when it comes to pest management but also with regard to animal and human nutrition. One way to control the accumulation of glucosinolates would be the manipulation of existing or introduction of novel pathway enzymes (Feldmann 2001; Brader et al., 2006).
However, a further possibility would be to alter the expression of multiple enzymes at the same time by manipulating a regulator of the specific pathway (Endt et al., 2002;
Broun, 2004).
1.4 The regulation of glucosinolate biosynthesis
The glucosinolate concentration and profile of A. thaliana not only differs among different organs and tissues, but also during plant development or in response to environmental stimuli (Petersen et al., 2002; Brown et al., 2003; previous section).
Furthermore, indolic glucosinolate and IAA biosynthesis are tightly connected but differ with regard to relative abundance, spatial distribution, developmental control and responsiveness to environmental stimuli. Hence, a complex regulatory network controlling these processes can be expected. However, only few components involved in the regulation of glucosinolate and/or IAA accumulation have been identified to date.
IQD1 is a nuclear-localised calmodulin-binding protein, identified in a screen for mutants with increased glucosinolate accumulation (Levy et al., 2005).
1 Introduction 8 Overexpression of IQD1 results in increased levels of aliphatic and indolic glucosinolates. However, only genes coding for key enzymes of the indolic pathway were upregulated, the respective structural genes of the aliphatic pathway were downregulated, and the authors speculate about a possible feedback regulation of the two pathways. Nevertheless, the high glucosinolate phenotype was accompanied by an increased resistance against two generalist herbivores and IQD1 transcription is induced by mechanical stimuli. Therefore, it might play a role in the biotic stress response.
A second putative component of the regulatory network controlling glucosinolate biosynthesis might be OBP2. OBP2 is a member of the DNA-binding-with-one-finger (DOF) transcription factor family and was shown to induce the transcription of at least several genes involved in glucosinolate biosynthesis, mainly CYP83B1 (Skirycz et al., 2006). Constitutive OBP2 overexpression lines were characterised by moderately increased levels of short-chain aliphatic and indolic glucosinolates, but also by an elevated IAA concentration and an altered growth phenotype with small, curly leaves.
OBP2 transcription is activated by methyl jasmonate treatment, in response to wounding or herbivore attack. However, the effect on the transcript level was only seen several hours after treatment. Therefore, OBP2 might not be part of an immediate response to biotic challenge.
Two further regulators of glucosinolate biosynthesis, mainly the indolic pathway, were originally identified as altered tryptophan regulation (atr) mutants. ATR1 codes for an R2R3-type MYB transcription factor (ATR1/MYB34; Bender and Fink, 1998; Celenza et al., 2005), ATR2 is a member of the basic helix-loop-helix (bHLH) proteins (ATR2/bHLH05; Smolen et al., 2002). Both, MYB and bHLH proteins, form two of the largest transcription factor families in plants, each with more than 120 members in A. thaliana (Stracke et al., 2001; Bailey et al., 2003). The factors, characterised so far, indicate diverse roles in plant development (Schmitz and Theres, 2005;
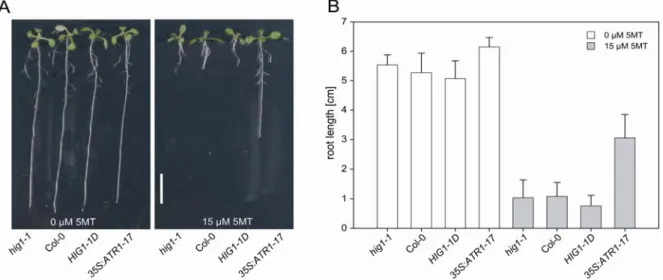
Schellmann et al., 2007), regulation of secondary metabolism and stress response (Winkel-Shirley, 2002; Baudry et al., 2004). Also ATR1/MYB34 and ATR2/bHLH05 appear to have a regulatory role in plant secondary metabolism. Both mutant lines (atr1D and atr2D) are characterised by an increased resistance to the tryptophan analogue 5-methyltryptophan (5MT). 5MT is able to feedback-regulate the anthranilate synthase alpha subunit (Fig. 1.2) but does not substitute for the nutritional role of tryptophan. The atr1D and atr2D lines overcome this toxic effect by
1 Introduction 9 a constitutive activation of ASA1 transcription. The dominant mutation in atr2D is caused by an amino acid exchange in a conserved domain of ATR2/bHLH05.
Interestingly, only overexpression of the mutated form (atr2D) but not of the wild-type allele (ATR2/bHLH05) leads to a pleiotropic phenotype characterised by the upregulation of multiple stress-related genes (Smolen et al., 2002). Therefore, the authors speculate whether the observed ASA1 activation might be a secondary stress response rather than a direct effect of ATR2/bHLH05. The activation of several genes in atr2D might possibly result from a disturbed protein/protein interaction with other transcription factors. However, an interaction of ATR2/bHLH05 or the mutated protein with ATR1/MYB34 could not be observed in a yeast-two-hybrid assay (Smolen et al., 2002), even though the formation of regulatory bHLH/MYB heterodimers has been reported in other cases previously (Zimmermann et al., 2004a; Feller et al., 2006). The atr1D line carries a mutation upstream the ATR1/MYB34 ORF, leading to a constitutively high expression level (Bender and Fink, 1998). The mutation results in an increased accumulation of indolic glucosinolates and IAA, caused by an activation of pathway genes (Celenza et al., 2005). The gene-to-trait relation was confirmed by ectopic overexpression of ATR1/MYB34 and in a loss-of-function mutant. Interestingly, the atr1-1 knock-out line could complement the high auxin phenotype of the cyp83b1 mutant, indicating an important role of ATR1/MYB34 in the homeostasis of indolic glucosinolate and IAA biosynthesis.
Even though several players of a regulatory network controlling indolic glucosinolate biosynthesis and accumulation have been identified to date, they do not solely account for the complex regulation observed. Aim of the presented study was the identification of further components, accounting for the coordinate regulation of indolic glucosinolate biosynthesis and the characterisation of such regulators with respect to their role in planta and possible interactions with known regulators. To this end, multiple strategies were applied to characterise an activation-tagging line with an altered glucosinolate accumulation. Biochemical analyses were used to study the mutant chemotype in detail, and molecular biology approaches were employed to identify the underlying genotype and further investigate the influence of the altered expression profile in planta.
2 Material and Methods 10
2 Material and Methods
2.1 Material
2.1.1 Chemicals, enzymes, oligo nucleotides
Unless otherwise stated, all chemicals were of analytical purity. Chemicals, laboratory equipment and enzymes were purchased from the following companies:
Amersham Pharmacia Biotech UK Ltd (Buckinghamshire, GB); Biorad (München, D);
Roche (Mannheim, D); Difco (Hamburg, D); Duchefa (Haarlem, NL); DuPont Company (Wilmigton, GB); Fermentas GmBH (St. Leon-Rot, D); Fluka AG (CH);
GibcoBRL (Karlsruhe, D); Heraeus (Düsseldorf, D); Intas (Göttingen, D); Merck (Darmstadt, D); Invitrogen Life Technologies (Karlsruhe, D); Molecular Dynamics (Krefeld, D); New England Biolabs (Schwalbach, D); Promega (Mannheim, D);
Qiagen GmbH (Hilden, D); Roche (Mannheim, D); Roth (Karlsruhe, D); Sarstedt (Nümbrecht, D); Schleicher & Schuell (Dassel, D); Serva (Heidelberg, D); Sigma- Aldrich (Taufkirchen, D); Stratagene Europe (Amsterdam, NL).
The following kits were used according to the manufacturer’s instructions:
QIAquick Gel Extraction Kit (Qiagen GmbH, Hilden, D) QIAquick PCR Purification Kit (Qiagen GmbH, Hilden, D) Quantum Prep Plasmid Miniprep Kit (BioRad, München, D) Quiagen Plasmid Midi Kit (Qiagen GmbH, Hilden, D)
pENTR/D-TOPO® cloning Kit (Invitrogen Life Technologies, Karlsruhe, D)
Gateway® LR clonaseTM Enzyme Mix (Invitrogen Life Technologies, Karlsruhe, D) Gateway® BP clonaseTM Enzyme Mix (Invitrogen Life Technologies, Karlsruhe, D) Big Dye Terminator v3.1 Cycle Sequencing Kit (Applied Biosystems, Foster City, USA)
Agilent Low RNA Input Fluorescent Linear Amplification Kit (Agilent Technologies, Böblingen, D)
BCATMProtein Assay Kit (Pierce, Rockford, USA)
Oligo nucleotides were purchased from Metabion (Martinsried, D) and are listed in the appendix.
2 Material and Methods 11 2.1.2 Media, buffers
All media and buffers were prepared with deionised water purified with a Milli-Q Plus PF system (Millipore, Schwalbach, D). Media were sterilised by autoclaving, heat- sensitive substances were filter sterilised. Unless otherwise stated solid media were prepared with 1% (w/v) agar. Plates used for the vertical growth of plant seedlings were prepared with 0.7% (w/v) gelrite.
Frequently used media and buffers:
TAE 40 mM Tris-Acetate, pH 7.5, 1 mM EDTA TE 10 mM Tris-HCl, pH 8, 1 mM EDTA
LB 1% (w/v) bacto tryptone, 0.5% (w/v) yeast extract, 1% (w/v) NaCl SOC 2% (w/v) bacto tryptone, 0.5% (w/v) yeast extract, 10 mM NaCl, 2.5
mM KCl, 10 mM MgCl2, 10 mM MgSO4x7H2O, 20 mM glucose YEB 0.5% (w/v) bacto peptone, 0.5% (w/v) beef extract, 0.1% (w/v) yeast
extract, 0.5% (w/v) sucrose, 0.05% (w/v) MgSO4x7H2O
MGL 0.5% (w/v) bacto tryptone, 0.25% (w/v) yeast extract, 0.5% (w/v) NaCl, 0.5% (w/v) mannitol, 0.116% (w/v) sodium glutamate, 0.025%
(w/v) KH2PO4, 0.01% (w/v) MgSO4, 1 mg/L biotin
YPAD 2% (w/v) bacto peptone, 1% (w/v) yeast extract, 100 mg/L adenine, pH 5.8; After autoclaving 40% (w/v) filter sterilised glucose was added to a final concentration of 2% (w/v).
SD-medium (yeast selection medium)
6.7 g/L yeast nitrogen base w/o amino acids (Difco), 0.6 g/L DO Supplement -Ade/-His/-Leu/-Trp (BD Biosciences Clontech, Palo Alto, USA), pH 5.8;
The amino acids used for negative selection were not added to the medium, the others at the given concentrations:
Adenine (100 mg/L), Histidine (20 mg/L), Leucine (100 mg/L), Tryptophan (50 mg/L);
After autoclaving 40% (w/v) filter sterilised glucose was added to a final concentration of 2% (w/v);
For SD -His medium, 1M filter sterilised 3-amino-1,2,4-triazole(3-AT) was added to a final concentration of 5 mM.
Germination medium
2.2 g/L MS (245, Duchefa, Haarlem, NL), 1% (w/v) sucrose, pH 5.6;
2 Material and Methods 12 2.1.3 Antibiotics
Antibiotics and their concentration used for the selection of positive transformed E. coli and A. tumefaciens:
Kanamycin 50 µg/mL
Ampicillin 50 µg/mL
Carbenicillin 50 µg/mL (E. coli); 100 µg/mL (A. tumefaciens)
Hygromycin 50 µg/mL
Chloramphenicol 10 µg/mL (E. coli); 75 µg/mL (A. tumefaciens) Rifampicin 150 µg/mL (A. tumefaciens strain GV3101);
20 µg/mL (A.fumefaciens strain LB A4404.pBBR1MCS virGN54D
Gentamycin 10 µg/mL (E. coli); 25 µg/mL (A. tumefaciens)
2.1.4 Organisms
2.1.4.1 Bacterial strains
Strain / Purpose Genotype (Reference) Escherichia coli
DH5α/
Plasmid amplification
F- Φ 80dlacZΔM15 Δ(lacZYA-argF)U169 deoR recA1 endA1 hsdR17(rK- mK+) phoA supE44 λ- thi-1 gyrA96 relA1;
(Hanaha, 1983) TOP10/
Plasmid amplification F- mcrA Δ(mrr-hsdRMS-mcrBC) Φ 80dlacZΔM15 ΔlacX74 recA1 araD139 Δ(ara-leu)7697 galU galK rpsL (StrR) endA1 nupG; (Invitrogen)
DB3.1/
Propagation of ccdB containing plasmid
F- gyrA462 endA1 Δ(sr1-recA) mcrB mrr hsdS20(rB-, mB-) supE44 ara-14 galK2 lacY1 proA2 rpsL20(SmR) xyl-5 λ- leu mtl1; (Invitrogen)
Agrobacterium tumefaciens GV3101/
Stable plant transformation
RifR, GentR,;
(Koncz and Schell,1986) LB
A4404.pBBR1MCS virGN54D/
Leaf infiltration and cell culture
transformation
RifR, ChlorR;
(van der Fits et al., 2000)
2.1.4.2 Yeast strains (Saccharomyces cerevisiae)
Strain Genotype (Reference)
Y187 MATα, ura3-52, his3-200, ade2-101, trp1-901, leu2-3, 112, gal4 Δ, met-, gal80 Δ,URA3::GAL1UAS-Gal1TATA-lacZ, MEL1;
(Harper et al., 1993)
2 Material and Methods 13 AH109 MATa, trp1-901, leu2-3, 112, ura3-52, his3-200, gal4 Δ,
gal80 Δ, Lys2::GAL1UASGAL1TATA-HIS3, MEL1, GAL2UAS-GAL2TATA-ADE2, URA3::MEL1UAS- MEL1TATA-lacZ;
(James et al., 1996)
2.1.4.3 Yeast cDNA libraries for yeast-two-hybrid assays Library Source
Ara 446 A. thaliana suspension culture grown in darkness;
K.Salchert, AG C. Koncz, MPIZ Cologne
Ara-1101 Clontech Matchmaker cDNA Library; green leaf material from A. thaliana; 3-week-old plants, ecotype Columbia;
(Clontech)
HS-Ara1 polyT-cDNA from whole plants of A. thaliana, ecotype Columbia; Hans Sommer, MPIZ Cologne
The yeast-two-hybrid screens with these libraries were performed by the AG Uhrig, University of Cologne.
2.1.4.4 Arabidopsis thaliana
All plants and suspension cell cultures used or generated were in the background of Arabidopsis thaliana L.Heyn cv. Columbia (NASC-Nr. N1093).
Public available transgenic lines used in this study were:
Line 19.4,TAMARA activation tagging population (Schneider et al., 2005), Line 228B12, GABI-Kat collection (Rosso et al., 2003).
2.1.4.5 Nicotiana benthamiana
Wild type plants (cv. Samsun) were used for leaf infiltration with Agrobacteria. The Bright Yellow cell culture (BY2) was used for subcellular localisation of fluorescent fusion proteins.
2.1.5 Vectors
2.1.5.1 Bacteria vectors
Vector Source Cloning purpose
pENTR/D- TOPO
Invitrogen Creating a Gateway compatible entry clone
pDONR207 Invitrogen Creating a Gateway compatible entry clone
pGWB1 T. Nakagawa,
Shimane University
Gateway compatible binary destination vector, no promoter, no tag
pGWB2 T. Nakagawa,
Shimane University
In planta overexpression under control of the CaMV 35S promoter
2 Material and Methods 14
pGWB3 T. Nakagawa,
Shimane University
In planta expression of the uidA reporter gene driven by the cloned promoter
pGWB3i T. Nakagawa,
Shimane University, modified (Berger et al., 2007)
In vivo expression of the uidA reporter gene containing an intron to prevent expression in Agrobacteria
pGWB5 T. Nakagawa,
Shimane University Expression of translational GFP fusion proteins for subcellular localisation
pSPYN Klaus Harter,
University of Tuebingen
Bimolecular fluorescence assay, “split- YFP”, translational fusion with the YFP N-terminus
pSPYC Klaus Harter,
University of Tuebingen
Bimolecular fluorescence assay, “split- YFP”, translational fusion with the YFP C-terminus
pUCΔalcAN Caddick et al., 1998 Ethanol inducible expression system pBinΔalc-R Caddich et al., 1998 Ethanol inducible expression system 2.1.5.2 Yeast vectors
Vector Source Cloning purpose
pCD2-attR Joachim Uhrig, University of Cologne
Gateway compatible yeast expression vector for construction of yeast-two- hybrid bait constructs; Trp1+
pC-ACT2-attR Joachim Uhrig, University of Cologne
Gateway compatible yeast expression vector for construction of yeast-two- hybrid prey vectors / libraries; Leu2+
pACT Joachim Uhrig,
University of Cologne
Classical yeast expression vector used as empty control and for “gap repair”
pAS-SNF1 Joachim Uhrig, University of Cologne
Bait vector interacting with SNF4, used as positive control
pACT-SNF4 Joachim Uhrig, University of Cologne
Prey vector interacting with SNF1, used as positive control
2.2 Methods
2.2.1 Methods working with bacteria
2.2.1.1 Preparation of chemically competent E. coli cells
The protocol was adapted from Inoue et al. (1990) and slightly modified.
Several E. coli colonies were inoculated in 250 mL LB (supplemented with 50 mM MgCl2 ) and grown at 18°C until an OD600 of 0.6. The suspension was chilled on ice for 10 min, distributed to 50 mL tubes and centrifuged at 4500 g in a cooled centrifuge. The pellets were resuspended in 80 mL ice-cold TB buffer (10 mM Pipes,
2 Material and Methods 15 55 mM MnCl2, 15 mM CaCl2, 250 mM KCl) and incubated on ice for another 10 min.
The cells were harvested by centrifugation and resuspended in 20 mL ice cold TB buffer. DMSO was slowly added to a final concentration of 7% (v/v). The cell suspension was incubated on ice for 10 min. Aliquots of 100 µL were frozen in liquid nitrogen and kept at -80°C until use.
2.2.1.2 Transformation of chemically competent E. coli cells
An aliquot of chemical competent E. coli cells was thawed on ice and about 200 ng of vector DNA were added. After 30 min on ice, the cells were heat-shocked by incubation for 30-60 sec at 42°C and cooled immediately on ice for about one minute.
The cells were recovered in 900 µL LB or SOC medium and incubated at 37°C for one hour with gentle shaking. For selection of positive transformands, an aliquot of the cells was plated on solid LB medium containing the respective antibiotics and incubated overnight at 37°C.
2.2.1.3 Preparation of electro-competent Agrobacteria
A preculture of Agrobacteria was diluted in 100 mL MGL medium (OD600 of 0.04-0.08) and grown for about 4 h to an OD600 of 0.5. Subsequently, all steps were performed on ice and a cooled centrifuge was used. The cells were harvested by centrifugation and resuspended in 40 mL 1 mM HEPES, pH 7. After that, three further washing steps followed. Each time, the cells were centrifuged and resuspended in 1 mM HEPES, pH 7, 10% (v/v) glycerol, decreasing the volume from 40 mL to 2 mL and 1mL, respectively. 50 µL aliquots of the final cell suspension were snap frozen in liquid nitrogen and stored at -80°C until use.
2.2.1.4 Transformation of electro-competent Agrobacteria
Electro competent Agrobacteria were thawed on ice and about 50-200 ng vector DNA were added. The cells were transferred to a chilled electroporation chamber (2 mm gap) and subjected to electroporation (25 µF, 400 Ω, 2.5 kV pulse for about 2 sec).
Immediately, 1 mL YEB medium at RT was added and the cells were allowed to recover for 2 hours at 28°C with gentle shaking. Positive transformands were selected by plating an aliquot on solid YEB medium containing the respective antibiotics and incubation for 2 days at 28°C.
2 Material and Methods 16 2.2.2 Methods working with yeast
2.2.2.1 Yeast transformation on small scales
Small scale preparation of competent cells and yeast transformation was performed according to the LiAc method described by Gietz et al. (1995). About 200-500 ng plasmid DNA were used per transformation. If multiple transformations were done in parallel, the DNA was distributed to Eppendorf tubes and the competent yeast cells were then added.
2.2.2.2 Yeast transformation in a multi-well format
For 100 transformations, 5 mL of an overnight yeast culture were inoculated in 150 mL YPAD and grown at 30°C for about 4 hours. The cells were harvested by centrifugation and washed once in 25 mL H2O. The cells were again centrifuged, the supernatant discarded and the pellet resuspended in the remaining liquid. The following reagents were added in the given order: 7 mL PEG 3350 (50% w/v); 1.06 mL 1 M LiAc, pH 7.5; 735 µL single stranded DNA (2 mg/mL); 1.3 mL H2O. The cells were resuspended by pipetting and 100 µL competent yeast cells were added to each well, already containing the vector DNA. The cells were mixed with the DNA and the plates were incubated for 30 min at 30°C, then for 20 min at 42°C. The cells were sedimented by centrifugation, the supernatant removed and the pellet mixed with 100 µL selection medium. A second plate with a 1:100 dilution in selection medium was prepared and both plates were kept at 30°C. After 2-3 days the positive transformands were transferred to solid medium plates using a multi-well replicator.
2.2.2.3 In vivo recombination (“gap repair”)
Yeast offers the advantage of high frequency homologous recombination. It allows therefore the high throughput cloning of PCR fragments into linearised plasmids (“gap repair”), given the PCR fragments and plasmid have homologous sequences.
For this purpose, PCR fragments and a linearised, dephosphorylated plasmid are introduced into yeast by co-transformation in a multi-well format (2.2.2.3).
2.2.2.4 Mating of two haplotypes in a multi-well format
Introducing two separate plasmids into yeast can be achieved by co-transformation of both plasmids into a single yeast strain, or by introducing each construct into yeast strains of opposite mating types and subsequent mating of these strains. This allows
2 Material and Methods 17 handling the transformants separate from each other and allows the generation of larger numbers of double positive transformants than achieved with the co- transformation method.
As well as “gap repair” and yeast transformation, mating can be performed in a multi- well format. Therefore, colonies of both mating partners were resuspended each in 50 µL YPAD (PEG 3350 10% (w/v)) and mixed together in a multi-well plate (100 µL final volume). The plates were incubated for at least 3 hours at 30°C before the cells were transferred to solid selection media with a multi-well replicator.
2.2.3 Plant methods
2.2.3.1 Plant growth
To break the seed dormancy, freshly sawn seeds on either soil or culture plates were stratified for 2-4 days in the dark at 4°C.
2.2.3.1.1 Growth on soil
Seeds were sawn on humid, freshly prepared A. thaliana or tobacco culture soil and covered with a transparent plastic lid for the first days to maintain high humidity.
Plants were either grown in the greenhouse with a 16 h/8 h light/dark regime and an average photon flux density of 150-200 µmol.m-2.s-1, or in a growth cabinet with an 8 h/16 h light dark cycle and an average photon flux density of 70 µmol.m-2.s-1. The temperature was kept at 22°C during the light and 18°C during the dark period.
Relative humidity was approximately 40%.
2.2.3.1.2 Growth on sterile culture plates
Surface sterilised Arabidopsis seeds were plated on solid germination medium and incubated in growth cabinets with a 12 h /12 h light dark or a 8 h /16 h light/dark regime, and an average photon flux density of 70 µmol.m-2.s-1. For the selection of T1
transfromands the seeds were mixed with 0.1% (w/v) agarose and evenly distributed on germination medium supplemented with 50 µg/mL kanamycin. The resistance of seedling to 5-methyl-tryptophan (5MT) was tested by growth on germination medium containing 15 µM 5MT.
2.2.3.1.3 Growth in liquid germination medium
15 - 25 surface sterilised Arabidopsis seeds were added to 100 mL liquid germination medium in a 250 mL Erlenmeyer flask and grown for 7 days under constant light and
2 Material and Methods 18 constant shaking (140 rpm). The concentrations of substances were as indicated for growth on solid medium, unless otherwise stated.
2.2.3.2 Stable plant transformation
Flowering Arabidopsis plants were transformed by the floral dip method, adapted from Clough and Bent (1998). In brief, the respective Agrobacterium strain was grown in 300 mL LB medium until OD600 of 0.8-1.0. The cells were harvested by centrifugation (2500 g for 15 min at RT) and resuspended in infiltration medium (5%
(w/v) sucrose, pH 5.7, 0.03% (v/v) Silwet L-77; in tab water) to an OD600 of 0.8. The inflorescence of the Arabidopsis plants was submerged in this suspension for 20 sec and the plants were afterwards kept horizontally in the dark for one day, prior to transfer to the greenhouse.
2.2.3.3 Transient transformation
2.2.3.3.1 Transformation of A. thaliana suspension culture (Berger et al., 2007)
A. thaliana cells were grown in the dark at 22°C with gentle shaking at 160 rpm. The cells were inoculated weekly at a 1:5 dilution into fresh medium (4.3 g/L MS basal salts (Duchefa, NL), 4 mL/L Gamborg’s vitamin solution (Sigma, Munich, D), 1 mg/L 2,4-dichlorophenoxyacetic acid (2,4-D), 30 g/L sucrose, pH 5.8).
The Agrobacteria strains used were the hypervirulent strain LBA4404.pBBR1MCS virGN54D (van der Fits et al., 2000) for the effector and reporter vectors and the antisilencing strain 19K (Voinnet et al., 2003). Agrobacteria from fresh plates were grown overnight in YEB medium with the respective antibiotics. Cells were harvested by centrifugation, washed once in the plant cell culture medium and resuspended in 25 % of the initial culture volume. 25 µL of the 19K strain and 25 µL of the reporter and/or effector strains were added to 3 mL of 1:5 diluted plant cell culture in 6 well sterile culture plates (Corning Inc., USA). After 3-4 days of co-culture (dark, 22°C, 160 rpm), 1 mL of each sample was centrifuged and the pellet was stored at -80°C until GUS analysis. The remaining cells were treated with 500 µL X-Gluc staining solution (50 mM NaH2PO4, pH 7, 1 mM X-Gluc) for one hour to overnight at 37°C in the dark (without shaking).
2.2.3.3.2 A. thaliana and N. benthamiana leaf infiltration with Agrobacteria
For the transient expression in leaves, A. thaliana and N. benthamiana plants were grown in the greenhouse for about 4-6 weeks (vegetative growth phase).
2 Material and Methods 19 The Agrobacteria (LB A4404.pBBR1MCS virGN54D) carrying the desired constructs and the anti-silencing strain 19K were grown overnight in 3-5 mL YEB medium with the respective antibiotics. The cells were harvested by centrifugation (15 min, 4000 rpm) and the supernatant discarded. The Agrobacteria were resuspended in AS medium (10 mM MgCl2, 10 mM MES, pH 5.6, 150 µM acetosyringon) and the OD600
adjusted to 0.7-0.8. The cells were left at RT for about 4 hours. Prior to leaf infiltration, the Agrobacteria were mixed in an equimolar ratio and injected into the abaxial air space of the leaves using a syringe. The plants were kept in the dark overnight and then transferred to the greenhouse. Leaves were analysed about 3-4 days after infiltration.
2.2.3.3.3 Transfection of tobacco BY2 protoplasts
The transfection of BY2 protoplast was performed as described by Sheen (2001), based on the PEG mediated transfection with 30 µg of total DNA.
2.2.3.4 Seed surface sterilisation 2.2.3.4.1 Wet method
Arabidopsis seeds were surface sterilized in 3.6% (v/v) sodium hypochlorite, 0.02%
(v/v) Triton X-100, for 15 min followed by several washes with sterile deionised water.
2.2.3.4.2 Dry method
Arabidopsis seeds were distributed into Eppendorf tubes and placed in a glass desiccator next to a beaker with 100 mL 12% (v/v) sodium hypochlorite. Three mL 37% (v/v) hydrochloric acid were added carefully to the sodium hypochlorite and the desiccator was closed tightly. The seeds were surface sterilized for at least 4 hours up to overnight incubation. The chlorine gas was allowed to evaporate from the Eppendorf tubes for 2-3 hours under the cleanbench.
2.2.3.5 Histochemical GUS analysis, modified after Jefferson et al. (1987)
Histochemical detection of GUS activity was performed using 5-bromo-4-chloro-3- indolyl-β-D-glucuronid acid (X-Gluc) as substrate. The plant material was initially fixed for about 30 min in Fixans (0.3% (v/v) formaldehyde, 10 mM MES, pH 5.6, 0.3 M mannitol) and then rinsed in washing buffer (50 mM Na2HPO4, pH 7) for the same time. The fixed material was infiltrated with staining solution (50 mM Na2HPO4, pH 7, 1 mM X-Gluc) and stained overnight at 37°C in the dark. If plant material with a
2 Material and Methods 20 hydrophobic surface was stained (leaf, stem), Triton X-100 was added as surfactant to a final concentration of 0.1% (v/v). Chlorophyll of stained sample was removed by incubation in 70% (v/v) ethanol until the plant material was clear. The destaining process could be accelerated by microwaving the samples in 70% (v/v) ethanol.
2.2.3.6 Quantitative GUS activity measurement
Proteins were extracted from leaf of cell pellets in 200-800 µL protein extraction buffer (50 mM Na2HPO4, pH 7, 1 mM EDTA, 0.1% (v/v) Triton X-100). The homogenate was centrifuged (15 min, 13000 rpm, 4°C) and the clear supernatant was used for protein quantification (BCA kit, Pierce, Rockford, USA) with BSA as a standard. The GUS activity was determined using 4-methylumbelliferyl-β-D- glucuronide (MUG) as substrate. The amount of 4-methylumbelliferone (4MU) formed, was recorded fluormetrically (Ex 340 nm; Em 465 nm). For this, 200 µL substrate buffer (protein extraction buffer with 1 mM MUG) and 25 µL protein extract were mixed, incubated at 37°C in the dark and measured every 10-30 min on a Tecan multi-well plate reader (Crailsheim, D).
2.2.3.7 Microscopical documentation
Fluorescence fusion proteins were analysed with a Nikon Eclipse E800 using a GFP specific filter (GFP-BD; EX 460-500; DM 505; BA 510-560).
GUS stained plant material was either analysed with a Nikon Eclipse E800 (microscope) or a Nikon SMZ-U (stereoscope).
Pictures were taken with a 1-CCD colour video camera (KY-F1030; JVC, Singapore) operated by the DISKUS software (Technisches Büro Hilger, Königswinter, D).
2.2.3.8 Hormone treatment of plants
Arabidopsis plants were treated with hormones either by direct spraying or growth on hormone supplemented media. The hormones were used at the given concentrations:
Hormone Concentration used for
spraying (in 0.1% (v/v) ethanol, 0.05% (v/v) Tween)
Concentration added to growth media (0.01% (v/v) ethanol final concentration) 1-Aminocyclopropane-
1-carboxylic acid (ACC) 10 µM 10 µM
Salicylic acid (SA) 0.5 mM 10 µM
Methyl jasmonate (MeJ) 0.45 mM 10 µM
2 Material and Methods 21 For spraying experiments, 6-week-old wild type plants (grown under short day conditions, vegetative growth phase) were used. The rosettes were sprayed with the respective hormone solution to cover each leaf and the plants were kept under a transparent lid to maintain vapour and avoid cross contamination with other hormones. Samples for RNA extraction were taken after 0, 0.5, 2 and 4 hours.
For growth on hormone supplemented media, transgenic Arabidopsis plants carrying a GUS reporter construct were used. Liquid culture experiments were performed with 7-day-old seedlings by adding the hormones to the medium yielding the respective final concentration. Samples for histochemical GUS staining were taken 0, 4, 24 and 48 hours after hormone induction. Hormone treatment on solid media was achieved by growing seedlings vertically, allowing the roots to grow on top of a sterile filter paper, laid on the surface of the medium. For hormone induction, the filter paper was soaked with 2 mL of the respective hormone solution and samples were taken at the same time points as for liquid culture experiments.
2.2.3.9 Ethanol induction of transgenic lines
Six-week-old transgenic Arabidopsis plants (short day conditions, vegetative growth phase) carrying an ethanol inducible construct and control plants were induced by watering with 0.1% (v/v) ethanol. The plants were covered with a transparent lid to maintain the ethanol vapour. Rosette leaves for RNA extraction were taken 0, 6, 12 and 24 hours after induction.
2.2.3.10 Extraction and measurement of glucosinolates and free auxin
The original identification of I3M in the transgenic HIG1-1D line is described in Schneider et al. (2005) and Gigolashvili et al. (2007).
For a detailed analysis of the chemotype, glucosinolates were extracted from rosette leaves and analysed as described by Gigolashvili et al. (2007). In brief, glucosinolates were isolated from methanolic extracts of lyophilised rosette leaves.
The extracts were loaded to an anion exchange column (DEAE Sephadex A25) for purification. After an overnight digestion with sulfatase (E.C. 3.1.6.1; designated ‘type H-1, from Helix pomatia, Sigma, D) the deslufo-glucosinolates were eluted from the column, vacuum dried and resuspended in a small volume of HPLC grade water for subsequent HPLC analysis (performed by C. Müller, University Würzburg).
Extraction and quantification of free auxin was performed as described by Muller and Weiler (2000; quantification was performed by AG Weiler, University Bochum).
2 Material and Methods 22 2.2.3.11 Dual choice assay with Spodoptera exigua (C. Müller, University Würzburg) Dual-choice assays were performed to study the consumptional preference of the generalist lepidopteran herbivore, Spodoptera exigua (Lepidoptera:Noctuidae). Eggs of S. exigua were provided by Bayer CropScience (Monheim, D) and larvae were kept on artificial diet. Fourth-instar larvae were used in dual-choice assays. Larvae were tested individually in Petri dishes (5.5 cm in diameter) offering them two leaves of equivalent age of different Arabidopsis lines on moistened filter paper for 8 h at 25°C. Leaves were weighed and scanned before and after feeding. Leaf area was analyzed using Winfolia (Regent Instruments Inc.). Three different pair combinations of leaves were provided to each 20 larvae: HIG1-1D and wild-type (Col-0), HIG1-1D and hig1-1, and Col-0 and hig1-1. The consumed fresh weight was calculated by [(weight begin*area end)/area begin].
2.2.4 Molecular biology methods
2.2.4.1 Small scale plasmid preparation from E. coli cells (miniprep)
Small scale plasmid preparations (Miniprep) from E. coli cells were performed with the Biorad Quantum Prep® Plasmid Miniprep Kit according to the protocol provided by the manufacturer.
2.2.4.2 Large scale plasmid preparation from E. coli cells
Large quantities of plasmid DNA were prepared using the QIAGEN Plasmid Midi Kit following the manufacturer’s instructions.
2.2.4.3 Extraction of genomic DNA from plant material (fast prep)
About 50 mg rosette leaves from Arabidopsis were collected in an Eppendorf tube and homogenised in 400 µL extraction buffer (200 mM Tris-HCl, pH 7.5, 250 mM NaCl, 25 mM EDTA, 0.5% (w/v) SDS) and mixed on a vortex. The cell debris were removed by centrifugation (13000 rpm, 5 min) and the supernatant was mixed with 350 µL isopropanol. The samples were incubated for 10 min at RT before the DNA was pelleted by centrifugation (13000 rpm, 15 min). The pellet was washed once with 70% (v/v) ethanol, air dried and resuspended in 50 µL TE.
2.2.4.4 Extraction of total RNA from plant material
Total RNA used for RT-PCR analysis was extracted from plant tissue using TRIzol® reagent (Invitrogen, Karlsruhe) according to the protocol provided by the
2 Material and Methods 23 manufacturer. Total RNA used for microarray hybridisation was isolated according to a modified protocol from Chomczynski and Sacchi (1987). The RNA extraction solution was prepared as follows. First, a pre-solution was prepared (50% (w/v) guanidinium thiocyanate, 0.5% (w/v) sodium laurylsarcosil, 2.5 mM sodium acetate, pH 7), which was autoclaved and stored stable for several months. Prior to use the pre-solution was mixed 1:1 with phenol (DNA grade, water saturated) and β- mercaptoethanol was added to 0.35% (v/v) final concentration. The plant material (0.3 g) was homogenized with liquid nitrogen in a mortar and the powder was resuspended in 2 mL RNA extraction solution. The homogenate was evenly distributed to two 2 mL reaction tubes and briefly incubated at RT. Subsequently, 500 µL of chloroform-isoamyl alcohol (24:1) was added to each tube. The mixture was shaken vigorously and left on ice for 30 min, prior to centrifugation (10 min, 12000 g, 4°C). The upper, aqueous phase was transferred to new tubes and mixed with 1 N acetic acid and ethanol at final concentrations of 0.05% (v/v) and 0.7% (v/v), respectively. The samples were incubated for 30-60 min on ice and the RNA was sedimented by centrifugation (10 min, 14000 g, 4°C). The pellet was resuspended in 800 µL 3M sodium acetate, pH 5.2, centrifuged (10 min, 14000 g, 4°C) and washed twice with 1 mL 80% (v/v) ethanol. The supernatant was removed carefully and the pellet was dried under the fume hood for about 15-20 min. The total RNA was carefully resuspended in 50 µL DEPC treated water.
Quantity and quality of the isolated RNA were tested spectrophotometrically at 260 nm and 280 nm in 50 mM Na2HPO4, pH 7. A ratio of OD260:OD280 between 1.8-2.1 was considered as pure enough for subsequent cDNA or cRNA synthesis for microarray hybridisation.
2.2.4.5 DNase I treatment and reverse transcription
To remove any contaminating genomic DNA from isolated total RNA the samples were treated with RNase-free DNase I (Roche, Mannheim, D) according to the manufacturer’s instructions. About 1-4 µg DNase I treated total RNA were then used for reverse transcription, taking on account never exceeding one fourth of the total reaction volume. Synthesis of cDNA was performed using SuperScript® II Reverse Transcriptase (Invitrogen Life Technologies, Karlsruhe, D) as described in the provided protocol and using oligo dT primers (Metabion, Martinsried, D).
2 Material and Methods 24 2.2.4.6 cRNA synthesis and microarray hybridisation
The Agilent Low RNA Input Fluorescent Linear Amplification Kit was used according to the protocol provided for cRNA synthesis and labelling. Hybridisation of the Agilent Arabidopsis2 22K microarray v4.1 and processing were performed according to the Agilent 60-mer oligo microarray processing protocol.
2.2.4.7 Polymerase Chain Reaction Standard PCR conditions were as follows:
25 µL final volume 50 µL final volume 10x buffer (Qiagen, Stratagene, Biorad) 2.5 µL 5 µL
50 mM MgCl2 0-1 µL 0-2 µL
10 mM dNTPs 0.5 µL 1 µL
10 pmol/µL primer A and B 0.5 µL each 0.5 µL each Taq (Qiagen, Stratagene, Biorad) 1 unit 1-2 units
template DNA 0.5-2 µL
or a single bacteria colony
0.5-2 µL
HPLC grade water to 25 µL to 50 µL
All PCRs were performed on a MJ Research thermocycler (München, D).
Standard cycling conditions were:
cycle number temperature time
1 94°C 2.5-3 min
94°C 30 sec
~5°C<Tm 30 sec 23-32
72°C 1 min/kb
1 72°C 10 min
(Tm indicates the annealing temperature of the primers used) 2.2.4.8 Yeast Colony PCR
A single colony was picked and mixed with 25 µL freshly prepared 0.02 N NaOH. The cells were lysed for 5 min at RT and 2 µL of the lysate was added to the prepared PCR mixture (0.1 mM dNTPs, 10 pmol of primer AD_5N and BD_3N, 1x PCR buffer, 2.5 mM MgCl2, 1.25 U Taq) with a final volume of 50 µL. The cycling conditions were as follows: 94°C (2 min); followed by 40 cycles of 94°C (45 sec) – 50°C (45 sec) – 72°C (2 min) and a final extension at 72°C (5 min).
2 Material and Methods 25 2.2.4.9 Estimation of quantity and size of DNA fragments
DNA fragments were separated electrophoretically on 1% (w/v) agarose gels in 1x TAE buffer. Size and quantity of DNA fragments was estimated by comparison to the 1 Kb DNA ladder (Invitrogen Life Technologies, Karlsruhe, D).
2.2.4.10 Purification of DNA fragments
DNA fragments were either purified after PCR (QIAquick PCR Purification Kit, Qiagen GmbH, Hilden, D) or excised from agarose gels and purified with the QIAquick Gel Extraction Kit (Qiagen GmbH, Hilden, D).
2.2.4.11 Sequencing of DNA fragments
The sequencing reactions were performed with the Big Dye Terminator v3.1 Cycle Sequencing Kit (Applied Biosystems, Foster City, USA) using the following reaction conditions:
DNA 10-100 ng
5x buffer 1 µL
Big Dye v3.1 2 µL Primer (10pmol/µL) 1 µL HPLC grade water to 10 µL The cycling program was as follows:
cycle number temperature time
1 96°C 20 sec
96°C 10 sec
55°C 10 sec
35
60°C 4 min
After termination of the reaction, 10 µL HPLC grade water were added to reach a final volume of 20 µL and the samples were processed in the Insitute of Genetics, University of Cologne on a ABI 3730 Genetic Analyser (PE Applied Biosystems GmbH). The chromatogram files were analysed using the Chromas lite v2.0 software.
2.2.4.12 Classical vector cloning
Unless otherwise stated, all classical cloning procedures were performed as described by Ausubel et al. (1997).
2 Material and Methods 26 2.2.4.13 Gateway® cloning
The Gateway® technology is extensively described on the Invitrogen homepage (http://www.invitrogen.com/content.cfm?pageid=4072). Furthermore, all kits and enzymes used for Gateway® cloning were used according to the manuals provided with modifications regarding reaction volume and time. All reactions were performed in one fifth of the recommended volume to reduce costs, and the reaction time was 30 min to 2 h for TOPO reactions and 3 h to overnight incubation for BP and LR reactions.
3 Results 27
3 Results
3.1 Isolation of the HIG1-1D mutant
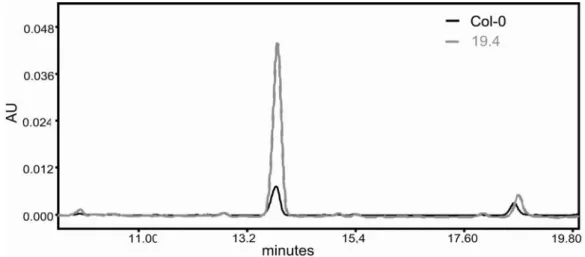
Sequencing of the Arabidopsis genome has revealed that many genes form part of gene families. Examples are transcriptional regulators that, unlike in animals, belong to large families in A. thaliana. Studying the function of these genes by classical knock-out screenings is often limited due to a high functional redundancy. One way to overcome this problem is the use of dominant mutants, such as activation-tagging populations. An artificial transcriptional enhancer (activation-tag) is integrated randomly into the genome as transfer DNA (T-DNA). Integration of the activation-tag in close proximity of a gene can result in the transcriptional upregulation, thereby generating a dominant overexpression line. Several activation-tagging populations have been described, and they have been used successfully to assign functions to so far uncharacterised genes (Weigel et al., 2000; Borevitz et al., 2000). One of these populations is the TAMARA collection, which was employed in a high-through put HPLC screen to identify mutants with an altered secondary metabolite profile (Schneider et al., 2005). Rosette leaves of T1 generation plants grown in the greenhouse were used for the preparation of methanolic extracts and analysis by HPLC according to Reichelt et al. (2002). One of these lines, line 19.4, showed a significant upregulation of a single compound (Fig. 3.1), eluated at 13.8 minutes retention time under the chosen conditions (Schneider et al., 2005). Preparative
Figure 3.1: HPLC profile of rosette leaf extracts taken from wild-type (Col-0) and the activation-tagging line 19.4. The peak at 13.8 minutes retention time is clearly increased in the activation-tagging line and was identified as indol-3-ylmethyl glucosinolate.
3 Results 28 HPLC analysis in combination with mass spectrometry allowed the identification of the compound as indol-3-ylmethyl glucosinolate (I3M; all biochemical analysis were performed by H.-P. Mock, Gatersleben).
The observed accumulation of I3M was stable over four generations and the mutation was shown to be dominant by backcrossing with wild-type. The mutant was therefore called HIG1-1D for High Indolic Glucosinolate 1 – 1 Dominant and was chosen for subsequent detailed analysis.
Since the mutation was generated by T-DNA integration, the site of integration could be identified by TAIL-PCR (performed by T.Gigolashvili, University of Cologne;
Schneider et al., 2005) and was localised on chromosome 1, about 1.4 kb upstream of the At1g18570 locus. To confirm the gene-to-trait relation between the presence of the activation-tagging element and the accumulation of I3M, a segregating F2
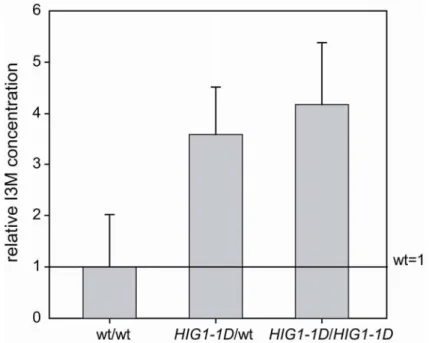
population generated by backcrossing to wild-type, was analysed. The genotype of the F2 individuals was verified by PCR and HPLC analyses were performed to quantify the amount of I3M (Fig. 3.2). Plants carrying the activation-tagging element showed an up to 4-fold accumulation of I3M when compared to wild-type plants.
Plants heterozygous for the activation-tag showed slightly less accumulation than homozygous HIG1-1D plants, indicating that the I3M accumulation might be dosage dependent.
Figure 3.2: Relative I3M concentration of a segregating F2population. Plants heterozygous and homozygous for HIG1-1D showed up to 4-fold increase in I3M accumulation compared to wild-type plants (mean ±SD; n=10).
3 Results 29 3.2 HIG1 encodes an R2R3 MYB transcription factor
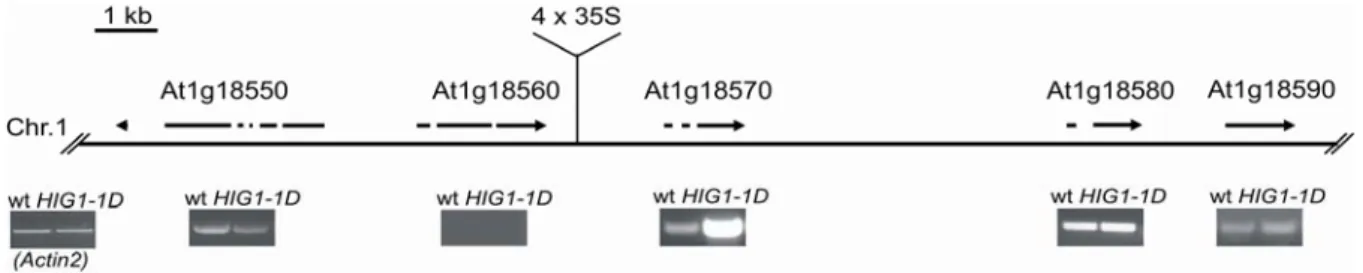
To identify the cause of high I3M accumulation in the HIG1-1D mutant, the candidate genes, surrounding the activation-tag insertion were analysed, since overexpressed genes are often found adjacent to the inserted enhancer (Weigel et al., 2000). The transcript profiles of two genes upstream and three genes downstream of the insertion were analysed by semi-quantitative RT-PCR (T.Gigolashvili, University of Cologne). Only the transcript of At1g18570 was significantly upregulated in the HIG1- 1D mutant, compared to the wild-type control (Fig. 3.3). The transcript of At1g18550 (kinesin motor protein-related) was unchanged, transcription of At1g18560 (transposase-related protein) could not be detected, neither in HIG1-1D nor in wild- type plants. The expression level of At1g18580 (putative galacturonosyl transferase;
Sterling et al., 2006) and At1g18590 (sulfotransferase AtST5c; Piotrowski et al., 2004; Klein et al., 2006) were comparable in the wild-type and the mutant line.
Therefore, the overexpression of At1g18570 appeared to be the cause for I3M accumulation in the HIG1-1D mutant.
At1g18570 encodes for an R2R3-type MYB transcriptional regulator, classified as MYB51 (Stracke et al., 2001). MYB51 is a member of the subgroup 12 of R2R3 MYB factors that share the common motif [L/F]NK[K/R]VA in the carboxy-terminal region (Fig. 3.4). There are five additional members in subgroup 12, with MYB122 being the closest homologue. ATR1/MYB34 has been previously characterised as a regulator of tryptophan biosynthesis (Bender and Fink, 1998) and was shown to play a role in the auxin-glucosinolate homeostasis (Celenza et al., 2005). The other members are currently under investigaton.
Figure 3.3: Schematic representation of the T-DNA integration site of HIG1-1D on chromosome I. The transcript of the indicated loci were analysed by RT-PCR. Only the transcript of At1g18570 was altered in comparison to the wild-type level. Actin2 was used as control.