role of acetylation and deacetylation processes
DISSERTATION ZUR ERLANGUNG DES DOKTORGRADES DER NATURWISSENSCHAFTEN (DR. RER. NAT.)
DER FAKULT ¨AT F ¨UR BIOLOGIE UND VORKLINISCHE MEDIZIN DER UNIVERSIT ¨AT REGENSBURG
vorgelegt von
Sophia Charlotte Pinz, geb. Schabel
aus
Vaihingen an der Enz
im Jahr 2017
Die Arbeit wurde angeleitet von:
PD Dr. Anne Rascle Unterschrift:
Sophia Pinz
ii
An erster Stelle danke ich PD Dr. Anne Rascle f¨ ur die intensive Betreuung w¨ahrend meiner Promotion und f¨ ur die vielen Publikationen, die sie m¨oglich machte.
Meinen Mentoren Prof. Dr. Axel Imhof und Prof. Dr. Joachim Griesenbeck danke ich f¨ ur die wissenschaftlichen Diskussionen. Joachim Griesenbeck danke ich zudem f¨ ur seine Expertise und rund-um-die-Uhr Unterst¨ utzung bei Gelfiltrationsanalysen.
Ich danke Prof. Dr. Daniela M¨annel und dem ganzen Institut f¨ ur Immunologie f¨ ur die Unterst¨ utzung w¨ahrend meiner Promotion und f¨ ur die Nutzung der Labore.
Mein Dank gilt der ganzen ”STAT5 Signaling Research Group” f¨ ur die Zusamme- narbeit. Besonders wertvoll war die exzellente technische Unterst¨ utzung von Lissy und Susanne. Samy, danke f¨ ur die Experimente die du zu dieser Arbeit beigetragen hast.
Bedanken m¨ochte ich mich auch bei Dominik, Philipp, Krystina und Christina, die im Rahmen von Bachelorarbeit oder Praktikum an dieser Arbeit mitwirkten.
F¨ ur den Abschluss meiner Promotion wurde mir ein einj¨ahriges Stipendium durch das
”Bayrische Programm zur Realisierung der Chancengleichheit f¨ ur Frauen in Forschung und Lehre” zuteil.
Martina, danke f¨ ur dein allzeit o↵enes Ohr und f¨ ur deine Ratschl¨age zu meiner Dok- torarbeit.
Mein gr¨oßter Dank gilt meinem Mann Thomas und meiner Tochter Annika. Ohne euch w¨are diese Arbeit nicht zum Abschluss gekommen. Auch meinen Eltern und Schwestern danke ich f¨ ur ihren unersch¨opflichen R¨ uckhalt und f¨ ur ihre vielen motivierenden und aufmunternden Worte. Großer Dank gilt auch meiner Schwiegermutter f¨ ur die vielen Nachmittage die sie mit Annika verbrachte und mir so Zeit zum Schreiben schenkte.
v
1 Summary 1
2 Introduction 3
2.1 Transcription and chromatin . . . . 3
2.1.1 Eukaryotic transcription . . . . 3
2.1.2 Transcription factors . . . . 4
2.1.3 Chromatin . . . . 4
2.1.4 Chromatin acetylation . . . . 5
2.1.5 Bromodomain and extra-terminal (BET) proteins . . . . 6
2.2 Histone deacetylases (HDACs) . . . . 6
2.2.1 HDAC function . . . . 6
2.2.2 Deacetylase inhibitors . . . . 8
2.3 The JAK/STAT signaling pathway . . . . 8
2.3.1 Activation of STAT5 by interleukin-3 . . . . 9
2.3.2 Structure of STAT5 . . . . 10
2.3.3 Function of STAT5A and STAT5B . . . . 11
2.3.4 Transcriptional regulation by STAT5 . . . . 11
2.3.5 Regulation of STAT5 activity . . . . 13
2.3.6 Post-translational modifications of STAT proteins . . . . 14
2.3.6.1 STAT acetylation . . . . 14
2.3.7 STAT5 in cancer . . . . 17
2.4 Objectives . . . . 18
vii
3.1.1 Chemicals and reagents . . . . 21
3.1.2 Bu↵ers . . . . 22
3.1.3 Deacetylase inhibitors and other small molecule compounds for cell treatment . . . . 25
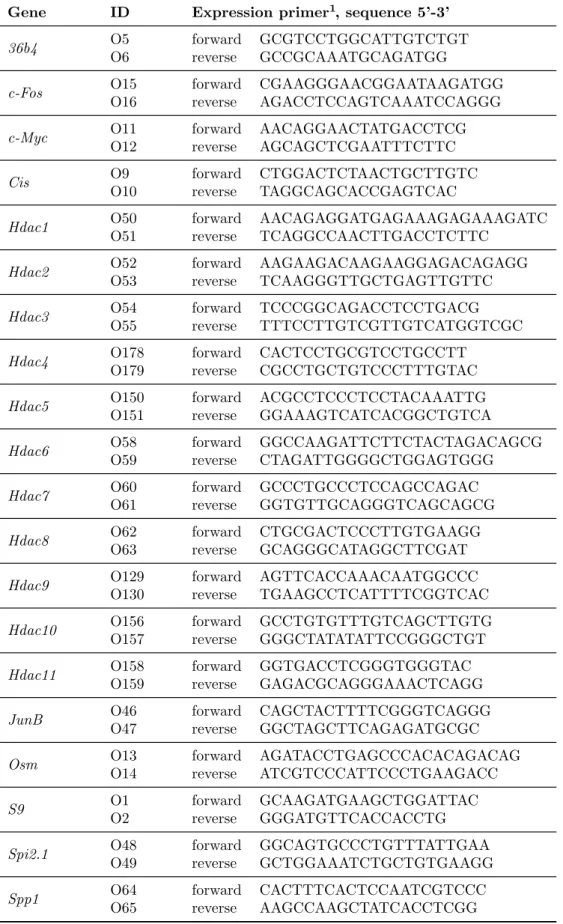
3.1.4 Nucleic acids . . . . 25
3.1.4.1 Nucleotides . . . . 25
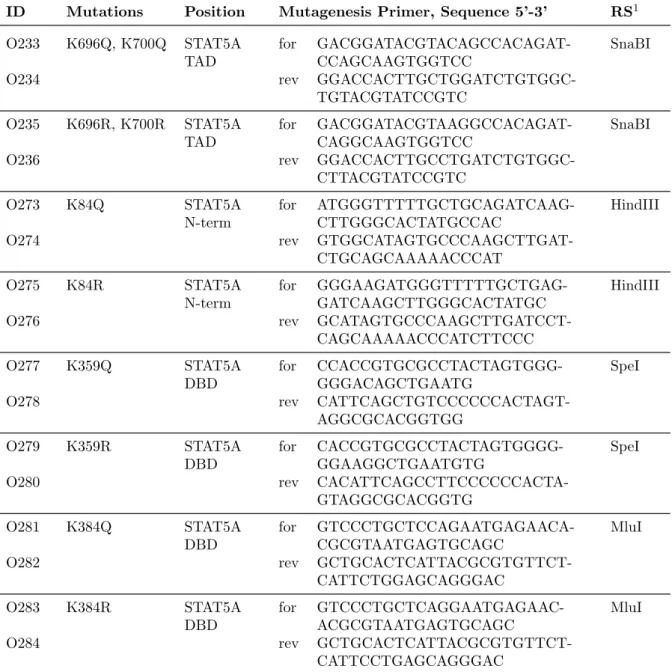
3.1.4.2 DNA-oligonucleotides . . . . 25
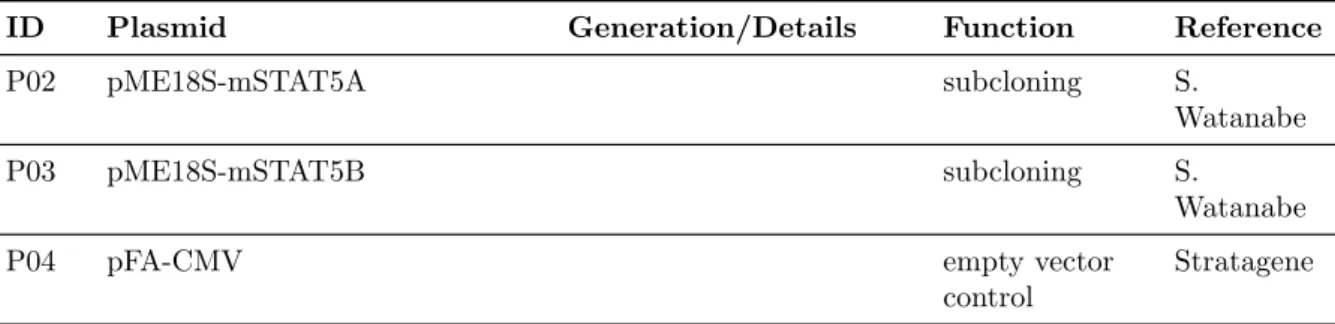
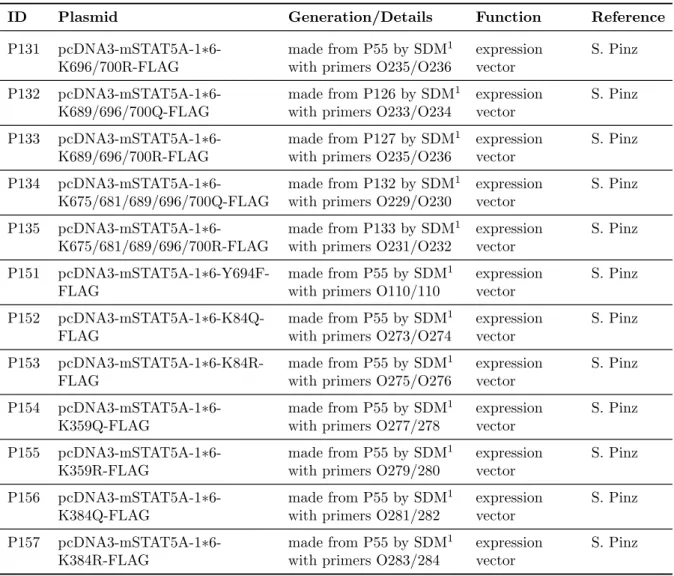
3.1.4.3 Plasmids . . . . 30
3.1.4.4 RNA-oligonucleotides . . . . 33
3.1.5 Enzymes . . . . 34
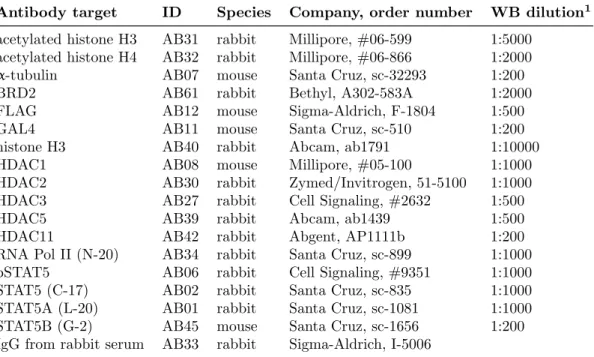
3.1.6 Antibodies . . . . 34
3.1.7 Instruments . . . . 35
3.1.8 Consumables . . . . 35
3.2 Methods . . . . 36
3.2.1 DNA and RNA analysis and methods . . . . 36
3.2.1.1 RNA preparation . . . . 36
3.2.1.2 cDNA synthesis . . . . 36
3.2.1.3 Quantitative real-time polymerase chain reaction (qPCR) 37 3.2.1.4 Gene expression analysis by quantitative reverse tran- scription PCR (quantitative RT-PCR) . . . . 37
3.2.1.5 Phenol extraction . . . . 38
3.2.1.6 Ethanol precipitation . . . . 38
3.2.1.7 Isopropanol precipitation . . . . 38
3.2.1.8 Plasmid preparation . . . . 38
3.2.1.9 DNA quantification by UV spectroscopy . . . . 39
3.2.1.10 PCR cloning . . . . 39
3.2.1.11 Agarose gel electrophoresis . . . . 39
3.2.1.12 Purification of DNA fragments from agarose gel . . . . . 40
3.2.1.13 Restriction enzyme digest . . . . 40
3.2.1.14 Ligation . . . . 40
3.2.1.15 Site-directed mutagenesis . . . . 40
3.2.2 Manipulation of Escherichia coli . . . . 41
3.2.2.1 Escherichia coli (E. coli) cultures in LB medium . . . . 41
3.2.2.2 E. coli glycerol-stock . . . . 41
3.2.2.3 Chemically competent E. coli . . . . 42
viii
3.2.3.1 Cell maintenance . . . . 42
3.2.3.2 Cryopreservation of mammalian cells . . . . 43
3.2.3.3 Thawing of mammalian cells . . . . 43
3.2.3.4 Cell resting and IL-3 stimulation . . . . 44
3.2.3.5 WST1 cytotoxicity assay . . . . 44
3.2.3.6 Plasmid transient transfection of Cos-7 cells by Lipofec- tamine 2000 . . . . 44
3.2.3.7 Plasmid transient transfection of Ba/F3 cells by electro- poration . . . . 45
3.2.3.8 siRNA transfection by electroporation . . . . 45
3.2.4 Preparation of cell lysates . . . . 46
3.2.4.1 Whole-cell brij lysate . . . . 46
3.2.4.2 Freeze-thaw lysate for analysis of histone acetylation . . 46
3.2.4.3 Nuclear and cytosolic lysate . . . . 46
3.2.5 Protein analysis and methods . . . . 47
3.2.5.1 Protein quantification by Bradford protein assay . . . . 47
3.2.5.2 SDS - polyacrylamide gel electrophoresis (SDS-PAGE) . 47 3.2.5.3 Coomassie staining . . . . 47
3.2.5.4 Semi-dry transfer of proteins . . . . 47
3.2.5.5 Ponceau staining . . . . 48
3.2.5.6 Western blot . . . . 48
3.2.5.7 Co-immunoprecipitation . . . . 49
3.2.5.8 Gel filtration chromatography . . . . 49
3.2.6 Dual-luciferase reporter assay . . . . 50
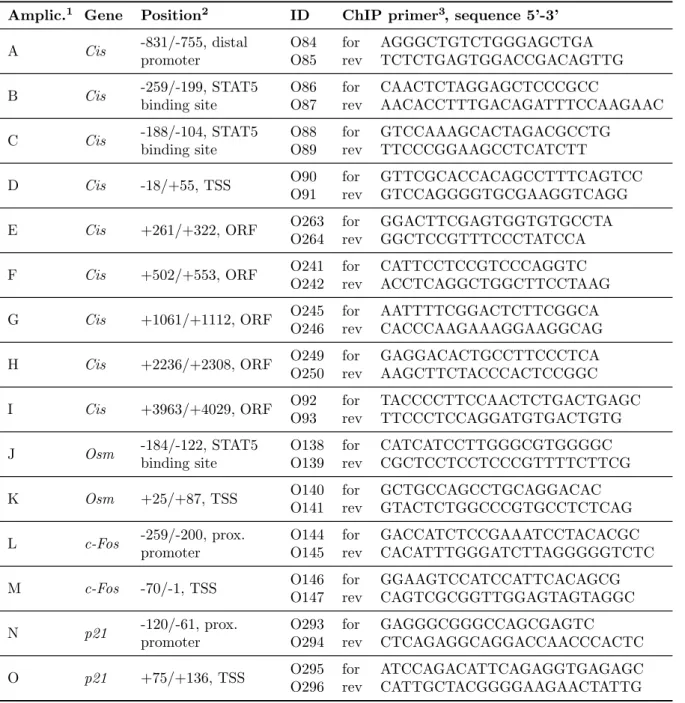
3.2.7 Chromatin immunoprecipitation (ChIP) . . . . 51
3.2.8 Sequence alignments . . . . 54
4 Results 55 4.1 Characterization of the experimental system . . . . 55
4.1.1 Deacetylase inhibitors repress STAT5 target gene expression in Ba/F3 and Ba/F3-1 ⇤ 6 cells . . . . 55
4.2 Identification of the HDAC involved in deacetylase inhibitor-mediated in- hibition of STAT5-mediated transcription . . . . 57
4.2.1 Selective deacetylase inhibitors di↵erentially impair STAT5-mediated transcription . . . . 57
ix
4.2.3 Most HDAC family members are expressed in Ba/F3 cells . . . . 66 4.2.4 Knockdown of HDAC gene expression does not a↵ect
STAT5-mediated transcription . . . . 68 4.3 Identification of the acetylated substrate involved in deacetylase inhibitor-
mediated inhibition of STAT5-mediated transcription . . . . 72 4.3.1 Establishment of a GAL4-STAT5A luciferase reporter assay . . . 72 4.3.2 Mutation of specific lysines of STAT5A-1 ⇤ 6 does not a↵ect
STAT5A-1 ⇤ 6 transcriptional activity in luciferase assays . . . . . 78 4.3.3 Mutation of specific lysine residues does not a↵ect STAT5A-1 ⇤ 6-
mediated activation of endogenous STAT5 target genes . . . . 82 4.3.4 Wild-type latent endogenous STAT5 does not contribute to
STAT5A-1*6-mediated transcription . . . . 86 4.3.5 TSA does not disrupt soluble nuclear STAT5-containing protein
complexes . . . . 88 4.3.6 Inhibition of STAT5-mediated transcription by deacetylase
inhibitors correlates with rapid induction of global chromatin hyperacetylation . . . . 90 4.3.7 TSA treatment induces changes in histone occupancy and acetyla-
tion at multiple genes and di↵erentially a↵ects recruitment of RNA polymerase II . . . . 92 4.4 BRD2 association with the STAT5 target gene Cis is lost upon TSA treat-
ment . . . . 97 4.4.1 BRD2 binds to Cis and is lost upon TSA or JQ1 treatment . . . 98 4.4.2 BRD2 is depleted from the soluble nuclear fraction upon TSA treat-
ment, and is possibly relocated to hyperacetylated chromatin . . . 101 4.4.3 No direct interaction between STAT5 and BRD2 was observed in
solution . . . . 102
5 Discussion 105
5.1 Inhibition of STAT5-mediated transcription by deacetylase inhibitors in- volves histone but not STAT5 acetylation . . . . 105 5.2 Inhibition of STAT5-mediated transcription by deacetylase inhibitors prob-
ably involves redundant class I HDAC activity . . . . 109 5.3 Deacetylase inhibitors inhibit STAT5-mediated transcription by a↵ecting
bromodomain and extraterminal domain (BET) protein function . . . . . 111
x
Publications 119
List of Figures 121
List of Tables 122
Abbreviations 125
References 129
xi
Summary
Activated signal transducer and activator of transcription STAT5 induces the expres- sion of genes essential for cell di↵erentiation, proliferation and inhibition of apoptosis.
Previous work from our group demonstrated that the deacetylase inhibitor trichostatin
A (TSA) attenuates transcriptional activation of STAT5 target genes at a step following
STAT5 binding to its DNA binding sites by abrogating the recruitment of TBP and RNA
polymerase II. The goal of this thesis was to better understand the mechanism of tran-
scriptional regulation by STAT5 via the characterization of the mechanism underlying its
inhibition by TSA. Specific aims were the identification of (i) the deacetylase (so-called
HDAC) involved and of (ii) the acetylated substrate. The identification of the HDAC
was performed using class-selective HDAC inhibitors and siRNA-mediated knock-down
of HDAC expression. We found that, similarly to TSA, the deacetylase inhibitors val-
proic acid (VPA) and apicidin - but not MGCD0103 and MS-275 - inhibited expression of
STAT5 target genes. However, siRNA-mediated knock-down experiments did not allow
to identify the specific HDAC(s) involved in STAT5 target gene expression. To investigate
whether STAT5 might be the acetylated substrate targeted by HDACs, selected lysine
residues within STAT5 potentially targeted for acetylation were mutated and their ef-
fect on STAT5-mediated transcription was investigated. None of the mutations a↵ected
STAT5 transcriptional activity, arguing against STAT5 being the acetylated substrate
targeted by the sought HDAC. Interestingly however, inhibition of STAT5-mediated tran-
scription by TSA, VPA and apicidin correlated with an increase in global histone H3 and
H4 acetylation. It also correlated with a redistribution of the acetylated-histone-binding
protein BRD2, a member of the bromodomain and extra-terminal (BET) protein family
described for its role in the recruitment of the transcriptional machinery and transcrip-
tional activation. Notably, chromatin precipitation experiments revealed that BRD2 is
associated with the actively-transcribed STAT5 target gene Cis in a STAT5-dependent
manner, and that BRD2 binding to Cis is lost upon TSA treatment. In agreement with
a role of BRD2 in STAT5-mediated transcription, the BET inhibitor (+)-JQ1 inhibited
STAT5-mediated transcription of the Cis gene. Together, our data support a model in
which the HDAC inhibitors TSA, VPA and apicidin target histone acetylation, result-
ing in a global increase in chromatin acetylation. This change in chromatin acetylation
would result in the redistribution of BRD2 to hyperacetylated chromatin and a departure
of BRD2 from STAT5 target genes. BRD2 loss at STAT5 target genes would in turn pre-
vent the proper recruitment and maintenance of the transcriptional machinery, resulting
in transcriptional inhibition. In summary, this thesis identified BRD2 as an important
co-factor of STAT5-mediated transcription and demonstrated that deacetylase inhibitors
inhibit STAT5-mediated transcription by interfering with BRD2 function. This study
thus identified BRD2 as a potential target for the development of novel therapies against
STAT5-associated cancers.
Introduction
2.1 Transcription and chromatin
2.1.1 Eukaryotic transcription
In eukaryotes, transcriptional activation of a protein-coding gene is the result of a promoter-specific combinatorial interplay between site-specific transcription factors and the cofactors they recruit (Hill & Treisman, 1995; M´etivier et al., 2003; Rem´enyi et al., 2004; Venters & Pugh, 2009). Transcription factors bind to specific DNA recognition sequences, which are usually located within promoters adjacent to the regulated gene or within distal enhancers. Enhancers are brought in close proximity to the regulated gene through long-range chromatin looping (Whalen et al., 2016). DNA-bound transcription factors recruit co-activators or co-repressors, multiprotein complexes, and components of the basal transcription machinery to assist the assembly of the pre-initiation complex and eventually enable initiation of transcription by RNA polymerase II (Pfitzner et al., 1998; Nakajima et al., 2001; M´etivier et al., 2003). Many of the interaction partners of transcription factors are chromatin remodeling or modifying complexes, demonstrating the importance of chromatin composition and physical accessibility of DNA for transcription processes (Pfitzner et al., 1998; Xu et al., 2007; Venters & Pugh, 2009;
Tang et al., 2013).
2.1.2 Transcription factors
Transcription factors are key mediators of transcription initiation. Thus, the regulation of transcription factor availability and activity is a central control parameter of gene expression. Transcription factor availability can be regulated, for example, at the level of their production, degradation or subcellular localization (Baeuerle & Baltimore, 1988;
Wang et al., 1999; Rodriguez et al., 2000). Transcription factor activity is frequently modulated by post-translational modifications like phosphorylation, acetylation, methy- lation, ubiquitylation or SUMOylation (Shuai et al., 1993; Rodriguez et al., 2000; Rogers et al., 2003; Chuikov et al., 2004; Yuan, 2005; Venne et al., 2014). Phosphorylation is the post-translational modification best known to activate or inhibit transcription fac- tors, but it is evident that lysine acetylation has also tremendous impact on transcription factor activity. Acetylation of transcription factors like p53, E2F1, nuclear factor-B (NF-B), and signal transducers and activators of transcription (STATs) can modulate their activity at key steps such as protein stability, cellular localization, affinity for DNA or protein-protein interactions (Mart´ınez-Balb´as et al., 2000; Li et al., 2002; Kiernan et al., 2003; Kr¨amer et al., 2006; Tang et al., 2007; Spange et al., 2009).
2.1.3 Chromatin
In the eukaryotic nucleus, chromosomal DNA and several associated proteins form a structure called chromatin. The basic unit of chromatin is the nucleosome consisting of a histone protein octamer core around which the DNA is wrapped in nearly two turns.
The histone octamer itself consists of two histone H2A / histone H2B heterodimers and two histone H3 / histone H4 heterodimers (Luger et al., 1997). Successive nucleosomes and the linker DNA between them produce a beads-on-a-string-like conformation (Olins
& Olins, 1974). Several additional layers of compaction follow until the highly condensed heterochromatin is formed. By contrast, euchromatin is less compacted and the DNA is more accessible. It is therefore not surprising that most of the transcribed genes are found in euchromatin (Grewal & Moazed, 2003; DesJarlais & Tummino, 2016).
Besides its stabilizing and compacting function, chromatin is a level of regulation for fundamental cellular processes like DNA replication, DNA repair and transcription.
DNA which is tightly wrapped around the histone octamer core is less accessible for binding of regulatory proteins, transcription factors or other DNA binding proteins (Lorch et al., 1987; Cˆot´e et al., 1994; Tse et al., 1998; Lorch & Kornberg, 2015; DesJarlais &
Tummino, 2016). For instance, nucleosome depletion increases transcription in vivo (Han
& Grunstein, 1988), and nucleosomes occluding certain elements within the promoter can
inhibit in vitro transcription initiation by RNA polymerase II (Lorch et al., 1987).
Despite having preferential positioning sequences (Kaplan et al., 2009), nucleosomes are dynamic in that they can be shifted along the DNA by ATP-dependent chromatin remodeling complexes such as SWI/SNF (Hirschhorn et al., 1992; Cˆot´e et al., 1994; L¨angst
& Becker, 2004; Venters & Pugh, 2009) or can be dis- and reassembled through histone chaperones such as FACT (facilitates chromatin transcription complex) (Belotserkovskaya et al., 2003) and BRD2 (bromodomain-containing protein 2) (LeRoy et al., 2008). In a genome-wide analysis it has recently been demonstrated that nucleosome repositioning is a general mechanism of the regulation of transcription (Nocetti & Whitehouse, 2016). In addition to remodeling, chromatin can be covalently modified, especially at the accessible histone N-termini, to create binding sites for specific chromatin binding proteins. In doing so, chromatin remodelers together with chromatin modifiers establish a chromatin structure restrictive or permissive for transcription to enable the cell to proceed through the cell cycle and adapt to external or developmental stimuli (DesJarlais & Tummino, 2016; Nocetti & Whitehouse, 2016).
2.1.4 Chromatin acetylation
Chromatin acetylation is established by a tightly controlled balance between histone acetyltransferases (HATs, e.g. p300/CBP) and histone deacetylases (HDACs). Acetyla- tion of histones takes place at their accessible amino-termini, which protrude from the nucleosomal core. The main acetylation sites of histone H3 are lysine residues K9, K14, K18 and K23 while histone H4 acetylation sites are K5, K8, K12 and K16 (Thorne et al., 1990).
The established pattern of histone acetylation together with histone methylation, ubiquitylation and other post-translational modifications generates a histone modification pattern (Jenuwein & Allis, 2001; Agalioti et al., 2002; Guccione et al., 2006; Tang et al., 2013), which can be recognized and bound by certain ”reader” proteins, most of which have transcriptional, chromatin maintenance or sca↵olding functions (Jacobson et al., 2000; Jacobs & Khorasanizadeh, 2002; Kasten et al., 2004; Denis et al., 2006; Zeng et al., 2008).
Bromodomains, for example, recognize acetylated lysine residues of proteins and thus direct di↵erent bromodomain-containing proteins to acetylated chromatin (Jacob- son et al., 2000). The double bromodomain-containing protein BRD2, member of the bromodomain and extra terminal (BET) family of proteins, favors binding to acetylated H4K12 and is as such a specific chromatin ”reader” protein (Kanno et al., 2004).
In general, histone acetylation has been correlated with transcriptional activity (All-
frey et al., 1964; Allegra et al., 1987; Hebbes et al., 1988; Sch¨ ubeler et al., 2004; Roh
et al., 2005). It has been postulated that lysine acetylation of histones, reducing the
positive charge of the histone tail, decondenses the chromatin structure and thus facil- itates access of regulatory proteins to chromatin (Luger et al., 1997; Tse et al., 1998;
Shogren-Knaak et al., 2006). However, upon histone deacetylase inhibitor treatment, inducing global histone hyperacetylation, the expression of only a small subset of genes is changed, and in most cases about half of the a↵ected genes are downregulated (Glaser et al., 2003; Peart et al., 2005; Daly & Shirazi-Beechey, 2006; Rada-Iglesias et al., 2007;
Halsall et al., 2015). When looking at the promoter context, it is evident that both, acetylation as well as deacetylation processes are associated with transcriptional activity (Agalioti et al., 2000; Deckert & Struhl, 2001; Rascle et al., 2003; Kurdistani et al., 2004;
Aoyagi & Archer, 2007; Lin et al., 2014; Greer et al., 2015).
2.1.5 Bromodomain and extra-terminal (BET) proteins
One protein family of acetyl-histone binding proteins is the bromodomain and extra- terminal (BET) protein family. The mammalian BET family consists of bromodomain- containing protein 2 (BRD2), BRD3, BRD4 and BRDT. Their two N-terminal bromod- omains bind to "-amino-acetylated lysine residues of histones (Dey et al., 2003; Pivot- Pajot et al., 2003; Kanno et al., 2004; LeRoy et al., 2008; Morini`ere et al., 2009). In addition, they have a conserved extra-terminal domain, which mediates protein-protein interactions (Belkina & Denis, 2012). BET proteins are transcriptional regulators. They interact with chromatin modifying and remodeling complexes, transcriptional cofactors or components of the transcription machinery (Crowley et al., 2002; Denis et al., 2006;
Peng et al., 2007; LeRoy et al., 2008; Rahman et al., 2011; Wang et al., 2012; Hnilicov´a et al., 2013; Greer et al., 2015).
BET proteins are very similar, especially BRD2 and BRD4 whose bromo- and extra- terminal domains are about 80% identical by sequence (Belkina & Denis, 2012). This structural similarity might contribute to a certain degree of functional redundancy be- tween members of the BET family, for example during inflammation responses (Belkina et al., 2013). By contrast, their developmental functions are rather specific, since other family members cannot rescue embryonic lethal BRD2
nullor BRD4
nullknockout mice (Houzelstein et al., 2002; Gyuris et al., 2009; Shang et al., 2009).
2.2 Histone deacetylases (HDACs)
2.2.1 HDAC function
Histone deacetylases (HDACs) remove covalently attached acetyl groups from "-amino-
of cytosolic as well as nuclear non-histone substrates, many of which are transcription factors (Choudhary et al., 2009; Spange et al., 2009). Although HDACs are part of several co-repressor complexes (Kelly & Cowley, 2013) and their opposing HATs are gen- erally seen as co-activators (Holmqvist & Mannervik, 2013), HDACs as well as HATs are both associated with transcriptional repression and activation (Nusinzon & Horvath, 2003; Zupkovitz et al., 2006; Aoyagi & Archer, 2007; Wang et al., 2009; Holmqvist &
Mannervik, 2013; Lin et al., 2014). Owing to the many proteins and genes regulated by acetylation, HDACs are essential regulators of important cellular processes such as cell-cycle progression and apoptosis (Dangond et al., 1998; Lagger et al., 2002; Zhu et al., 2004; Huang et al., 2005; Ropero & Esteller, 2007; Ji et al., 2014; Dasgupta et al., 2016).
Furthermore, HDACs a↵ect homeostasis and di↵erentiation of various cell types, for in- stance in cardiovascular, immune, and nervous system, in kidney and in epidermis (Bai et al., 2005; Chen et al., 2011; Robertson et al., 2012; Nural-Guvener et al., 2014; Sun et al., 2014; Mathias et al., 2015; Hull et al., 2016).
Mammalian deacetylases can be grouped into 4 di↵erent HDAC classes based on primary structure and phylogenetic analysis (Gregoretti et al., 2004). HDAC class 1 contains HDAC1, 2, 3, and 8, which are ubiquitously expressed in most tissues and localize predominantly to the nucleus. Class II HDACs are subdivided into subclass IIA, containing HDAC4, 5, 7, and 9, and into subclass IIB, containing HDAC6 and 10.
Class II HDACs show a higher degree of cell type-specific expression and typically shuttle between nucleus and cytoplasm. HDAC11 is the most recently discovered HDAC and the sole member of class IV HDACs. HDAC’s class III contains the sirtuins (SIRT1-7) which are unrelated to the eleven classical HDACs (class I, II and IV) in terms of sequence and catalytic mechanism (Frye, 2000; Tanner et al., 2000; Ropero & Esteller, 2007).
Class IIA HDACs (HDAC4, 5, 7, 9) have only minor enzymatic deacetylase activity towards acetylated histone tails (Fischle et al., 2001, 2002; Lahm et al., 2007; Lobera et al., 2013; Di Giorgio et al., 2015), and HDAC6 is localized predominantly in the cyto- plasm (Verdel et al., 2000), where ↵-tubulin is one of its main substrates (Liu et al., 2015).
Therefore the major HDACs responsible for histone deacetylation are the mainly nuclear class I HDACs. HDAC1 and HDAC2 proteins are 80% identical in sequence (Dovey et al., 2013) and catalytic members of the same multiprotein chromatin modifying com- plexes. Those complexes are NuRD (nucleosome remodeling and deacetylation), CoRest (co-repressor for element-1- silencing transcription factor) and Sin3 (Kelly & Cowley, 2013). Biochemically, HDAC1 and HDAC2 make up most of the cellular HDAC activity.
Their co-knockdown in T cells leads to almost 60% reduction of total nuclear histone
deacetylase activity (Dovey et al., 2013). HDAC3 deacetylates histones as catalytic core
of SMRT/NCoR (silencing mediator of retinoid and thyroid hormone receptors/nuclear
receptor co-repressor) (You et al., 2013), while HDAC8 also deacetylates histones, but seems to be active without incorporation into a protein complex (Wolfson et al., 2013).
2.2.2 Deacetylase inhibitors
Classical HDACs (class I, II and IV) have a similar catalytic core and contain a catalytic divalent metal ion like Zn
2+in their active center (Arrowsmith et al., 2012; Nechay et al., 2016). Deacetylase inhibitors occupy the acetyl-lysine channel of the active site and can be classified based on the metal ion binding group into hydroxamic acids (e.g.
trichostatin A (TSA), suberoylanilide hydroxamic acid (SAHA)), benzamides (e.g. MS- 275, MGCD0103), carboxylic acids (e.g. valproic acid and butyrate), and cyclic peptides (e.g. apicidin). Due to their di↵erent catalytic mechanism, which depends on NAD
+as cofactor, sirtuins are not inhibited by the same inhibitors as the classical deacetylases (Tanner et al., 2000; Mai et al., 2005; Arrowsmith et al., 2012).
Several deacetylase inhibitors are currently undergoing clinical trials and four deacety- lase inhibitors (SAHA, Romidepsin, Belinostat and Panbinostat) have been approved by the United States Food and Drug Administration for the treatment of certain hema- tologic cancers (Grant et al., 2007; Laubach et al., 2015; Lee et al., 2015; Foss et al., 2016; Yoon & Eom, 2016). Deacetylase inhibitors a↵ect cancer at several di↵erent levels (Bolden et al., 2006). They induce cell death of cancer cells through various pathways (Ruefli et al., 2001; Ungerstedt et al., 2005; Gaymes et al., 2006), and lead to cell cycle arrest and senescence (Peart et al., 2005; Xu et al., 2005; Romanov et al., 2010). In addition, deacetylase inhibitors impair tumor angiogenesis as well as cancer cell migra- tion and invasion (Kim et al., 2001; Jeon & Lee, 2010; Han et al., 2014; Hakami et al., 2016). In contrast to cancer cells, normal cells are relatively weakly a↵ected by deacety- lase inhibitor-mediated cell death, which contributes to the big interest in deacetylase inhibitors for therapeutic intervention in malignant neoplastic diseases (Burgess et al., 2004; Ungerstedt et al., 2005; Bolden et al., 2006; Gaymes et al., 2006).
2.3 The JAK/STAT signaling pathway
Signaling pathways allow cells to communicate and to react to external stimuli. Signals are transmitted via membrane bound receptor into the cell and further into the nucleus where the gene expression profile is changed in response to the respective signal. Of special importance and conserved from slime molds and insects to mammals is the JAK/STAT signaling pathway (Perrimon & Mahowald, 1986; Hou et al., 1996; Yan et al., 1996;
Darnell, 1997; Kawata et al., 1997; Luo & Dearolf, 2001).
In mammals, the family of Janus kinases (JAK) is constituted by four nonreceptor tyrosine kinases (JAK1, JAK2, JAK3 and Tyk2). They associate with the cytosolic domain of class I and class II cytokine receptors, which themselves lack a catalytic kinase domain. The cytokine receptor undergoes conformational changes upon ligand binding, which brings the associated JAKs in close proximity and thus enables JAK activation by trans-autophosphorylation. Subsequently, JAKs phosphorylate tyrosine residues in the cytoplasmic domain of the receptor, creating docking sites for signal transducers and activators of transcription (STAT) (Hou et al., 1994; Lin et al., 1995).
There are seven known STATs in mammalian cells: STAT1, STAT2, STAT3, STAT4, STAT5A, STAT5B and STAT6. In the unstimulated cell, they reside as latent transcrip- tion factors in the cytoplasm. Following binding to the phosphorylated receptor, STATs themselves are phosphorylated by the JAK kinases at a highly conserved tyrosine residue in the C-terminal domain. This phosphorylation activates STAT proteins. It provides the prerequisite for STAT homo- or heterodimerization, nuclear translocation, DNA binding and induction of target genes (Grimley et al., 1999; Haan et al., 2006; Schindler & Plum- lee, 2008). STAT heterodimers have been described between STAT1 and STAT2, STAT1 and STAT3, as well as between STAT5A and STAT5B (Ghislain et al., 2001; Ginter et al., 2012; Boehm et al., 2014).
2.3.1 Activation of STAT5 by interleukin-3
STAT5, originally named mammary gland-specific nuclear factor (MGF) (Schmitt-Ney et al., 1992) is an essential mediator of many di↵erent cytokines, growth factors or hor- mones like interleukin(IL)-2, IL-3, IL-5, granulocyte-macrophage colony-stimulating fac- tor (GM-CSF), growth hormone, erythropoietin and prolactin. Proliferation and sur- vival of the murine pro-B cell line Ba/F3, the model system of this work, depends on interleukin-3 (IL-3) and the subsequent activation of STAT5 (Rodriguez-Tarduchy et al., 1990; Mui et al., 1995; Nelson et al., 2004).
The IL-3 receptor consists of the IL-3-specific receptor ↵-chain and the common -chain (shared by IL-3, IL-5 and GM-CSF). As class I cytokine receptor, the IL-3 receptor does not have intrinsic tyrosine kinase activity, which is instead provided by the associated cytoplasmic tyrosine kinase JAK2. JAK2 is the predominant -chain- activating kinase and the most common JAK kinase involved in the activation of STAT5 by class I cytokines (Grimley et al., 1999; Martinez-Moczygemba & Huston, 2003).
Besides activating the STAT pathway, signaling through the common -chain receptor
also activates the mitogen-activated protein kinase (MAPK) and phosphatidylinositol
3-kinase/AKT signaling pathways (Dijkers et al., 1999). Downstream of the MAPK
pathway, IL-3-inducible genes such as c-Fos and JunB are activated (Hodge et al., 1998;
Rascle et al., 2003).
2.3.2 Structure of STAT5
Like all STAT proteins, STAT5 has a modular structure of seven conserved protein do- mains (Fig. 4.9): N-terminal domain, coiled-coil domain, DNA binding domain, linker- domain, Src-homology-2 domain (SH-2), phosphotyrosine tail segment and transactiva- tion domain (Grimley et al., 1999). Structural and functional information of STATs is derived mainly from crystallographic data on STAT1, STAT3 and STAT4 (Becker et al., 1998; Chen et al., 1998; Vinkemeier et al., 1998) as well as mutagenic and biochemical studies (Moriggl et al., 1996).
The N-terminal domain is an independently folded structure, which is involved in nuclear export (Shin & Reich, 2013) and STAT tetramerization. Tetramerization is me- diated through N-terminal interactions between STAT dimers and thus promotes coop- erativity upon binding to tandem response elements, for instance during the STAT5- dependent regulation of Cis or the IL-2 receptor ↵ gene (Xu et al., 1996; Matsumoto et al., 1997; Verdier et al., 1998; Vinkemeier et al., 1998; John et al., 1999; Soldaini et al., 2000; Lin et al., 2012).
The SH-2 domain, a phosphotyrosine binding domain, is the most conserved domain among the members of the STAT family. It is essential for STAT recruitment to the phosphorylated receptor and for subsequent formation of the transcriptionally active STAT dimer. STAT dimerization occurs through reciprocal interactions between the SH-2 domain of one monomer and the phosphotyrosine of the other monomer (Grimley et al., 1999).
The short phosphotyrosine tail segment between SH-2 and transactivation domain contains the conserved tyrosine (Y694 of STAT5A and Y699 of STAT5B) whose phos- phorylation is required for STAT dimerization (Grimley et al., 1999).
The transactivation domain, located at the C-terminus, is the most divergent domain
between the members of the STAT family in general and between STAT5A and B in
particular (Grimley et al., 1999; Lim & Cao, 2006). It is required and sufficient for induc-
tion of gene expression. C-terminally truncated STAT5 isoforms are dominant-negative
transcriptional regulators (Moriggl et al., 1996; Meyer et al., 1998; Epling-Burnette et al.,
2002), and GAL-4 fusion proteins containing only the C-terminal transactivation domain
of STAT5A can activate reporter genes in GAL-4 luciferase reporter assays (Moriggl et al.,
1996).
2.3.3 Function of STAT5A and STAT5B
Duplication of the STAT progenitor gene, giving rise to the homologous Stat5a and Stat5b genes, seems to be the most recent event in the evolution of STATs (Barillas-Mury et al., 1999). Human STAT5A and B proteins share a sequence similarity of 95% (Grimley et al., 1999).
STAT5A and B are important regulators of cell proliferation, di↵erentiation and apop- tosis (Grimley et al., 1999; Nosaka et al., 1999) and are relevant for liver metabolism (Udy et al., 1997), mammary gland development (Liu et al., 1997), immunoregulation (Snow et al., 2003) and hematopoiesis (Moriggl et al., 1999; Shelburne et al., 2003; Li et al., 2007). STAT5A and B have many overlapping, but also independent functions (Schindler
& Plumlee, 2008). The most striking di↵erence is the predominant role of STAT5A for prolactin signaling during mammary gland development and lactation (Liu et al., 1997;
Metser et al., 2015), while STAT5B plays a key role in the development of T cells and growth hormone-dependent regulation of body growth (Udy et al., 1997; Chia et al., 2006; Nadeau et al., 2011; Villarino et al., 2016). In addition, it becomes increasingly appreciated that STAT5A and B exert distinct roles during carcinogenesis (Leong et al., 2002; Ren et al., 2002; Kazansky et al., 2003; Tang et al., 2010).
2.3.4 Transcriptional regulation by STAT5
Functional DNA recognition sites for STAT5 are usually located within the promoter of regulated genes like Cis, Osm and Spi2.1, but can also be found within introns or distal enhancers, as the case for Id-1 and c-Myc (Basham et al., 2008; Pinz et al., 2016).
Consistently, genome-wide analysis of STAT5 distribution using ChIP-sequencing showed a clustering of STAT5 binding around transcription start sites, and STAT5 binding was also detected at distal loci (Nelson et al., 2004; Villarino et al., 2016).
STAT5A and STAT5B recognize the same consensus DNA binding sequence (TTC- NNNGAA) (Soldaini et al., 2000; Ehret et al., 2001), but subtle DNA sequence variations can favor one STAT5 over the other (Frasor et al., 2001). In addition to their di↵er- ent specificity regarding the DNA binding sequence, the STAT5A and STAT5B homo- and heterodimers also have di↵erent specificity regarding the presence of dimeric versus tetrameric STAT5 binding sites (Boucheron et al., 1998; Verdier et al., 1998; Soldaini et al., 2000). Accordingly, our group and others (Nelson et al., 2004; Basham et al., 2008;
Kanai et al., 2014) demonstrated that STAT5A and STAT5B di↵erentially contribute
to the regulation of di↵erent STAT5 target genes. While some genes show redundant
regulation by STAT5A and STAT5B, other genes require the presence of both STAT5
paralogs or show a preference for STAT5A or STAT5B (Nelson et al., 2004; Basham et al.,
2008; Kanai et al., 2014). Cell type-specific protein levels of STAT5A and STAT5B shift the balance between the di↵erent STAT5 dimers and thus influence STAT5 target gene expression (Metser et al., 2015; Villarino et al., 2016). The carboxy-terminal transactiva- tion domain of STAT5 is the most divergent domain between STAT5A and STAT5B and might contribute to di↵erences in gene regulation (Grimley et al., 1999), possibly through di↵erent interactions with regulatory proteins. However, no paralog-specific cofactor has been described so far.
During regulation of transcription, STAT5 proteins interact or cooperate with other transcription factors (Mukhopadhyay et al., 2001; Wyszomierski & Rosen, 2001; Magn´e et al., 2003), nuclear receptors (Engblom et al., 2007), transcriptional co-activators or -repressors (Pfitzner et al., 1998; Nakajima et al., 2001) as well as chromatin modifiers and remodelers (Xu et al., 2007; Mandal et al., 2011). For instance, during the well- studied induction of the STAT5 target gene -casein during mammary epithelial di↵er- entiation, STAT5 cooperates with the transcription factor c-EBP and interacts with the nuclear glucocorticoid receptor (GR), the chromatin remodeling complex SWI/SNF, as well as the coactivators p300/CBP and NCoA-1 (Pfitzner et al., 1998; Wyszomierski &
Rosen, 2001; Litterst et al., 2003; Xu et al., 2007). Consistent with the current model of transcriptional regulation (Venters & Pugh, 2009), STAT5 is a core element of promoter- specific multifunctional protein complexes which induce gene expression (Villarino et al., 2015).
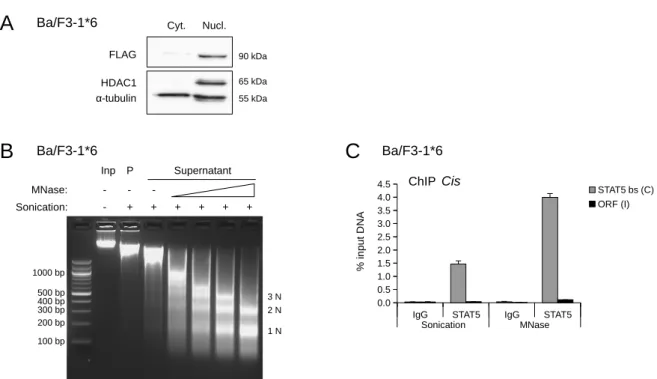
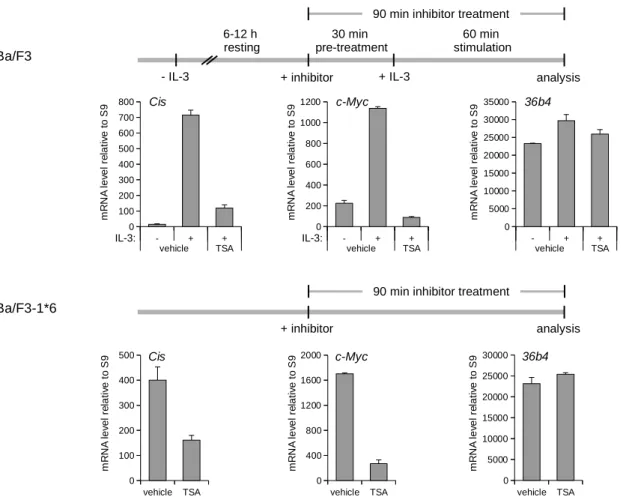
It has been shown that a deacetylase activity is required for transcriptional activation by STAT5 (Rascle et al., 2003; Sebasti´an et al., 2008). Within a treatment of up to 2 h, the deacetylase inhibitor trichostatin A (TSA) reduced expression of all normally induced STAT5 target genes in IL-3-stimulated Ba/F3 cells, while only few non-target genes were inhibited (Rascle et al., 2003). Deacetylase inhibitor treatment leaves STAT5 phospho- rylation, nuclear translocation and DNA binding una↵ected. Instead, it inhibits STAT5 target gene expression by impairing the recruitment of the transcription machinery to the transcription start site of STAT5 target genes. Interestingly, further experiments indicated that the HDAC inhibitor TSA does not increase histone H3 and H4 acetyla- tion levels around the promoter of the STAT5 target gene Cis and Osm (Rascle & Lees, 2003; Rascle et al., 2003), nor does it a↵ect chromatin remodeling at the Cis promoter (Rascle et al., 2003). These findings suggested that the observed inhibition of STAT5 target gene expression by deacetylase inhibitors is not mediated through chromatin and hyperacetylated histones, but rather through an acetylated non-histone protein.
Despite a predominant role in transcriptional activation, STAT5 can also repress tran-
scription. Alternative splicing or proteolytic cleavage can lead to loss of the C-terminal
transactivation domain of STAT5, producing dominant negative STAT5 isoforms (Moriggl
et al., 1996; Meyer et al., 1998; Epling-Burnette et al., 2002). Furthermore, in pro-B cells, STAT5 tetramers recruit the histone methyltransferase EZH2 to guide H3K27me3 modifi- cations to the Igk locus (encoding the immunoglobulin -chain complex) and thus repress transcription of this locus (Mandal et al., 2011). Based on genome-wide ChIP-sequencing data, it was further proposed that for many genes recruitment of STAT5 to tetrameric binding sites correlates with H3K27 trimethylated histones and gene repression (Mandal et al., 2011). By contrast, another report demonstrated that in T cells STAT5 tetramers preferentially mediate transcriptional activation (Lin et al., 2012). Thus, the functional role of STAT5 tetramers has not yet been clarified. Interaction of STAT5 with the nuclear receptor co-repressor SMRT has been reported, but the function of SMRT seems to be sig- nal attenuation and downregulation of STAT5 activity, rather than active transcriptional gene repression (Nakajima et al., 2001).
2.3.5 Regulation of STAT5 activity
Tight control of STAT5 activity is essential to ensure an appropriate signal intensity and duration. In a normal cell, rapid STAT5 phosphorylation, nuclear accumulation and induction of target gene expression is followed by gradual signal decay involving consti- tutively expressed regulators such as phosphatases and PIAS, as well as the inducible members of the suppressors of cytokine signaling (SOCS) protein family. STAT5 signal- ing is furthermore attenuated by degradation of nuclear STAT5 via ubiquitin-proteasome pathway (Chen et al., 2006) and by receptor down-regulation (Martinez-Moczygemba et al., 2007).
Phosphatases from three di↵erent families have been implicated in negatively regu- lating the JAK/STAT pathway. First, there are the mainly cytoplasmic Src homology phosphatases SHP-1 and SHP-2, which can directly dephosphorylate STAT5 or act on the tyrosine phosphorylated JAK and receptor (Yi et al., 1993; Klingm¨ uller et al., 1995;
Paling & Welham, 2002; Chen et al., 2004). Second, phosphotyrosine phosphatase 1B (PTP1B), T cell protein tyrosine phosphatase (TC-PTP) and the nuclear splice variant TCP45 dephosphorylate and thus inactivate JAK kinases (Myers et al., 2001; Simon- cic et al., 2002; Johnson et al., 2010) or STATs (ten Hoeve et al., 2002; Kr¨amer et al., 2009). Third, the transmembrane phosphotyrosine phosphatase CD45 dephosphorylates and inactivates JAKs (Irie-Sasaki et al., 2001).
Protein inhibitor of activated STAT 3 (PIAS3) interacts with STAT5 and represses its transcriptional activity probably through interference with STAT5 DNA binding ability (Rycyzyn & Clevenger, 2002).
Among the eight SOCS family members, cytokine-induced SH2-domain-containing
protein (CIS), SOCS1, SOCS2 and SOCS3 were shown to be direct STAT5 target genes
and negative feedback regulators involved in the attenuation of STAT5 signaling (Mat- sumoto et al., 1997; Tam et al., 2001; Vidal et al., 2007; Basham et al., 2008; Bachmann et al., 2011; Vitali et al., 2015). They compete with STAT5 for binding sites at the re- ceptor, or inhibit the kinase activity of JAKs (Endo et al., 1997; Matsumoto et al., 1997;
Ram & Waxman, 1999; Sasaki et al., 1999).
2.3.6 Post-translational modifications of STAT proteins
Phosphorylation of a highly conserved tyrosine residue within the phosphotyrosine tail segment is required for the formation of transcriptionally active STAT dimers (Grimley et al., 1999). In addition, serine phosphorylation within the transactivation domain has been shown to influence the activity of several STAT proteins (Decker & Kovarik, 2000).
Serine phosphorylation of STAT5 has been demonstrated, but its biological significance remains to be clarified (Yamashita et al., 1998; Beuvink et al., 2000; Xue et al., 2002;
Berger et al., 2013).
SUMOylation has been demonstrated to negatively regulate the activity of STAT1 and STAT5 (Ungureanu et al., 2005; Gr¨onholm et al., 2012; Van Nguyen et al., 2012).
The proposed SUMOylated lysine K696 of STAT5A (K701 of STAT5B) is also a target for acetylation (Ma et al., 2010; Van Nguyen et al., 2012).
2.3.6.1 STAT acetylation
The last decade has established acetylation as an important post-translational modifica- tion for the regulation of STAT proteins. STAT proteins were shown to be acetylated at one or multiple lysine residues in di↵erent domains (Wieczorek et al., 2012). The functional characterization of acetylation sites is usually undertaken by site-directed mu- tagenesis of candidate lysine residues. Mutation to arginine prevents acetylation through its mesomerically stabilized guanidino group. At the same time arginine retains a positive charge like the unmodified lysine residue. Mutation to the neutral amino acid glutamine mimics lysine acetylation, especially the loss of the positive charge. Furthermore, glu- tamine and acetylated lysine both contain an amide group in their side-chain (Li et al., 2002; Wang & Hayes, 2008; Kr¨amer et al., 2009; Kr¨amer & Heinzel, 2010). There are numerous examples where mutations to arginine or glutamine were successfully used to mimick deacetylated or acetylated lysine residues (Li et al., 2002; Wang & Hayes, 2008;
Kr¨amer et al., 2009). For instance, a STAT1 mutant carrying lysine to arginine muta-
tions at lysine residues K410 and K413 behaves similarly as the unmodified wild-type
STAT1 protein, while a STAT1 mutant carrying lysine to glutamine mutations at the
same residues behaves similarly as the acetylated wildtype protein (Kr¨amer et al., 2006,
2009).
Acetylation can a↵ect di↵erent steps of the activation of STATs like STAT protein interactions, phosphorylation, dimerization, or transcriptional activity (Wieczorek et al., 2012). An additional level of regulation is added by the interplay of STAT acetylation with other STAT post-translational modifications like phosphorylation or SUMOylation (Kr¨amer et al., 2009; Van Nguyen et al., 2012). The functional consequence of STAT acetylation is specific for each STAT family member (Ray et al., 2005; Yuan, 2005; Tang et al., 2007; Kr¨amer et al., 2009; Nie et al., 2009; Ma et al., 2010; Ginter et al., 2012;
Van Nguyen et al., 2012; Wieczorek et al., 2012). Furthermore, several controversial reports exist regarding specific STAT acetylation sites and their functional role (Nusinzon
& Horvath, 2003; Klampfer et al., 2004; Ray et al., 2005; Yuan, 2005; Catania et al., 2006;
Kr¨amer et al., 2009; Nie et al., 2009; Gupta et al., 2012; Wieczorek et al., 2012; Kosan et al., 2013). This is probably a consequence of the complexity of STAT acetylation, which might be influenced by experimental conditions such as the activating cytokine (Ginter et al., 2012), the investigated cell-type (Nakajima et al., 2001; Rascle et al., 2003; Kosan et al., 2013) or treatment duration with deacetylase inhibitors (Nusinzon &
Horvath, 2003; Klampfer et al., 2004; Sakamoto et al., 2004; Ginter et al., 2012).
Acetylation of STAT1 and STAT2
Acetylation of STAT1 within its DNA binding domain at K410 and K413 counteracts STAT1 phosphorylation and transcriptional activity. Acetylation supports the interaction of STAT1 with the T cell tyrosine phosphatase (TCP45) which correlates with STAT1 dephosphorylation and thus inactivation (Kr¨amer et al., 2009; Ginter et al., 2012). While the finding of these studies that deacetylase inhibition of STAT1 acetylation impairs STAT1 phosphorylation is consistent with data from Klampfer et al. (2004), others use shorter deacetylase inhibitor treatments and report that deacetylase inhibition does not a↵ect STAT1 phosphorylation (Nusinzon & Horvath, 2003; Chang et al., 2004; Sakamoto et al., 2004). Nevertheless, all cited reports are consistent in that deacetylase inhibitor treatment blocks interferon-induced transcriptional activity of STAT1.
Several acetylation sites of STAT2 were identified by mass spectrometry upon over-
expression of STAT2 and the HATs CBP or p300 (Tang et al., 2007). Furthermore,
it was shown that acetylation at K390 of STAT2 modulates the interaction between
STAT2 and STAT1 and is required for the formation of transcriptionally active inter-
feron stimulated gene factor 3 complex (ISGF3 consisting of STAT1, STAT2 and IRF9)
upon interferon-↵ signaling (Tang et al., 2007).
Acetylation of STAT3
STAT3 was shown to be acetylated at K685 but not at nearby lysine residues, and this acetylation positively a↵ects its transcriptional activity (Wang et al., 2005; Yuan, 2005).
Mutation of K685 to arginine, leading to acetylation-deficient STAT3, does not a↵ect STAT3 phosphorylation, but impairs its dimerization, DNA binding, and consequently its transcriptional activity (Yuan, 2005). By contrast, Nie et al. (2009) found by mass spectrometry that K679, K707 and K709 of STAT3 can also be acetylated. Mutation of all those lysine residues together with K685 to arginine reduced STAT3 phosphorylation much more than single or double mutations, suggesting that acetylation of all four lysine residues is functionally required for STAT3 phosphorylation and activity (Nie et al., 2009).
In parallel it was found that K49 and K87 are acetylated, but that mutation of K49 and K87 to arginine does not a↵ect STAT3 phosphorylation (Nie et al., 2009). Others investigated K49 and K87 in more details and found that besides slightly diminishing STAT3 phosphorylation, mutation of these lysines does not a↵ect STAT3 dimerization or DNA binding, but abrogates the IL-6-induced transcriptional activity of STAT3 at its target gene hAGT (Ray et al., 2005). Ray and coworkers suggested that acetylation is required for stable interaction of STAT3 with p300 and subsequent recruitment of RNA polymerase II and transcription induction (Ray et al., 2005; Hou et al., 2008).
All of the above mentioned studies on STAT3 are consistent in that deacetylase in- hibitors and thus increased acetylation positively a↵ect STAT3 activity. By contrast, Catania et al. (2006) found that deacetylase inhibitors interfere with PDGF-induced transcriptional activity of STAT3, while phosphorylation, nuclear translocation and DNA binding remained intact, and Gupta et al. (2012) found that in di↵use large B cell lym- phoma deacetylase inhibitors lead to increased K685 acetylation and attenuate STAT3 tyrosine phosphorylation and transcriptional activity. Altogether the reports are contro- versial regarding which STAT3 lysine residue is acetylated and regarding the consequence of STAT3 acetylation on its transcriptional activity.
Acetylation of STAT5
STAT5B acetylation at K359, K694 and K701 (corresponding to K359, K689 and K696
of STAT5A) was demonstrated by Ma et al. (2010) through mass spectrometry and
acetylation-site-specific antibodies. Mutation of K359, K694, and to a lesser extent K701
to arginine reduced prolactin-induced STAT5 activity in a luciferase reporter assay. Mu-
tation of K694 or K701 (both localized within the phosphotyrosine tail segment near the
SH-2 domain) was further demonstrated to impair dimerization of STAT5B, thus giving
a possible explanation for the diminished STAT5 downstream activity (Ma et al., 2010).
By contrast, mutation of K359, which is located within the DNA binding domain, had a minimal positive e↵ect on STAT5 dimerization but nevertheless abrogated the abil- ity of STAT5 to induce a luciferase reporter gene. STAT5A acetylation at K696 and the negative e↵ect of K696 arginine mutation on STAT5A transcriptional activity was independently demonstrated elsewhere in a luciferase reporter assay in growth hormone- stimulated mouse embryonic fibroblasts (Van Nguyen et al., 2012). K696 acetylation of STAT5A after deacetylase inhibitor treatment was additionally confirmed in a global quantitative mass spectrometric approach (Choudhary et al., 2009).
While Ma et al. (2010) and Van Nguyen et al. (2012) concluded that acetylation has a positive e↵ect on STAT5 activity, Sebasti´an et al. (2008) and our group (Rascle et al., 2003) found in GM-CSF-dependent macrophages and in the IL-3-dependent pro-B cell line Ba/F3 respectively that deacetylase inhibitors block STAT5 transcriptional activity.
Both groups consistently reported that deacetylase inhibitor treatment inhibits expression of STAT5 target genes by preventing the recruitment of RNA polymerase II. Upstream STAT5 activating events, however, remain una↵ected, including STAT5 phosphorylation, nuclear translocation and binding to DNA target sites. Similar findings have been re- ported for STAT1, STAT2 and STAT3 after deacetylase inhibitor treatment (Nusinzon
& Horvath, 2003; Sakamoto et al., 2004; Catania et al., 2006).
2.3.7 STAT5 in cancer
Aberrant continuous activity of STAT5 can be found in many hematologic malignancies and in solid tumor cancers like breast cancer, prostate cancer, squamous cell carcinoma of the head and neck, hepatocellular carcinoma and melanoma (Koppikar et al., 2008;
Ferbeyre & Moriggl, 2011). Activating mutations within STAT5 have been described (Rajala et al., 2013; Kontro et al., 2014), however, it is much more common that STAT5 is activated downstream of constitutively active oncogenic tyrosine kinases like BCR- ABL or JAK2(V617F) (Gesbert & Griffin, 2000; Funakoshi-Tago et al., 2010; Hoelbl et al., 2010; Walz et al., 2012). In other cancers, STAT5 is activated by autocrine or paracrine cytokine loops (Li et al., 2004; Bernichtein et al., 2010). In addition, SOCS proteins, transcriptional negative feedback regulators of the JAK/STAT pathway, are often downregulated in cancers (Galm et al., 2003; Tokita et al., 2007; Zhang et al., 2015;
Kang et al., 2016). Persistent STAT5 activation directly contributes to cancer initiation and progression (Hoelbl et al., 2010; Ferbeyre & Moriggl, 2011; Walz et al., 2012; Weber et al., 2015), most likely through the influence of STAT5 on key genes regulating cell proliferation and survival such as cyclin D1, Bcl-x, c-Myc and Pim-1 (Mui et al., 1996;
Matsumura et al., 1999; Nosaka et al., 1999; Gesbert & Griffin, 2000; Kontro et al., 2014;
Pinz et al., 2016).
Several inhibitors of the STAT pathway are approved or currently under clinical trial, most of them targeting the upstream kinase (Savage & Antman, 2002; O’Shea et al., 2015). Additional inhibitors repressing STAT5 function at the transcriptional level have been described, including the natural compound sulforaphane, the bromodomain inhibitor (+)-JQ1, or deacetylase inhibitors (Rascle et al., 2003; Liu et al., 2014; Pinz et al., 2014b).
The synthetic chalcones ↵-Br-TMC and ↵-CF
3-TMC inhibit IL-3-induced JAK2 and STAT5 phosphorylation (Pinz et al., 2014a; Jobst et al., 2016). Although there is progress in the development of compounds which inhibit STAT5 function by directly binding to STAT5, targeting transcription factors like STAT5 remains difficult (Weber et al., 2013;
Elumalai et al., 2015; Liao et al., 2015). Transcription factors exert most of their functions through protein-protein and protein-DNA interactions and accordingly lack well-defined hydrophobic binding pockets which typically serve as target for conventional membrane- permeable small molecules (Arkin & Wells, 2004; Buchwald, 2010; Liao et al., 2015).
The identification of better druggable cofactors thus contains major potential for the development of specific therapies against STAT5-associated diseases.
2.4 Objectives
Deacetylase inhibitors inhibit STAT5-mediated transcription by impairing the recruit- ment of the transcription machinery to STAT5 target genes, while STAT5 binding to DNA remains una↵ected (Rascle et al., 2003). However, the factors involved and their role in the inhibition of STAT5-mediated transcription remain unknown. The goal of this thesis was to characterize the molecular mechanism of inhibition of STAT5-mediated transcription by deacetylase inhibitors. Specific aims were to identify and characterize (i) the HDAC(s) involved and (ii) its/their acetylated substrate(s).
To identify the deacetylase(s) involved in STAT5-mediated transcription, the e↵ect of selective deacetylase inhibitors on expression of STAT5 target genes was analyzed. This should allow the identification of possible candidates among the 11 known HDAC family members. To further identify HDAC candidates, the e↵ect of siRNA-mediated knockdown of HDAC expression on the regulation of STAT5 target genes was investigated.
The acetylated substrate targeted for deacetylation might be STAT5 itself, a STAT5-
specific cofactor or histone proteins. To assess a possible implication of STAT5 acetyla-
tion, several potential acetylation sites within STAT5 were mutated and the transcrip-
tional activity of the generated mutants was analyzed either using luciferase reporter as-
says or by RT-qPCR of endogenous STAT5 target genes. Persistent acetylation of STAT5
or of an unknown STAT5-specific cofactor upon deacetylase inhibitor treatment might
disrupt protein interactions between STAT5 and components of the transcriptional ma-
chinery. To analyze whether deacetylase inhibitor treatment might disrupt STAT5- and RNA polymerase II-containing protein complexes and to obtain clues towards the possi- ble involvement of an acetylated STAT5-specific cofactor, gel filtration chromatography was performed, comparing the composition of untreated and deacetylase-inhibitor-treated nuclear complexes. To investigate whether histones might be the acetylated substrate, the e↵ect of deacetylase inhibitors on histone acetylation was assessed globally by western blot and locally at STAT5 target and control genes by chromatin immunoprecipitation.
Together, this study will contribute to a better understanding of the mechanism of
STAT5-mediated transcription and of its inhibition by deacetylase inhibitors. Ultimately,
it should provide the molecular basis for the development of novel therapies against
STAT5-associated cancers.
Material and methods
3.1 Material
3.1.1 Chemicals and reagents
Standard chemicals not mentioned in the following list were purchased from Sigma- Aldrich, Merck, or AppliChem.
Chemical/Reagent Manufacturer
-Mercaptoethanol (14,3 M) Sigma-Aldrich Acrylamid/Bisacrylamid Rotiphorese Gel 30 Roth
Agarose, LE Biozym
Ammonium persulfate (APS) Sigma-Aldrich
Ampicillin sodium salt Sigma-Aldrich
Bovine serum albumin (BSA) Sigma-Aldrich
Bromphenolblue Merck
Coomassie Brilliant Blue R-250 AppliChem Dimethyl sulfoxide (DMSO) Sigma-Aldrich
Dithiothreitol (DTT) Sigma-Aldrich
DMEM Gibco, Life Sciences
DNA ladder, 100 bp and 1 kb ladder New England Biolabs
Doxycycline Sigma-Aldrich
Dry skimmed milk Sucofin
Ethidum bromide Promega
Fetal calf serum (FCS) PAN Biotech and Life Technology
G418 disulfate salt Sigma-Aldrich
Gene Pulser Electroporation bu↵er Bio-Rad
Glycogen Affimetrix
Hygromycin B PAN Biotech
Insulin Sigma-Aldrich
Kanamycin sulfate Gibco, Life Technology
LB-agar (Luria/Miller) Roth
Chemical/Reagent Manufacturer
LB-medium (Luria/Miller) Roth
Lipofectamine 2000 Invitrogen
N,N,N,N-Tetramethylethylenediamine (TEMED) Sigma-Aldrich Penicillin-Streptomycin solution (100x) Invitrogen Phenol/chlorophorm/isoamyl alcohol (25/24/1) Roth
Phenylmethylsulfonylfluoride (PMSF) Sigma-Aldrich PicTIXX Pluster & LinerPen C. Kreuel
Ponceau S Sigma-Aldrich
Protein Marker VI (10-245) prestained AppliChem Protein-A sepharose beads GE Healthcare recombinant murine Interleukin-3 (rmIL-3) ImmunoTools Roti-Quant, 5x Bradford reagent Roth
ROX passive reference dye, 50x Bio-Rad
RPMI 1640 PAN Biotech
Salmon Sperm DNA Invitrogen
Sodium fluoride Sigma-Aldrich
Sodium orthovanadate Sigma-Aldrich
Trypsin/EDTA PAN Biotech
Tween-20 AppliChem
WST-1 cell proliferation reagent Roche
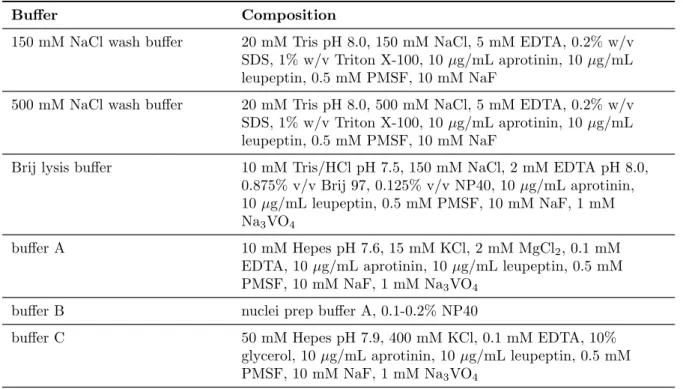
3.1.2 Bu↵ers
All bu↵ers were prepared with ultrapure water purified with Milli-Q-Synthesis Water Purification System (Millipore).
Table 3.1: Bu↵ers
Bu↵er Composition
150 mM NaCl wash bu↵er 20 mM Tris pH 8.0, 150 mM NaCl, 5 mM EDTA, 0.2% w/v SDS, 1% w/v Triton X-100, 10 µg/mL aprotinin, 10 µg/mL leupeptin, 0.5 mM PMSF, 10 mM NaF
500 mM NaCl wash bu↵er 20 mM Tris pH 8.0, 500 mM NaCl, 5 mM EDTA, 0.2% w/v SDS, 1% w/v Triton X-100, 10 µg/mL aprotinin, 10 µg/mL leupeptin, 0.5 mM PMSF, 10 mM NaF
Brij lysis bu↵er 10 mM Tris/HCl pH 7.5, 150 mM NaCl, 2 mM EDTA pH 8.0, 0.875% v/v Brij 97, 0.125% v/v NP40, 10 µg/mL aprotinin, 10 µg/mL leupeptin, 0.5 mM PMSF, 10 mM NaF, 1 mM Na
3VO
4bu↵er A 10 mM Hepes pH 7.6, 15 mM KCl, 2 mM MgCl
2, 0.1 mM EDTA, 10 µg/mL aprotinin, 10 µg/mL leupeptin, 0.5 mM PMSF, 10 mM NaF, 1 mM Na
3VO
4bu↵er B nuclei prep bu↵er A, 0.1-0.2% NP40
bu↵er C 50 mM Hepes pH 7.9, 400 mM KCl, 0.1 mM EDTA, 10%
glycerol, 10 µg/mL aprotinin, 10 µg/mL leupeptin, 0.5 mM
PMSF, 10 mM NaF, 1 mM Na
3VO
4Bu↵er Composition
bu↵er CBB 100 mM Tris pH 9.4, 100 mM DTT, 10 µg/mL aprotinin, 10 µg/mL leupeptin, 0.5 mM PMSF, 10 mM NaF
bu↵er MA 10 mM Hepes pH 6.5, 10 mM EDTA, 0.25% Triton X-100, 10 µg/mL aprotinin, 10 µg/mL leupeptin, 0.5 mM PMSF, 10 mM NaF
bu↵er MB 10 mM Hepes pH 6.5, 1 mM EDTA, 200 mM NaCl, 10 µg/mL aprotinin, 10 µg/mL leupeptin, 0.5 mM PMSF, 10 mM NaF Coomassie Blue staining
solution
0.25% w/v Coomassie Brilliant Blue R-250, 45% v/v methanol, 10% v/v acetic acid
DMEM-based medium DMEM supplemented with 10% v/v heat inactivated fetal calf serum, 1x penicillin/streptomycin and 2 mM glutamine
DNA loading dye, 10x 50 mM Tris/HCl pH 7.6, 60% glycerol, bromphenol blue, xylene cyanol
FT bu↵er 600 mM NaCl, 20 mM Tris/HCl pH 8.0, 20% v/v glycerol, 10 µg/mL aprotinin, 10 µg/mL leupeptin, 0.5 mM PMSF GF bu↵er 25 mM Hepes pH 7.2, 0.1 M KCl, 0.1 mM EDTA, 5% v/v
glycerol, 1 mM DTT, 100 µg/mL insulin, 2 mM benzamidine-HCl, 1 mM PMSF
HDG 150 20 mM Hepes pH 7.6, 150 mM KCl, 10% v/v glycerol, 0.5 mM DTT, 10 µg/mL aprotinin, 10 µg/mL leupeptin, 0.5 mM PMSF, 10 mM NaF
IP bu↵er 1/3 Triton dilution bu↵er, 2/3 SDS bu↵er
L¨ammli loading dye, 4x 250 mM Tris/HCl pH 6.8, 40% v/v glycerol, 5% w/v SDS, 0.005% w/v bromphenol blue, 10% v/v -mercaptoethanol L¨ammli SDS running bu↵er, 5x 125 mM Tris, 960 mM glycine, 0.5% w/v SDS
LB agar plates LB-agar (Luria/Miller) from Roth: 10 g/L tryptone, 5 g/L yeast extract, 10 g/L NaCl, 15 g/L agar
LB medium LB-medium (Luria/Miller) from Roth: 10 g/L tryptone, 5 g/L yeast extract, 10 g/L NaCl
LiCl wash bu↵er 10 mM Tris pH 8.0, 250 mM LiCl, 1 mM EDTA, 0.5% v/v NP-40, 0.5% w/v Deoxycholic acid (sodium salt), 10 µg/mL aprotinin, 10 µg/mL leupeptin, 0.5 mM PMSF, 10 mM NaF MNase Reconstitution bu↵er 5 mM Tris pH 6.8, 50 mM NaCl, 50% v/v glycerol
P1 50 mM Tris/HCl pH 8.0, 10 mM EDTA
P2 200 mM NaOH, 1% w/v SDS
P3 3 mM potassiumacetate, pH 5.5
PBS, 10x 1.37 M NaCl, 27 mM KCl, 100 mM Na
2HPO
4, 18 mM KH
2PO
4, adjust to pH 7.4
PBST 1x PBS, 0.02% v/v Tween 20
RPMI-based medium RPMI 1640 supplemented with 10% v/v heat inactivated fetal
calf serum, 1x penicillin/streptomycin and 2 mM glutamine
Bu↵er Composition
SDS bu↵er 50 mM Tris pH 8.0, 100 mM NaCl, 5 mM EDTA, 0.5% w/v SDS, 10 µg/mL aprotinin, 10 µg/mL leupeptin, 0.5 mM PMSF, 10 mM NaF
SDS-PAGE separation gel, 10% same as 8% with the following exceptions: 3.3 mL Acrylamid/Bisacrylamid (30%, 49:1), 2.9 mL H
2O SDS-PAGE separation gel, 15% same as 8% with the following exceptions: 5 mL
Acrylamid/Bisacrylamid (30%, 49:1), 0.6 ml H
2O
SDS-PAGE separation gel, 8% 2.7 mL Acrylamid/Bisacrylamid (30%, 49:1), 2.9 mL H
2O, 3.75 mL 1 M Tris-HCl pH 8.8, 574 µL 85% glycerol, 100 µL 10% w/v SDS, 50 µL 10% w/v APS, 10 µL TEMED)
SDS-PAGE stacking gel 1.3 mL Acrylamid/Bisacrylamid (30%, 49:1), 7.3 mL H
2O, 1.25 mL 1 M Tris-HCl pH 6.8, 100 µL 10% w/v SDS, 50 µL 10% w/v APS, 10 µL TEMED
TAE, 50x 2 M Tris, 50 mM EDTA, 1 M acetic acid
TBS, 10x 500 mM Tris, 1.5 M NaCl, adjust to pH 7.5 with HCl
TBST 1x TBS, 0.02% v/v Tween 20
TE 20 mM Tris pH 8.0, 1 mM EDTA
TFBI + glycerol 1xTFBI, 15% v/v glycerol
TFBI, 10x 300 mM potassium acetate, 1 M RbCl, 100 mM CaCl
2x 2 H
2O, 500 mM MnCl
2x 4 H
2O
TFBII + glycerol 1xTFBII, 15% v/v glycerol
TFBII, 5x 50 mM MOPS, 50 mM RbCl, 370mM CaCl
2Towbin/SDS transfer bu↵er 25 mM Tris, 0.02% w/v SDS, 192 mM glycine, 20% v/v methanol
Triton dilution bu↵er 100 mM Tris pH 8.0, 100 mM NaCl, 5 mM EDTA, 5% w/v
Triton X-100, 10 µg/mL aprotinin, 10 µg/mL leupeptin, 0.5 mM
PMSF, 10 mM NaF
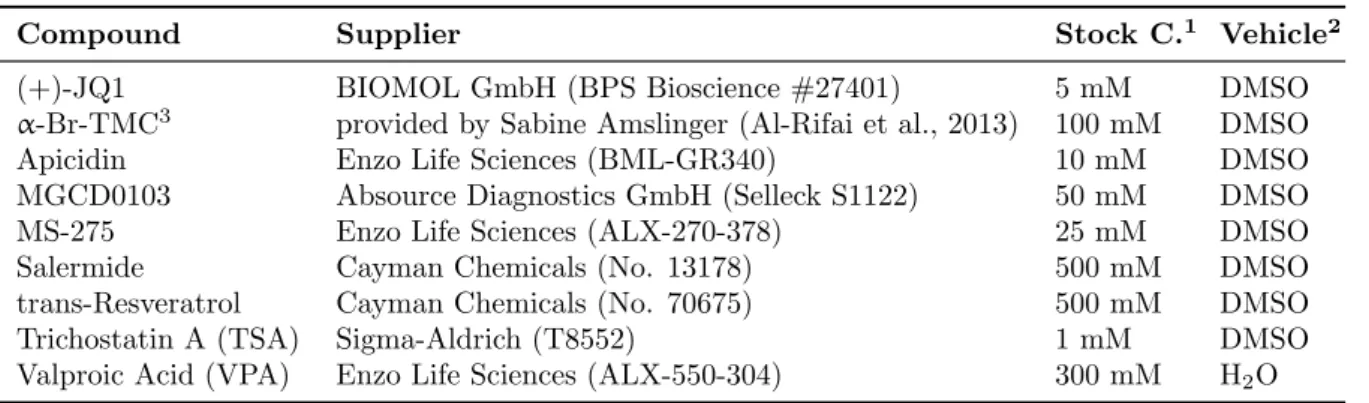
3.1.3 Deacetylase inhibitors and other small molecule compounds for cell treatment
Table 3.2: Deacetylase inhibitors and other small molecule compounds
Compound Supplier Stock C.
1Vehicle
2(+)-JQ1 BIOMOL GmbH (BPS Bioscience #27401) 5 mM DMSO
↵-Br-TMC
3provided by Sabine Amslinger (Al-Rifai et al., 2013) 100 mM DMSO
Apicidin Enzo Life Sciences (BML-GR340) 10 mM DMSO
MGCD0103 Absource Diagnostics GmbH (Selleck S1122) 50 mM DMSO
MS-275 Enzo Life Sciences (ALX-270-378) 25 mM DMSO
Salermide Cayman Chemicals (No. 13178) 500 mM DMSO
trans-Resveratrol Cayman Chemicals (No. 70675) 500 mM DMSO
Trichostatin A (TSA) Sigma-Aldrich (T8552) 1 mM DMSO
Valproic Acid (VPA) Enzo Life Sciences (ALX-550-304) 300 mM H
2O
1
The compounds were diluted at the indicated stock concentration (Stock C.) in the vehicle DMSO, or in the case of VPA in H
2O. Final compound concentration is indicated in the figure legends.
2
Vehicle concentration was adjusted to 0.02% DMSO in all TSA experiments. All other vehicle concen- trations are indicated in the figure legends.
3