doi: 10.1093/nar/gkv188
Deacetylase inhibitors repress STAT5-mediated transcription by interfering with bromodomain and extra-terminal (BET) protein function
Sophia Pinz, Samy Unser, Dominik Buob, Philipp Fischer, Belinda Jobst and Anne Rascle
*Stat5 Signaling Research Group, Institute of Immunology, University of Regensburg, 93053 Regensburg, Germany
Received December 24, 2014; Revised February 08, 2015; Accepted February 23, 2015
ABSTRACT
Signal transducer and activator of transcription STAT5 is essential for the regulation of prolifera- tion and survival genes. Its activity is tightly reg- ulated through cytokine signaling and is often up- regulated in cancer. We showed previously that the deacetylase inhibitor trichostatin A (TSA) inhibits STAT5-mediated transcription by preventing recruit- ment of the transcriptional machinery at a step fol- lowing STAT5 binding to DNA. The mechanism and factors involved in this inhibition remain unknown.
We now show that deacetylase inhibitors do not tar- get STAT5 acetylation, as we initially hypothesized.
Instead, they induce a rapid increase in global his- tone acetylation apparently resulting in the delocal- ization of the bromodomain and extra-terminal (BET) protein Brd2 and of the Brd2-associated factor TBP to hyperacetylated chromatin. Treatment with the BET inhibitor (+)-JQ1 inhibited expression of STAT5 tar- get genes, supporting a role of BET proteins in the regulation of STAT5 activity. Accordingly, chromatin immunoprecipitation demonstrated that Brd2 is as- sociated with the transcriptionally active STAT5 tar- get gene Cisand is displaced upon TSA treatment.
Our data therefore indicate that Brd2 is required for the proper recruitment of the transcriptional machin- ery at STAT5 target genes and that deacetylase in- hibitors suppress STAT5-mediated transcription by interfering with Brd2 function.
INTRODUCTION
Signal transducer and activator of transcription STAT5 is an essential regulator of cell differentiation, proliferation and survival (1–3). Following stimulation with specific cy- tokines, growth factors and hormones, the latent transcrip- tion factor is phosphorylated by receptor-associated JAK
tyrosine kinases. STAT5 phosphorylation allows its dimer- ization and translocation into the nucleus where it binds to conserved recognition sites usually present in the proximal promoters of STAT5 target genes, resulting in their tran- scriptional activation (3–5). In normal cells, STAT5 activity is tightly controlled via attenuation mechanisms including dephosphorylation by SHP-1 phosphatase and a negative feedback loop by CIS/SOCS family proteins (6,7). STAT5 activity is further regulated by post-translational modifi- cations (acetylation, SUMOylation) (2,8–11) and by pro- tein interactions with itself (tetramerization), transcription factors, transcriptional coactivators and corepressors, and with chromatin modifying enzymes (2,12–18). STAT5 ac- tivity is frequently deregulated in cancer cells, which typi- cally exhibit constitutively phosphorylated STAT5 due to the aberrant activity of oncogenic kinases or as a result of point mutations in STAT5 proteins (19–26). STAT5 con- stitutive activation results in increased cell proliferation and reduced cell apoptosis, and is as such an important player in cancer initiation and progression (3,6,27–30). The STAT5 pathway is therefore an acknowledged target for cancer prevention and therapy (31–33). A number of in- hibitors of the STAT5 pathway have been described, includ- ing tyrosine kinase inhibitors targeting JAK family mem- bers and small-molecule inhibitors targeting STAT5 phos- phorylation or DNA binding activity (34–39). Inhibitors targeting STAT5 transcriptional activity, at a step subse- quent to its binding to DNA, have been described. They in- clude deacetylase inhibitors such as trichostatin A (TSA), suberoylanilide hydroxamic acid (SAHA) and sodium bu- tyrate (NaB), initially described by our group, and more recently the bromodomain inhibitor (+)-JQ1 and the nat- ural compound sulforaphane (40–43). The mechanism of inhibition of STAT5 activity by these inhibitors remains unknown. Therapies combining tyrosine kinase inhibitors and either deacetylase or bromodomain inhibitors, as well as therapies combining deacetylase and bromodomain in- hibitors proved to be more effective in the treatment of can- cers with constitutive active STAT5 (42,44–49). A number of deacetylase inhibitors are either approved or currently
*To whom correspondence should be addressed. Tel: +49 941 944 5467; Fax: +49 941 944 5462; Email: anne.rascle@klinik.uni-regensburg.de Present address: Dominik Buob, BioNTech RNA Pharmaceuticals GmbH, 55131 Mainz, Germany.
C The Author(s) 2015. Published by Oxford University Press on behalf of Nucleic Acids Research.
This is an Open Access article distributed under the terms of the Creative Commons Attribution License (http://creativecommons.org/licenses/by/4.0/), which permits unrestricted reuse, distribution, and reproduction in any medium, provided the original work is properly cited.
at Universitaetsbibliothek Regensburg on March 20, 2015http://nar.oxfordjournals.org/Downloaded from at Universitaetsbibliothek Regensburg on March 20, 2015http://nar.oxfordjournals.org/Downloaded from at Universitaetsbibliothek Regensburg on March 20, 2015http://nar.oxfordjournals.org/Downloaded from at Universitaetsbibliothek Regensburg on March 20, 2015http://nar.oxfordjournals.org/Downloaded from at Universitaetsbibliothek Regensburg on March 20, 2015http://nar.oxfordjournals.org/Downloaded from at Universitaetsbibliothek Regensburg on March 20, 2015http://nar.oxfordjournals.org/Downloaded from at Universitaetsbibliothek Regensburg on March 20, 2015http://nar.oxfordjournals.org/Downloaded from at Universitaetsbibliothek Regensburg on March 20, 2015http://nar.oxfordjournals.org/Downloaded from at Universitaetsbibliothek Regensburg on March 20, 2015http://nar.oxfordjournals.org/Downloaded from at Universitaetsbibliothek Regensburg on March 20, 2015http://nar.oxfordjournals.org/Downloaded from
being evaluated for the treatment of various types of cancers (50). Understanding the mode of action of these inhibitors is thus not only fundamental for a better characterization of their activity and specificity but will also contribute to a better understanding of the mechanism of transcriptional regulation by STAT5 in normal and cancer cells.
We showed before that the deacetylase inhibitors TSA, SAHA and NaB inhibit cytokine-induced STAT5 tran- scriptional activity by preventing recruitment of compo- nents of the transcriptional machinery (TBP, RNA poly- merase II) without affecting STAT5 binding to DNA (40).
Analysis of histone H3 and H4 acetylation revealed mi- nor changes upon TSA treatment along the STAT5 target gene Cis, as opposed to the control genec-Fos (41). Be- side, histone acetylation levels remained particularly low in the vicinity of the STAT5 binding sites within the Cis promoter, regardless of interleukin-3 (IL-3) stimulation or TSA treatment (41). Therefore, our previous data suggested that deacetylase inhibitors are unlikely to modulate his- tone acetylation locally and rather block STAT5 activity by altering properties of the DNA-bound STAT5 protein.
The present study aimed at identifying the molecular mech- anism of inhibition of STAT5 activity by deacetylase in- hibitors. STAT5 and other STAT proteins are known to be acetylated on specific lysines located within their C-terminal transactivation domain, DNA binding domain and/or N- terminal domain (9,10,51–56). The effect of acetylation and deacetylation on STAT activity varies with the respective STAT protein. The existence of contradictory reports also suggest complex spatio-temporal regulatory mechanisms that might also depend on the cytokine-activated recep- tors involved and the cell type investigated (9,11,13,53–
55,57–61). STAT1 acetylation on K410 and K413 within its DNA binding domain inhibits its phosphorylation and thus its transcriptional activity, in agreement with the re- quirement of a deacetylase (HDAC) activity for STAT1 sig- naling (51,58,62). By contrast STAT2 acetylation on K390 (DNA binding domain) is required for the transcriptional activity of the STAT1/STAT2/IRF9 (ISGF3) complex in- duced by IFN␣(52). A number of conflicting results have been reported regarding the identity of acetylated lysine(s) within STAT3 and their implication in regulating STAT3 activity. STAT3 acetylation in the cytosol on a single ly- sine (K685) within the C-terminal SH2 domain did not in- fluence STAT3 phosphorylation and nuclear translocation but its dimerization, thus eventually modulating its DNA binding and transcriptional activities (53,60). By contrast, Nie et al.showed that acetylation of K685 together with K679, K707 and K709 is required for STAT3 phosphoryla- tion and downstream activity (54). This group also showed that acetylation of N-terminal lysines K49 and K87 does not play a role in STAT3 activity, which contradicts an- other report proposing that acetylation at K49 and K87 takes place at a step following STAT3 phosphorylation, nu- clear translocation and binding to DNA, to allow recruit- ment and stabilization of p300 and RNA polymerase II, and thus transcription (55,61). Cytosolic STAT5B acetyla- tion in response to prolactin at K359 (DNA binding do- main) and K694 (K689 in STAT5A) and to a lesser extent at K701 (K696 in STAT5A), both within the C-terminal SH2 domain, did not influence STAT5 phosphorylation but its
dimerization, thus affecting its activity (10). STAT5A acety- lation at K696, but not at K700, was also reported inde- pendently (8,56). Interestingly, STAT5 is also SUMOylated at the same K696 residue. Mutating K696 to arginine par- tially affected growth hormone (GH)-induced STAT5 activ- ity in a luciferase reporter assay in mouse embryonic fibrob- lasts (8), suggesting that acetylation and/or SUMOylation at K696 might play a role in the regulation of STAT5 activ- ity.
Existing data thus suggest a possible role of STAT5 acety- lation at K359, K689 and/or K696 independent of STAT5 phosphorylation (8–11,56,57). We then hypothesized that the observed inhibitory effect of deacetylase inhibitors on STAT5 transcriptional activity might involve acetylation of STAT5, possibly resulting in the disruption of protein–
protein interaction(s) between STAT5 and essential compo- nents of the transcriptional machinery. Therefore our study initially aimed at (i) identifying essential lysine residues within STAT5 that are potentially acetylated upon treat- ment with deacetylase inhibitors such as TSA, (ii) corre- lating STAT5 acetylation with a possible alteration in the composition of STAT5-containing complexes upon TSA treatment and (iii) identifying among HDAC1–11 (63,64) the deacetylase(s) responsible for this effect. We found that mutating multiple lysine residues within constitutively ac- tive STAT5A-1*6 did not affect its transcriptional activity in Ba/F3 cells. Besides, TSA treatment did not affect the gel filtration profile of STAT5-containing complexes. These observations strongly argued against a direct inhibition of STAT5 activity through alteration of STAT5 acetylation.
Interestingly, the ability of the deacetylase inhibitors TSA, valproic acid (VPA) and apicidin to inhibit STAT5 activity correlated with a rapid and strong increase in global his- tone acetylation. By contrast, neither STAT5 activity nor global histone acetylation was affected by the deacetylase inhibitors MGCD0103 and MS-275. The global increase in histone acetylation induced by TSA treatment was associ- ated with local changes in histone acetylation and a decrease in histone occupancy at several gene loci, likely reflecting nucleosome instability provoked by increased acetylation.
We therefore investigated whether changes in chromatin structure might interfere with the function of chromatin- associated factors, in particular of those interacting with acetylated histones. We found that upon treatment with TSA, VPA and apicidin––but not with MGCD0103 and MS-275––the bromodomain and extra-terminal (BET) nu- clear protein Brd2, and to a lesser extent the TATA-box binding protein TBP, were rapidly depleted from the solu- ble nuclear fraction but not from the insoluble chromatin fraction. This finding suggests a rapid delocalization of Brd2 and of the Brd2-associated factor TBP to hyperacety- lated chromatin. Further experiments using the bromod- omain inhibitor (+)-JQ1 and chromatin immunoprecipita- tion (ChIP) assays using Brd2 antibodies further confirmed a role of Brd2 in regulating STAT5 activity. Altogether, our data demonstrate, to our knowledge for the first time, that deacetylase inhibitors block STAT5 transcriptional activ- ity by interfering with the function of the BET family pro- tein Brd2, very likely preventing it from recruiting and sta- bilizing the transcriptional machinery. Our findings repre- sent a major step not only in understanding the mechanism
at Universitaetsbibliothek Regensburg on March 20, 2015http://nar.oxfordjournals.org/Downloaded from
of transcriptional regulation by the oncoprotein STAT5 but also in characterizing the mode of action and specificity of deacetylase inhibitors.
MATERIALS AND METHODS Chemicals
Dimethyl sulfoxide (DMSO), TSA, MG132 and in- sulin were purchased from SIGMA (D-2650, T-8552, C- 2211 and I-9278, respectively). (+)-JQ1 (BPS Bioscience
#27401)––hereafter abbreviated to JQ1––was purchased from BIOMOL GmbH. VPA, apicidin and MS-275 were purchased from Enzo Life Sciences (ALX-550–304, BML- GR340 and ALX-270–378, respectively). MGCD0103 (Sel- leck S1122) was purchased from Absource Diagnostics GmbH. With the exception of VPA, which was dissolved at 300 mM in H2O, compounds were dissolved in DMSO at a final concentration of 1 mM (TSA), 10 mM (Apicidin), 40 mM (MGCD0103), 25 mM (MS-275), 5 mM (JQ1) and 10 mM (MG132). DMSO was used as vehicle control. Its final concentration was adjusted in all conditions, unless in- dicated otherwise, and never exceeded 0.12%.
Antibodies
Antibodies used for western blot and ChIP were pSTAT5 (Cell Signaling Technology 9351), STAT5A (Santa Cruz Biotechnology sc-1081), STAT5B (Santa Cruz Biotechnol- ogy sc-1656), STAT5A+B (Santa Cruz Biotechnology sc- 835), RNA polymerase II (Santa Cruz Biotechnology sc- 899 and sc-900), TBP (Santa Cruz Biotechnology sc-273), histone H3 (Abcam ab1791), acetylated histone H3 (Ac-H3;
Millipore 06–599), acetylated histone H4 (Ac-H4; Millipore 06–866), ␣-tubulin (Santa Cruz Biotechnology sc-32293), HDAC1 (Millipore 05–100), HDAC2 (Invitrogen 51–5100), HDAC3 (Cell Signaling Technology 2632), FLAG (M2, SIGMA F-1804), Brd2 (Bethyl A302–583A) and IgG from rabbit serum (SIGMA I-5006; isotype control for ChIP).
Secondary antibodies for western blot were anti-Rabbit IgG-Peroxidase (SIGMA A-0545) and anti-Mouse IgG- Peroxidase (SIGMA A-8924).
Cell lines and drug treatments
All cell lines were cultivated at 37◦C under 5% CO2in a hu- midified incubator. The IL-3-dependent mouse pro-B cell line Ba/F3 (a kind gift from Jacqueline Marvel, IFR 128 BioSciences Gerland-Lyon Sud, France) (65) was grown in RPMI 1640 (PAN-Biotech P04–16500) supplemented with 10% heat-inactivated fetal calf serum (FCS; PAN- Biotech), 1% penicillin/streptomycin (PAN-Biotech) and 2 ng/ml rmIL-3 (ImmunoTools). The IL-3-independent Ba/F3–1*6 cell line (clone F7) stably expressing the con- stitutively active (FLAG-tagged) mouse STAT5A-1*6 mu- tant (66) has been recently described (36) and was grown in RPMI 1640 supplemented with 10% heat-inactivated FCS, 1% penicillin/streptomycin and 600g/ml G418 (SIGMA A-1720). The Ba/F3-tet-on-1*6 cell line was generated by stably transfecting Ba/F3 cells with the pTet-On Advanced vector (Clontech) expressing the rtTA-Advanced transac- tivator under neomycin (G418) selection. A clone highly
expressing the transactivator was selected and stably co- transfected with a tetracycline-responsive vector condition- ally expressing FLAG-tagged mouse STAT5A-1*6 (pTRE- Tight-BI-AcGFP1-mSTAT5A-1*6-FLAG) and pTK-Hyg (Clontech) to confer hygromycin B resistance. Upon hy- gromycin B selection, clones highly expressing mSTAT5A- 1*6-FLAG in the presence of 1 g/ml of the tetra- cycline analog doxycycline (SIGMA D-9891) were se- lected and further characterized (paper in preparation).
Ba/F3-tet-on-1*6 clone D4.1 was chosen for our study.
Non-induced Ba/F3-tet-on-1*6 cells were grown in RPMI 1640 supplemented with 10% heat-inactivated FCS, 1%
penicillin/streptomycin, 600 g/ml G418, 800g/ml hy- gromycin B (PAN-Biotech) and 2 ng/ml rmIL-3. Expres- sion of mSTAT5A-1*6-FLAG was induced by growing the cells 24 h in RPMI 1640 supplemented with 10% heat- inactivated FCS, 1% penicillin/streptomycin and 1g/ml doxycycline.
For cytokine stimulation of Ba/F3 cells, cells were washed twice in RPMI 1640 and rested in RPMI 1640/10%
FCS/1% penicillin-streptomycin for 6–12 h before addition of 2–5 ng/ml IL-3 for 30–120 min, as indicated.
For inhibitor treatment of Ba/F3 cells, unless indicated otherwise, rested cells were pre-treated 30 min with the re- spective compound or with DMSO (vehicle) prior to IL-3 stimulation. Ba/F3–1*6 cells were treated with inhibitors or vehicle for 5–240 min, as indicated.
Plasmid transfection by electroporation
Lysine to glutamine (K>Q) and lysine to arginine (K>R) point mutations were introduced within mouse STAT5A- 1*6 (K84, K359, K384, K675, K681, K689, K696, K700) of pcDNA3-mSTAT5A-1*6-FLAG vector (36) by fol- lowing the QuikChange site-directed mutagenesis proto- col (oligonucleotides used shown in Supplementary Ta- ble S1). Multiple mutants (the so-called 2xQ/R for the K696/K700 double K>Q or K>R mutants, 3xQ/R for the K689/K696/K700 triple K>Q or K>R mutants and 5xQ/R for the K675/K681/K689/K696/K700 quintuple K>Q or K>R mutants) were also generated. As a positive control for inactivating mutation, the tyrosine residue at po- sition 694 of mSTAT5A-1*6, which is essential for its phos- phorylation and activity (66), was mutated to phenylala- nine (Y694F). All mutations were confirmed by sequencing.
Plasmid pcDNA3-mSTAT5A-FLAG, expressing wild-type mouse STAT5A, was used as a negative control for STAT5 activity in IL-3-free medium. Empty pcDNA3 vector (In- vitrogen) was also tested in parallel.
Expression plasmids were prepared with the Plasmid Pure Midi Kit (Qiagen) and transfected into Ba/F3 cells by electroporation using the Gene Pulser Xcell Electropo- ration System with CE Module (Bio-Rad). Briefly, 4×10⁶ cells were mixed with 8g plasmid DNA in 800l RPMI 1640, transferred into a 0.4 cm gap cuvette (VWR) and electroporated by delivering one exponential decay pulse of 320 V and 950 F. Transfected cells were returned to RPMI 1640/10% FCS/1% penicillin–streptomycin for 10 h in the absence of IL-3, and harvested for gene expression and western blot analyses, as described below.
at Universitaetsbibliothek Regensburg on March 20, 2015http://nar.oxfordjournals.org/Downloaded from
siRNA transfection by electroporation
HDAC-specific and ScI control siRNAs (Supplementary Table S1) were transfected into Ba/F3 and Ba/F3–1*6 cells by electroporation using either the Bio-Rad Gene Pulser II with RF Module (Supplementary Figure S4 A–D) as pre- viously described (41), or the Bio-Rad Gene Pulser Xcell with CE Module (Supplementary Figure S4 E–G) as fol- lows. Ba/F3–1*6 cells were subjected to two rounds of elec- troporation (att=0 and at 24 h) and harvested at 48–72 h for gene expression and western blot analyses. Per trans- fection, PBS-washed 1×10⁶cells were resuspended in 100
l Gene Pulser Electroporation Buffer (Bio-Rad) contain- ing 0.5 to 1 M siRNA duplexes, transferred to a 0.1 cm gap cuvette (VWR) and electroporated through delivery of two square wave pulses of 95V, 5 ms duration and 0.1 s in- terval. Transfected cells were returned to RPMI 1640 sup- plemented with 10% FCS and 1% penicillin/streptomycin.
Multiple siRNA transfections were performed using equiv- alent amounts of each siRNA up to the final siRNA con- centration indicated.
Gene expression analysis by quantitative RT-PCR
Following inhibitor and cytokine treatments, cells were har- vested, lysed in the iScript RT-qPCR sample preparation reagent (170–8899, Bio-Rad Laboratories) at a concentra- tion of 4×10⁵ cells/ml and 1l was used for cDNA syn- thesis using the iScript cDNA Synthesis kit (170–8891, Bio- Rad Laboratories), following the manufacturer’s instruc- tions. Quantitative PCR was performed on a RotorGene Q (Qiagen) using a 2-step PCR program (95◦C 15 s, 60◦C 60 s; 40 cycles). Twenty microliter quantitative PCR reactions were performed using 0.4 l cDNA template and a self- made master-mix containing SYBR Green I and HotStar- Taq (Qiagen). Mouse-specific quantitative PCR primers used are listed in Supplementary Table S1. Data were nor- malized to mouse S9 or 36b4 ribosomal mRNAs and ex- pressed as relative mRNA levels, like previously reported (4,36,40,41,43,67). Data are mean±SD of the quantitative PCR performed in either duplicate or triplicate and are rep- resentative of at least two independent experiments.
Quantitative chromatin immunoprecipitation (ChIP) assays ChIP of STAT5, RNA polymerase II, total histone H3, acetylated histones H3/H4 and Brd2 (Ba/F3 cells) was per- formed from whole cell extracts as previously described (36,40,43). Improved Brd2 detection in Ba/F3–1*6 cells by ChIP was achieved using an alternative protocol of nu- clei fractionation and chromatin shearing, adapted from M´etivier et al. (68) and Okada and Fukagawa (69) re- spectively, with the following modifications. Formaldehyde- crosslinked cells (36,40,43) were sequentially lysed follow- ing M´etivier’s protocol (68). Nuclei were resuspended in HDG150 buffer (20 mM HEPES pH 7.6, 150 mM KCl, 10%
glycerol, 0.5 mM DTT, 10 mM NaF, 10g/ml leupeptin, 10g/ml aprotinin, 0.5 mM phenylmethylsulfonyl fluoride) and sonicated six times for 20 s on a Branson Sonifier 250 (output 3, 50% duty cycle). Chromatin was further frag- mented by MNase digest (SIGMA N-3755; reconstituted in 5 mM Tris pH 6.8, 50 mM NaCl, 50% glycerol) using
0.25 U MNase/106cells for 60 min at +4◦C in the presence of 3 mM CaCl2. MNase activity was stopped with 5 mM EGTA and the sheared nuclear lysate was diluted 5-fold in immunoprecipitation (IP) buffer (40). After centrifugation (3000 xg, 10 min at +4◦C), the supernatant was further pre- cleared against protein A-sepharose and ChIP conducted as previously described (36,40,43), using 3g of Brd2-specific antibody or of rabbit IgG as a control.
Co-precipitated genomic DNA was quantified by quan- titative PCR using primers listed in Supplementary Table S1. Data are expressed as percentage (%) of input DNA or––when histone H3 and H4 acetylation was normalized to histone H3 content––as Ac-H3/H3 and Ac-H4/H3 % of input DNA ratios. Data are mean±SD of the quantita- tive PCR performed in either duplicate or triplicate and are representative of at least two independent experiments.
Protein analysis
For Brij whole-cell protein lysis, cells were resuspended in Brij Lysis buffer (10 mM Tris-HCl pH 7.5, 150 mM NaCl, 2 mM EDTA pH 8.0, 0.875% Brij 97, 0.125% NP40, 10 mM NaF, 1 mM Na3VO4, 10g/ml leupeptin, 10g/ml apro- tinin, 0.5 mM phenylmethylsulfonyl fluoride), lysed by incu- bation 30 min at +4◦C with occasional stirring, and debris was eliminated by centrifugation for 15 min at 20,000 xgat +4◦C.
Freeze-thaw whole-cell protein lysis for the analysis of hi- stone protein level and acetylation was performed as previ- ously described (43).
For cytosolic and nuclear protein lysis, cells were gen- tly resuspended in buffer A (10 mM HEPES pH 7.6, 15 mM KCl, 2 mM MgCl2, 0.1 mM EDTA, 10 mM NaF, 10g/ml leupeptin, 10 g/ml aprotinin, 0.5 mM phenyl- methylsulfonyl fluoride) containing 0.1–0.2% NP40, cen- trifuged at 500 xgfor 1 min and the supernatant collected (cytosolic fraction). Nuclei were washed once in buffer A and lysed by incubation 30 min at +4◦C in buffer C (50 mM HEPES pH 7.9, 400 mM KCl, 0.1 mM EDTA, 10% glyc- erol, 10mM NaF, 10g/ml leupeptin, 10g/ml aprotinin, 0.5 mM phenylmethylsulfonyl fluoride). Insoluble particles were eliminated by centrifugation (15 min at 20,000 xg) and the cleared supernatant (nuclear fraction) was collected.
For subfractionation of nuclei into soluble and insolu- ble fractions, cells were first lysed in buffer A containing 0.1% NP40 (cytosolic extraction), and nuclei washed once in buffer A, as above. Nuclei were resuspended in Brij Lysis buffer and incubated for 30 min at +4◦C on a rotating wheel.
After centrifugation at 1000 xg, the supernatant containing the soluble nuclear proteins was collected. The insoluble nu- clear pellet was resuspended in the same volume of Brij Ly- sis buffer, freezed-thawed once and treated with 0.1 mg/ml DNase I in the presence of 7 mM MgCl2 for 30 minutes at +4◦C on wheel. One volume of 2x Laemmli buffer con- taining-mercaptoethanol was added, samples were heated at 95◦C for 10 minutes while vortexed regularly. Denatured samples were centrifuged 10 minutes at maximum speed at room temperature, to eliminate remaining insoluble debris, and the supernatant corresponding mainly to the chromatin fraction was collected. It should be noted that a small vis- cous pellet remained at this last centrifugation step, indicat-
at Universitaetsbibliothek Regensburg on March 20, 2015http://nar.oxfordjournals.org/Downloaded from
ing that a certain amount of undigested DNA and possibly associated proteins were not extracted.
Immunoblotting was performed as recently described (36).
Gel filtration
For gel filtration chromatography and analysis of STAT5- containing protein complexes, nuclear lysates from 5×10⁷ Ba/F3–1*6 cells treated for 60 min with 200 nM TSA or 0.02% DMSO (vehicle) were prepared in buffer C as de- scribed above, dialyzed 50 min against GF buffer (25 mM HEPES pH 7.2, 0.1 M KCl, 0.1 mM EDTA, 5% glycerol, 1 mM DTT, 100 g/ml insulin, 1 mM phenylmethylsul- fonyl fluoride, 2 mM benzamidine-HCl) and debris was re- moved by centrifugation. TSA-treated samples were pro- cessed in buffers containing 20 nM TSA. Sample volume was adjusted to 600l and 500l was loaded on a TSK- Gel 4000SW column (Tosoh Bioscience) and separated us- ing ¨AKTA FPLC system (GE Healthcare). Thyroglobulin (669 kDa) and BSA (66 kDa) were used as protein stan- dards. Proteins were eluted in GF buffer at a flow rate of 0.5 ml/min. Fractions of 500l volume were collected and analysed by western blot using antibodies directed against FLAG tag (recognizing mSTAT5A-1*6-FLAG fusion pro- tein), STAT5A+B and RNA polymerase II.
RESULTS
STAT5 acetylation at multiple lysines is not essential for its transcriptional activity in Ba/F3 cells
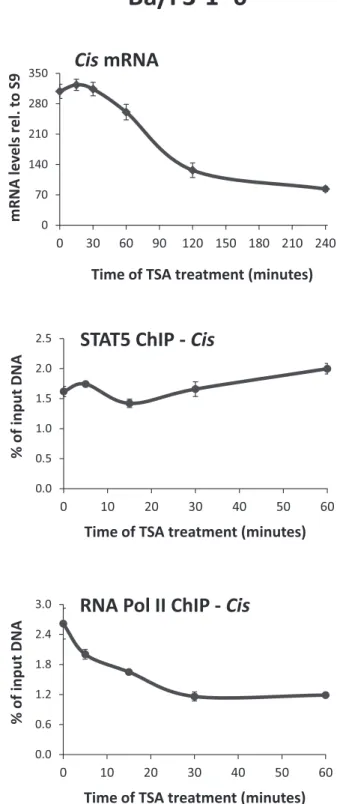
We showed before that deacetylase inhibitors such as TSA, SAHA or NaB inhibit STAT5 transcriptional activity by preventing recruitment of TBP and RNA polymerase II to the promoter of target genes such as Cis and Osm, at a step following STAT5 binding to DNA (40). STAT proteins, in particular STAT3 and STAT5, are known to be regu- lated by acetylation of multiple lysines (8–10,53–56). There- fore, we investigated whether alteration of STAT5 acety- lation might explain the observed effect of deacetylase in- hibitors on STAT5 activity by introducing mutations at spe- cific lysine residues. To prohibit a possible interference with STAT5 initial activation (phosphorylation, dimerization, nuclear translocation, DNA binding) and instead directly address an effect on STAT5 transcriptional activity, muta- tions were introduced in the constitutively active STAT5A- 1*6 protein (66). So far, inhibition of STAT5 transcrip- tional activity by deacetylase inhibitors was only demon- strated in cells expressing wild-type STAT5 (40,41). There- fore, we first verified that constitutive activity of STAT5A- 1*6 was equally sensitive to TSA. Upon treatment of IL-3- independent Ba/F3–1*6 cells with 200 nM TSA, constitu- tive expression of STAT5 target genes such asCiswas down- regulated (Figure1and data not shown). ChIP assays con- firmed that RNA polymerase II occupancy at theCistran- scription start site was reduced in a time-dependent man- ner, in correlation with the transcriptional inhibition, while STAT5 DNA binding activity remained unaffected (Figure 1). Thus, in line with our reported observations on wild- type STAT5 in Ba/F3 cells (40,41), transcription mediated
0 70 140 210 280 350
0 30 60 90 120 150 180 210 240
mRNA levels rel. to S9
Time of TSA treatment (minutes)
Cis mRNA
0.0 0.5 1.0 1.5 2.0 2.5
0 10 20 30 40 50 60
% of input DNA
Time of TSA treatment (minutes)
STAT5 ChIP - Cis
0.0 0.6 1.2 1.8 2.4 3.0
0 10 20 30 40 50 60
% of input DNA
Time of TSA treatment (minutes)
RNA Pol II ChIP - Cis
Ba/F3-1*6
Figure 1. Constitutive STAT5 activity is inhibited by the deacetylase inhibitor TSA. Ba/F3–1*6 cells expressing mouse constitutive active STAT5A-1*6 mutant were treated with 200 nM TSA and harvested at the indicated times. Expression of the STAT5 target geneCiswas investigated by quantitative RT-PCR. Binding of STAT5A-1*6 to theCispromoter and recruitment of RNA polymerase II to the transcription start site of theCis gene were monitored by ChIP using primers Cis -188/-104 and -18/+55, respectively (Supplementary Table S1).
at Universitaetsbibliothek Regensburg on March 20, 2015http://nar.oxfordjournals.org/Downloaded from
STAT5A
STAT5A-1*6
S710F H298R
1 145 331 497 593 702 793
Coiled-coil
N-term. DBD Linker SH2 TAD
P-Tyr
* *
K84 K359
K384 K681
K675 K689 K696 K700
A
B
h STAT5A (661-704) m STAT5A (661-704) h STAT5B (661-709) m STAT5B (661-709)
PDRPKDEVFSKYYTPV----L-AKAVDGYVKPQIKQVVP PDRPKDEVFAKYYTPV----L-AKAVDGYVKPQIKQVVP PDRPKDEVYSKYYTPVPCESATAKAVDGYVKPQIKQVVP PDRPKDEVYSKYYTPVPCEPATAKAADGYVKPQIKQVVP
* * * * * Y694
K681
K675 K689 K696 K700
2xQ/R 3xQ/R 5xQ/R
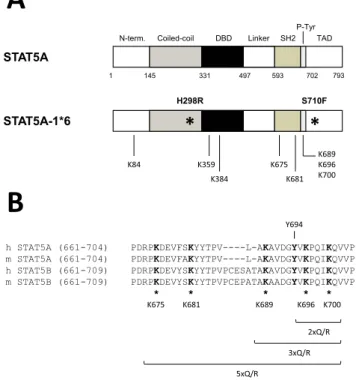
Figure 2.Structure of the STAT5A-1*6 lysine mutants. (A) Schematic rep- resentation of mouse wild-type and constitutively active (1*6) STAT5A proteins. STAT5A-1*6 presents two point mutations (H298R, S710F; *) responsible for its constitutive activity (66). STAT5A and STAT5A-1*6 cDNAs were subcloned into the pcDNA3 expression vector, in frame with a C-terminal FLAG tag (not shown), to allow protein detection by western blot. Specific lysine residues (K84, K359, K384, K675, K681, K689, K696, K700) were mutated to glutamine (Q) or to arginine (R) by site-directed mutagenesis. (B) Sequence alignment of the C-terminal SH2 and transactivation domains of mouse (m) and human (h) STAT5A and STAT5B highlighting conserved lysine residues (*). Lysine residues mu- tated within mouse STAT5A-1*6 C-terminal domain are specified (K675, K681, K689, K696, K700). Double (2xQ/R), triple (3xQ/R) and quintuple (5xQ/R) STAT5A-1*6 lysine mutants were also generated, as indicated.
The essential and constitutively phosphorylated tyrosine Y694 of mouse STAT5A-1*6 was also mutated into phenylalanine (Y694F), as a control for STAT5A-1*6 inactivation. N-term., N-terminal domain; DBD, DNA binding domain; P-Tyr, phospho-tyrosine tail; TAD, transactivation do- main.
by constitutively active STAT5A-1*6 is also impaired upon treatment with deacetylase inhibitors, likely through desta- bilization of the transcriptional machinery.
Lysine to glutamine (K>Q) and lysine to arginine (K>R) substitutions that mimic the acetylated or unmodified lysine respectively (70) were then introduced into STAT5A-1*6.
Lysine residues that were proposed to be critical for the reg- ulation of STAT5 but also of STAT3 at equivalent positions (8–10,53–56,60)––namely K84, K359, K384, K675, K681, K689, K696 and K700––were mutated either individually or in combination (Figure2). Transcriptional activity of the STAT5A-1*6 lysine mutants was assessed upon transfec- tion in Ba/F3 cells maintained in IL-3-free medium, hence in conditions where endogenous wild-type STAT5 is inac- tive. Expression (protein level) and activation (phosphory- lation) of the respective STAT5A-1*6 mutants were verified by western blot, and their transcriptional activity was evalu- ated by measuring expression of the STAT5 target geneCis
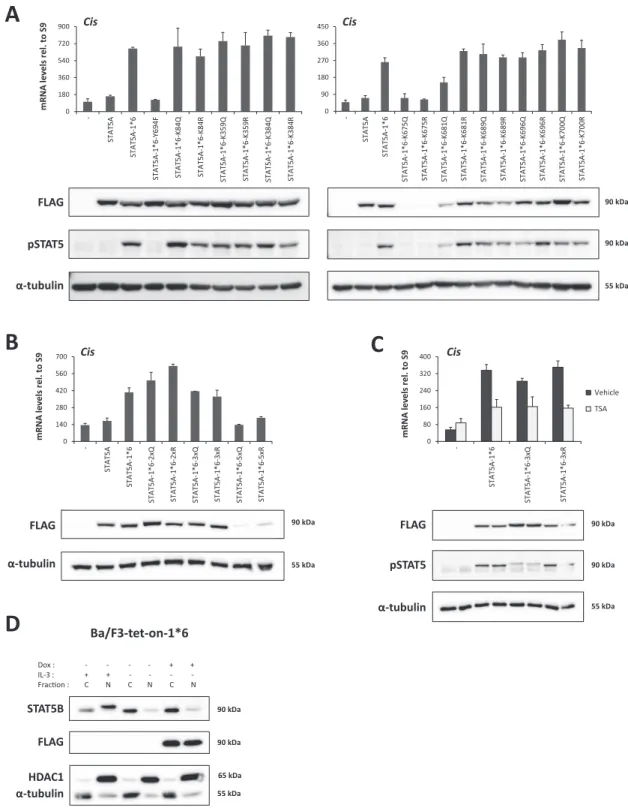
by quantitative RT-PCR. Neither single nor multiple lysine mutations impaired STAT5A-1*6 transcriptional activity (Figure3A and B). Of note, STAT5A-1*6 proteins mutated at lysine 675 (K675Q, K675R as well as 5xQ and 5xR) were poorly detectable in western blot, likely due to protein insta- bility, and thus their activity could not be readily assessed.
Nevertheless, these results indicate that acetylation at the investigated lysines, notably at K359, K689 or K696 previ- ously reported to be acetylated and important for STAT5 activity (8,10,56), is not required for STAT5A-1*6 activ- ity in Ba/F3 cells. These experiments therefore indicate that the impaired STAT5 transcriptional activity induced by deacetylase inhibitors is unlikely to be due to a change in STAT5 acetylation, at least at the investigated lysines.
This proposition is further supported by the important find- ing that the transcriptional activity of STAT5A-1*6 3xQ/R proteins, mutated simultaneously at K689, K696 and K700, remained sensitive to TSA (Figure3C). Of note, the obser- vation that the STAT5A-1*6 K696Q/R mutants are as ac- tive as the non-mutated STAT5A-1*6 protein indicates that not only acetylation but also SUMOylation at K696 is not required for STAT5A-1*6 transcriptional activity in Ba/F3 cells.
To rule out that the transcriptional activity of the STAT5A-1*6 lysine mutants was mediated by the co- translocation of endogenous wild-type STAT5 proteins to the nucleus––despite the absence of IL-3––we used a Ba/F3-tet-on cell line which allows the conditional ex- pression of STAT5A-1*6 in the presence of doxycycline (Figure3D). The comparison of the level of endogenous nuclear STAT5B proteins before and after induction of STAT5A-1*6 showed no increase of endogenous STAT5 in the nucleus when STAT5A-1*6 was expressed (Figure3D).
In addition, no protein interaction between STAT5A- 1*6 and latent endogenous STAT5B could be detected in co-immunoprecipitation assays (data not shown). It is therefore unlikely that the transcriptional activity of our STAT5A-1*6 mutants is mediated by endogenous STAT5 proteins. Overall, our data strongly argue against an impli- cation of STAT5 acetylation in the mechanism of inhibition of STAT5-induced transcription by deacetylase inhibitors.
On the other hand, we cannot fully exclude that an essential not-yet-described lysine within STAT5 may account for the observed effect.
Our initial hypothesis assumed that alteration of STAT5 acetylation might disrupt protein–protein interactions be- tween STAT5 and the transcriptional machinery. We there- fore compared the profiles of STAT5- and RNA polymerase II-containing complexes in nuclear extracts from Ba/F3–
1*6 cells treated for 1 h with 200 nM TSA or DMSO (ve- hicle), which were produced by gel filtration chromatogra- phy (Supplementary Figure S1). No apparent alterations in the elution profiles were noticed upon treatment with the deacetylase inhibitor.
Taken together, these experiments indicate that TSA- mediated inhibition of STAT5 target gene expression occurs independently of STAT5 acetylation and is not associated with an apparent disruption of STAT5-containing protein complexes.
at Universitaetsbibliothek Regensburg on March 20, 2015http://nar.oxfordjournals.org/Downloaded from
A
FLAG pSTAT5 α-tubulin
B C
FLAG α-tubulin
FLAG pSTAT5 α-tubulin
D
Dox : - - - - + + IL-3 : + + - - - - Fracon : C N C N C N
STAT5B FLAG HDAC1 α-tubulin
Ba/F3-tet-on-1*6
0 90 180 270 360 450
- STAT5A STAT5A-1*6 STAT5A-1*6-K675Q STAT5A-1*6-K675R STAT5A-1*6-K681Q STAT5A-1*6-K681R STAT5A-1*6-K689Q STAT5A-1*6-K689R STAT5A-1*6-K696Q STAT5A-1*6-K696R STAT5A-1*6-K700Q STAT5A-1*6-K700R
Cis
0 180 360 540 720 900
- STAT5A STAT5A-1*6 STAT5A-1*6-Y694F STAT5A-1*6-K84Q STAT5A-1*6-K84R STAT5A-1*6-K359Q STAT5A-1*6-K359R STAT5A-1*6-K384Q STAT5A-1*6-K384R
mRNA levels rel. to S9 Cis
0 140 280 420 560 700
- STAT5A STAT5A-1*6 STAT5A-1*6-2xQ STAT5A-1*6-2xR STAT5A-1*6-3xQ STAT5A-1*6-3xR STAT5A-1*6-5xQ STAT5A-1*6-5xR
mRNA levels rel. to S9 Cis
0 80 160 240 320 400
- STAT5A-1*6 STAT5A-1*6-3xQ STAT5A-1*6-3xR
mRNA levels rel. to S9 Cis
Vehicle TSA
90 kDa
90 kDa
55 kDa
90 kDa
55 kDa
90 kDa
90 kDa
55 kDa
90 kDa
90 kDa
55 kDa 65 kDa
Figure 3. Lysine acetylation is not required for STAT5A-1*6 transcriptional activity in Ba/F3 cells. (A–C) Ba/F3 cells were transfected with empty pcDNA3 (-) or pcDNA3-based plasmids expressing wild-type mSTAT5A, constitutively active mSTAT5A-1*6 or mSTAT5A-1*6 mutants (K>Q, K>R and Y694F), as indicated. Transfected cells were maintained for 10 h in IL-3-free medium to prevent activation of endogenous STAT5. In (C), transfected cells were treated with 200 nM TSA or 0.02% DMSO (vehicle) for the last 90 min before harvest. Transgene expression and phosphorylation of STAT5 proteins were verified by western blot analysis of Brij whole-cell lysates using FLAG- and pSTAT5-specific antibodies, respectively.␣-Tubulin was used as a loading control. Expression of the STAT5 target geneCiswas investigated by quantitative RT-PCR, as before. Of note, data not shown suggest that the weaker pSTAT5 signal consistently detected for the 3xQ mutant is likely due to epitope masking, probably as a result of multiple adjacent K>Q mutations surrounding the phospho-tyrosine residue. (D) Ba/F3-tet-on-1*6 cells were grown for 22 h in the absence or presence of 1g/ml doxycycline (Dox) to induce mSTAT5A-1*6 expression. Cells were kept in IL-3-containing medium for the first 12 h, washed twice in RPMI 1640 and further cultivated in IL-3-deprived medium for 10 h (±Dox, -IL-3) until harvest to inactivate endogenous STAT5 activity. As a positive control for endogenous STAT5 activity, non-induced cells were maintained in IL-3-containing medium (-Dox, +IL-3) for the duration of the experiment (22 h). Cytosolic and nuclear protein lysates were analysed by western blot to monitor endogenous nuclear STAT5B protein level (STAT5B) before and after induction of STAT5A-1*6 (FLAG).␣-Tubulin and HDAC1 served as cytosolic and nuclear markers, respectively, to verify the quality of cell fractionation.
at Universitaetsbibliothek Regensburg on March 20, 2015http://nar.oxfordjournals.org/Downloaded from
STAT5 target gene expression is differentially affected by class I-selective deacetylase inhibitors
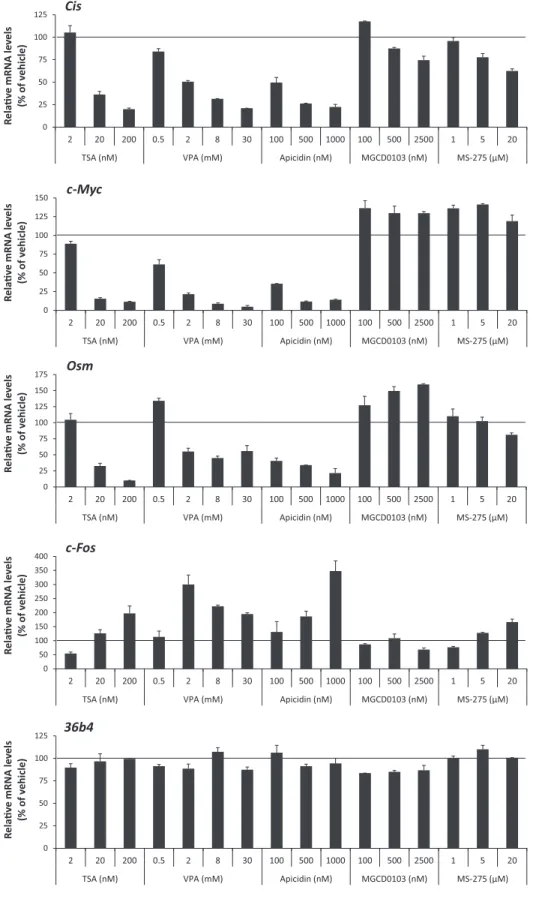
We next aimed to identify which of the 11 deacetylases (HDAC1–11) described so far (63,64) might be implicated in the effect mediated by deacetylase inhibitors. First, class I-selective deacetylase inhibitors were tested for their ability to inhibit STAT5 target gene expression. Then, the conse- quences of siRNA-mediated knockdown of putative HDAC candidates on STAT5 target gene expression were inves- tigated. Ba/F3 cells were pre-treated 30 minutes with in- creasing amounts of VPA, apicidin, MGCD0103 and MS- 275 before stimulation with IL-3 for 1 h. Expression of STAT5 target (Cis,c-Myc,Osm) and control (c-Fos,36b4) genes (4,36,40,41,43) was measured by quantitative RT- PCR (Figure 4 and Supplementary Figure S2). Similarly to TSA (Figure4and (40)), VPA and apicidin specifically inhibited STAT5-mediated transcription ofCis,c-Mycand Osm, while upregulating expression of the control genec- Fos. By contrast, treatment with MGCD0103 and MS-275 had either marginal or no effects on the expression of all genes investigated. Expression of the Housekeeping gene 36b4remained unaffected in all conditions (Figure4). The deacetylase inhibitor concentrations used were in the range of the IC50 reported in the literature for thein vitroinhi- bition of recombinant human HDACs (Supplementary Ta- ble S2), and therefore were only indicative of their potential activity in cell culture. Nevertheless, the comparison of the concentration of deacetylase inhibitor necessary to inhibit STAT5 activity in Ba/F3 cells to the reported IC50(Supple- mentary Table S2) supported the possibility that HDAC5, 7, 9 and 10 might represent potential candidate deacetylases for the regulation of STAT5 activity. Before knocking down the expression ofHDACgenes, expression levels of individ- ual HDACs in Ba/F3 cells were characterized by quantita- tive RT-PCR. While HDAC9 and HDAC11 mRNA levels were below the limit of detection, HDAC1–8 and HDAC10 were expressed at various levels in Ba/F3 cells, regardless of the presence of IL-3 (Supplementary Figure S3). Thus, the potential candidate HDAC9 is unlikely to be involved in TSA-mediated inhibition of STAT5 activity. Together, this preliminary screen suggested a possible implication of HDAC5, HDAC7 and/or HDAC10.
siRNA-mediated knockdown assays were then con- ducted to identify the HDAC(s) implicated in the regu- lation of STAT5-mediated transcription. Multiple experi- ments were conducted both in IL-3-stimulated Ba/F3 cells and in Ba/F3–1*6 cells, targeting not only the candidate HDACs mentioned above but also all 11 HDACs, individ- ually as well as in a number of combinations (Supplemen- tary Figure S4). The knockdown efficiency was verified at the RNA levels and, when western-blot-grade antibodies were available, at the protein level. Unexpectedly, none of the HDAC knockdowns performed had an effect on the ex- pression of STAT5 target genes (Supplementary Figure S4).
The observation that transfection of HDAC-specific siR- NAs did not mimic the inhibitory effect of deacetylase in- hibitors suggests that the knockdown efficiency was not suf- ficient or/and that several HDACs are functionally redun- dant. In support to these propositions, the level of histone acetylation in cells transfected with HDAC1-, 2-, 3- or 5-
specific siRNAs was only marginally increased (Supplemen- tary Figure S4F). On the other hand, transfection of HDAC expression plasmids had no effect on STAT5 target gene ex- pression and histone acetylation (data not shown). In sum- mary, the initial screen using class I-selective deacetylase in- hibitors suggested a subset of HDACs as candidates pos- sibly involved in STAT5 target gene expression. However, neither downregulation nor overexpression of the respective HDACs allowed a definite identification. Consequently, we decided to find alternative explanations for the observation that deacetylase inhibitors differentially affect STAT5 tar- get gene expression.
Histone acetylation is strongly and rapidly increased upon treatment with deacetylase inhibitors that inhibit STAT5- mediated transcription
Since STAT5 acetylation did not appear to account for the observed inhibition of STAT5-mediated transcription by the deacetylase inhibitors TSA, VPA and apicidin, we re- assessed the possibility that changes in histone acetylation might be instead involved. We showed before that histone H3 and H4 acetylation along theCisgene was at its low- est level in the vicinity of the STAT5 binding sites, which are located in the proximal promoter (41). Histone acety- lation remained low at the STAT5 binding sites following both IL-3 stimulation and––most importantly––treatment with TSA (41). Moreover, TSA did not markedly alter the level of histone H3 and H4 acetylation at the promoter and within the open reading frame (ORF) of theCisgene dur- ing IL-3 stimulation (41). Consequently, we had proposed that inhibition of STAT5 target gene expression by deacety- lase inhibitors do not incriminate local alterations in his- tone acetylation (40,41). However, it remains possible that major alterations in chromatin structure at other loci might have an indirect impact on the regulation of STAT5 target genes. One drawback of our initial studies was that ChIP re- sults from the analysis of histone acetylation at theCisgene locus could not be corrected for changes in histone occu- pancy, since ChIP-grade and validated histone H3 antibod- ies were not available at that time. We therefore decided to reconsider the possibility that altered histone acetylation is involved in the inhibition of STAT5 target gene transcrip- tion upon treatment with deacetylase inhibitors.
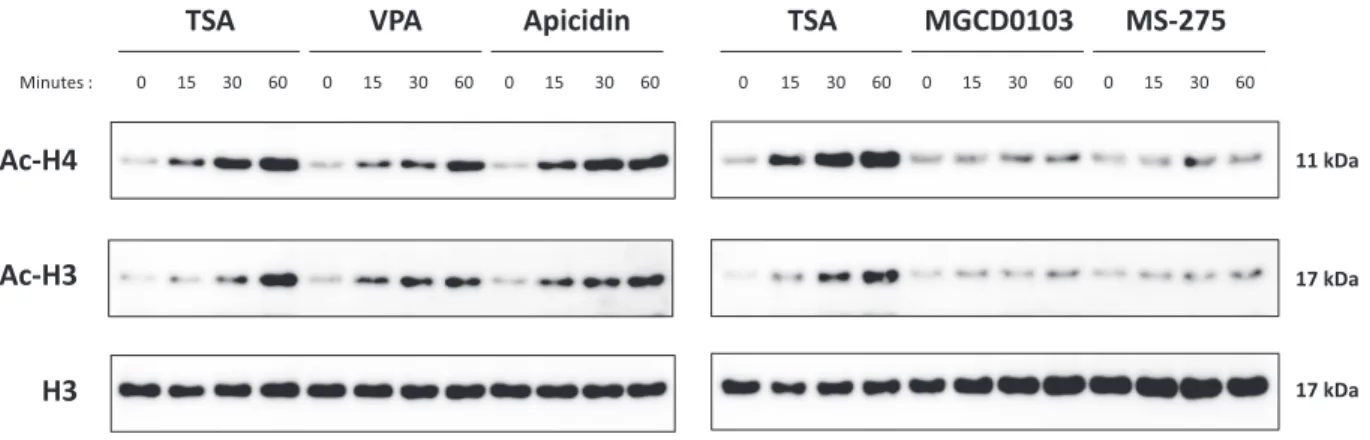
We first investigated the global effect of deacetylase in- hibitors on histone H3 and H4 acetylation. Ba/F3 cells were treated for 0, 15, 30 and 60 min with the deacetylase in- hibitors that were either effective (200 nM TSA, 3 mM VPA, 500 nM apicidin) or ineffective (1M MGCD0103, 5M MS-275) in inhibiting STAT5 target gene expression. His- tone H3 and H4 acetylation was evaluated by western blot, in parallel to total histone H3 as a control (Figure5). In- terestingly, treatment with TSA, VPA and apicidin, but not with MGCD0103 or MS-275, resulted in a strong increase in histone H3 and H4 acetylation in Ba/F3 cells, in a time- dependent manner. This effect was rapid, detectable already after 15 min treatment. The observation that this rapid in- crease in histone acetylation correlated with the observed inhibition of STAT5 transactivation properties raises the possibility that these two events are related. It should be noted that the absence of effect of MGCD0103 and MS-
at Universitaetsbibliothek Regensburg on March 20, 2015http://nar.oxfordjournals.org/Downloaded from
0 25 50 75 100 125
2 20 200 0.5 2 8 30 100 500 1000 100 500 2500 1 5 20
TSA (nM) VPA (mM) Apicidin (nM) MGCD0103 (nM) MS-275 (μM)
Relave mRNA levels (% of vehicle)
Cis
0 25 50 75 100 125 150
2 20 200 0.5 2 8 30 100 500 1000 100 500 2500 1 5 20
TSA (nM) VPA (mM) Apicidin (nM) MGCD0103 (nM) MS-275 (μM)
Relave mRNA levels (% of vehicle)
c-Myc
0 25 50 75 100 125 150 175
2 20 200 0.5 2 8 30 100 500 1000 100 500 2500 1 5 20
TSA (nM) VPA (mM) Apicidin (nM) MGCD0103 (nM) MS-275 (μM)
Relave mRNA levels (% of vehicle)
Osm
0 50 100 150 200 250 300 350 400
2 20 200 0.5 2 8 30 100 500 1000 100 500 2500 1 5 20
TSA (nM) VPA (mM) Apicidin (nM) MGCD0103 (nM) MS-275 (μM)
Relave mRNA levels (% of vehicle)
c-Fos
0 25 50 75 100 125
2 20 200 0.5 2 8 30 100 500 1000 100 500 2500 1 5 20
TSA (nM) VPA (mM) Apicidin (nM) MGCD0103 (nM) MS-275 (μM)
Relave mRNA levels (% of vehicle)
36b4
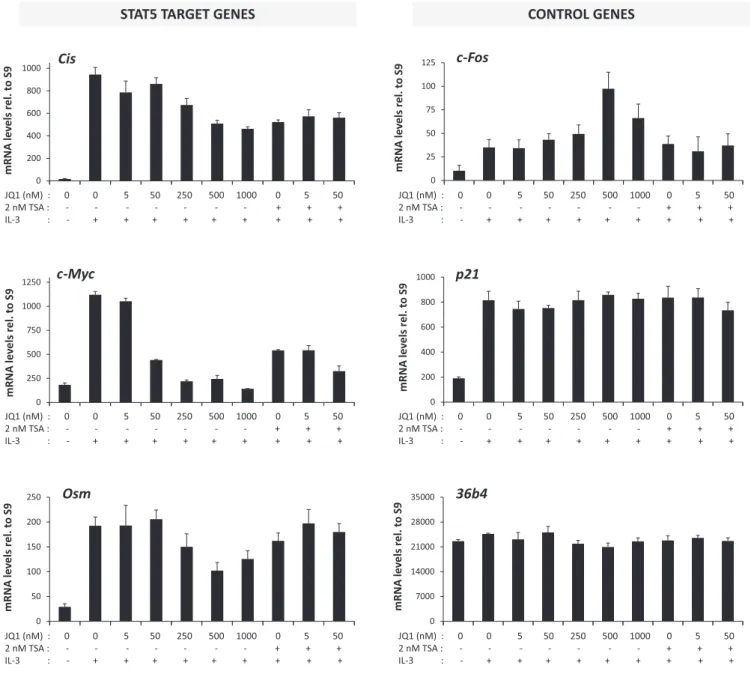
Figure 4. STAT5 activity in Ba/F3 cells is differentially affected by class I-selective deacetylase inhibitors. Rested Ba/F3 cells were pre-treated with the indicated concentrations of the pan-inhibitor TSA and of the class I-selective deacetylase inhibitors VPA, apicidin, MGCD0103 and MS-275 for 15 min (TSA) or 30 min (all others), and further stimulated with IL-3 for 60 min, as described in Materials and Methods section. Final DMSO concentration was adjusted as detailed in legend to Supplementary Figure S2. Expression of STAT5 target (Cis,c-Myc,Osm) and control (c-Fos,36b4) genes was evaluated by quantitative RT-PCR as before. Data are expressed as mRNA levels in IL-3-stimulated cells relative to vehicle control. Non-normalized data are shown in Supplementary Figure S2.
at Universitaetsbibliothek Regensburg on March 20, 2015http://nar.oxfordjournals.org/Downloaded from
TSA VPA Apicidin TSA MGCD0103 MS-275
Minutes : 0 15 30 60 0 15 30 60 0 15 30 60 0 15 30 60 0 15 30 60 0 15 30 60
Ac-H3
H3 Ac-H4
17 kDa
17 kDa 11 kDa
Figure 5. Histone acetylation is rapidly and specifically increased upon treatment with deacetylase inhibitors that inhibit STAT5 activity. Ba/F3 cells were treated for 0–60 min with 200 nM TSA, 3 mM VPA, 500 nM apicidin, 1M MGCD0103 or 5M MS-275. Freeze-thaw protein lysates were analysed by western blot using antibodies directed against acetylated histone H3 (Ac-H3), acetylated histone H4 (Ac-H4) and total histone H3 (H3) as loading control.
275 treatment on global histone H3 and H4 acetylation was likely due to the short duration of treatment applied (up to 90 min). Indeed, increased histone acetylation induced by comparable concentrations of MGCD0103 and MS-275 was demonstrated following 24 h of treatment in various cell lines (71,72). Accordingly, prolonged treatment (10 h) with MS-275 was associated with both increased histone acetyla- tion and reducedCisgene induction (Supplementary Figure S5).
TSA treatment results in alterations in histone occupancy and acetylation at various gene loci and differentially affects RNA polymerase II recruitment
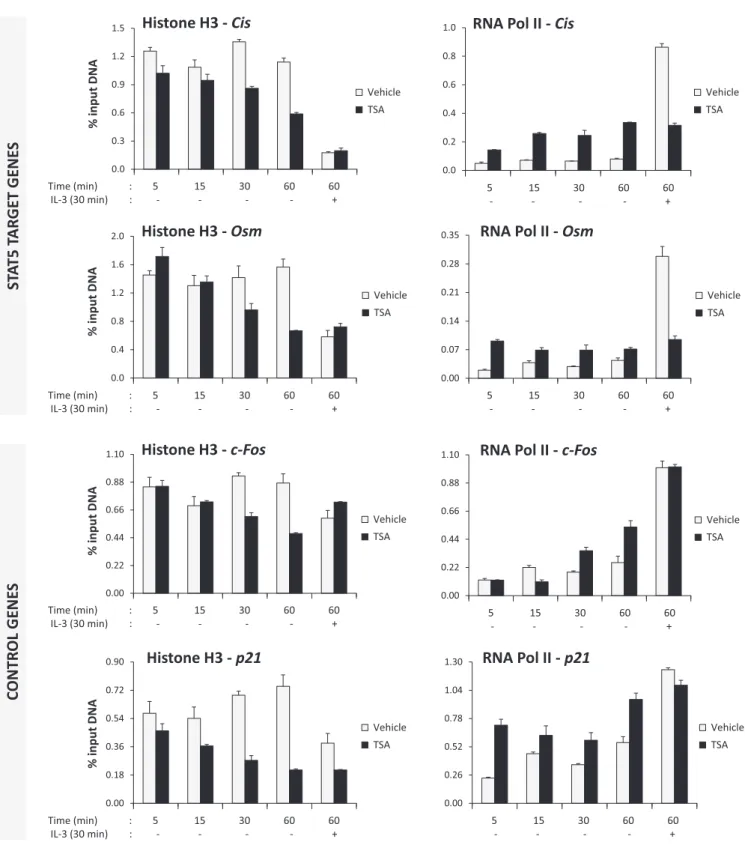
The observed drastic increase in global histone acetylation might have consequences on chromatin organization. Thus, ChIP experiments were performed to analyse histone H3 occupancy, histone H3 and H4 acetylation and RNA poly- merase II recruitment at the STAT5 target genes Cisand Osmand at the control genesc-Fosandp21(40) following treatment with TSA. Bothc-Fosandp21are IL-3 inducible STAT5-independent genes whose expression is upregulated upon treatment with deacetylase inhibitors via a local in- crease in histone acetylation (40,41,73). We first investigated the possible occurrence of chromatin alterations upon treat- ment of unstimulated cells with TSA, that is prior to STAT5 activation. Ba/F3 cells were withdrawn from IL-3 as usual and treated with 200 nM TSA or vehicle for 5, 15, 30 and 60 min. After 30 min TSA pre-treatment, some cells were also stimulated with IL-3 for 30 min. Histone H3 occupancy around the STAT5 binding sites of Cisand Osm (within their proximal promoters) and the proximal promoters ofc- Fosandp21, as well as RNA polymerase II association with the transcription start site (TSS) of the respective genes, were analysed by ChIP (Figure6). Interestingly, the amount of histone H3 detected at the proximal promoters of all four genes was reduced upon TSA treatment in a time-dependent manner. This reduction in histone H3 occupancy might re- flect a global nucleosome instability following increased hi- stone acetylation, in agreement with previous reports (74–
79). Of note, a decrease in histone H3 was also detected at all four proximal promoters upon IL-3 stimulation, suggest-
ing that chromatin remodeling events are also taking place at these IL-3-induced genes, regardless of STAT5 implica- tion. In accordance with our previous reports (40,41), IL- 3-induced recruitment of RNA polymerase II at the STAT5 target genesCisandOsmwas abrogated in the presence of TSA, while it remained unaffected at the control genesc- Fosandp21 (Figure6). In addition, an increase in RNA polymerase II association was detected at all four genes in unstimulated cells following TSA treatment. This increase is likely the consequence of an enhanced chromatin accessibil- ity following increased histone acetylation and nucleosome loss (74–79). However, RNA polymerase II occupancy in TSA-treated unstimulated cells remained reproducibly be- low the level reached in vehicle-treated IL-3-stimulated cells in the cases of Cis and Osm, by contrast to the control genesc-Fos and p21 (Figures6 and 8), suggesting a dis- tinct mode of recruitment of RNA polymerase II on both sets of genes. Together, these data demonstrate that, con- comitantly to a global increase in histone acetylation, TSA treatment results in similar alterations in chromatin struc- ture at multiple genes––as evidenced by a local loss in his- tone H3 occupancy––and differentially affects RNA poly- merase II recruitment at STAT5 target and control genes.
Our data therefore raise the possibility that recruitment of RNA polymerase II at STAT5 target genes might require a chromatin-associated factor(s) which might be lost follow- ing TSA-induced chromatin reorganization. Noteworthy, these TSA-induced chromatin changes occur already in un- stimulated cells, in the absence––hence independently––of nuclear STAT5.
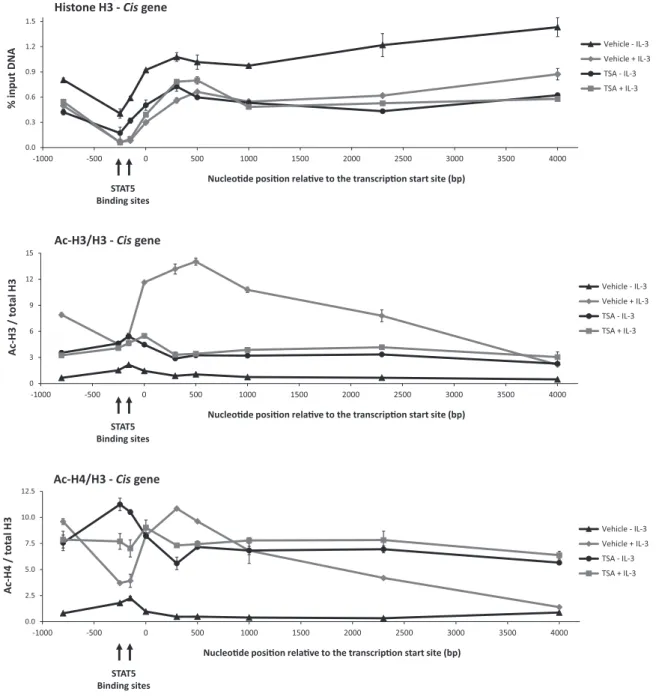
To better characterize the extent of TSA-induced chro- matin alterations, we next investigated histone H3 occu- pancy and histone H3 and H4 acetylation (Ac-H3 and Ac- H4 respectively) along theCisgene locus. Ba/F3 cells were pre-treated 30 min with TSA and further stimulated with IL-3 for 30 min. Following histone H3, Ac-H3 and Ac- H4 ChIPs, co-precipitated genomic DNA was analysed by quantitative PCR using primers covering the -800 to +4000 region (relative to the transcription start site) of theCisgene (Figure7and Supplementary Figure S6). Histone H3 oc- cupancy was lowest around the STAT5 binding sites and decreased equally all along the gene locus upon activation
at Universitaetsbibliothek Regensburg on March 20, 2015http://nar.oxfordjournals.org/Downloaded from
by IL-3 (Figure 7). Following TSA treatment of unstimu- lated cells, histone H3 level decreased uniformly along the gene and remained unchanged upon further stimulation with IL-3. The fact that the TSA-dependent loss of his- tone H3 is not further increased upon IL-3 stimulation cor- relates with the observed inhibition of IL-3-dependentCis expression in TSA-treated cells. To better evaluate changes in histone acetylation following TSA treatment, Ac-H3 and Ac-H4 signals (Supplementary Figure S6) were normalized to histone H3 levels (Figure7). In unstimulated cells, his- tone H3 and H4 acetylation was low all along theCisgene locus. Upon IL-3 stimulation, H3 and H4 acetylation in- creased in the promoter and ORF––in particular within the 5region––but remained low at the STAT5 binding sites, in agreement with our previous data (41). Histone H3 and es- pecially histone H4 acetylation was evenly increased along theCisgene in unstimulated TSA-treated cells and did not markedly change following IL-3 stimulation. Ac-H3 and Ac-H4 pattern in TSA-treated cells (repressed gene) were distinct from those observed in untreated IL-3-stimulated cells (activated gene). Our data therefore revealed that (i) IL-3-induced Cis gene expression correlates with an in- crease in histone H3 and H4 acetylation and a nucleosome loss all along the gene locus, and that (ii) TSA treatment re- sults in a nucleosome loss as well, but in altered histone H3 and H4 acetylation patterns.
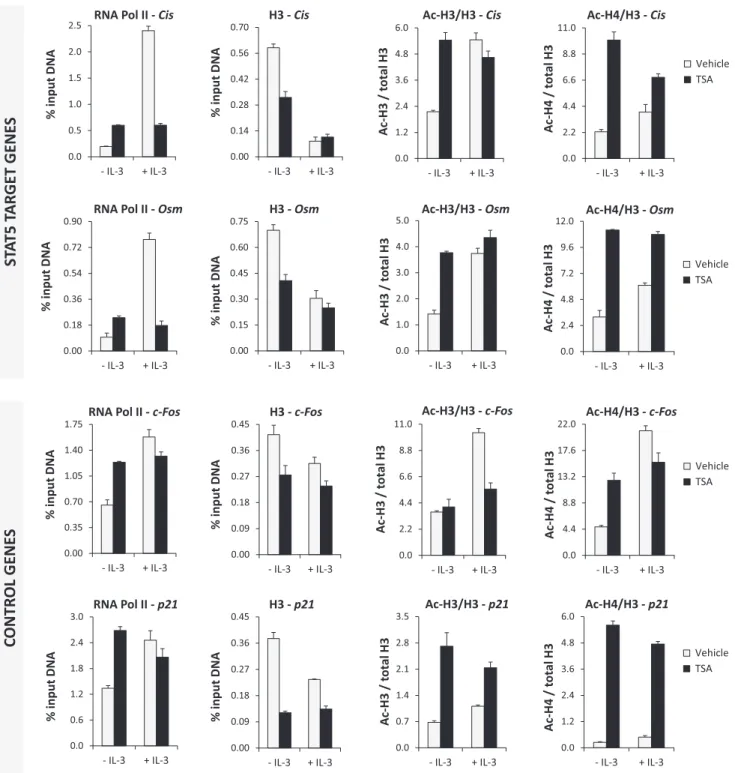
Similar changes in histone acetylation and H3 loss were found not only at the two STAT5 target genesCisandOsm but also at the two control genes c-Fos and p21 investi- gated (Figure 8 and Supplementary Figure S7). Our data therefore suggest that deacetylase inhibitors such as TSA induce a rapid and global increase in histone acetylation, which results in alterations in nucleosome occupancy and histone acetylation at numerous loci, but has different con- sequences for the transcription of specific genes. These dif- ferences point to chromatin-associated factors, in particu- lar those implicated in the recruitment of the transcriptional machinery, whose function might be affected due to changes in histone acetylation following TSA treatment.
STAT5-mediated transcription is inhibited by the small- molecule inhibitor of BET family members (+)-JQ1
One candidate for a chromatin-associated factor inter- acting with both acetylated histones and the transcrip- tional machinery (TBP, RNA polymerase II) is Brd2, which was recently implicated in the regulation of STAT5 ac- tivity in leukemia cell lines (42). Brd2 belongs to the BET proteins. The mammalian BET family comprises be- side Brd2 the Brd3, Brd4 and BrdT proteins. BET fam- ily proteins are transcriptional regulators containing a double bromodomain at their amino-terminus and an extra-terminal protein–protein interaction domain in their carboxy-terminal region (80). They bind to acetylated his- tones and regulate transcription through interactions with transcription factors, multiple chromatin-modifying en- zymes and components of the transcriptional machinery such as TBP and RNA polymerase II (80–86). In support to a role of Brd2 in STAT5-dependent transcriptional regu- lation in Ba/F3 cells, expression of the STAT5 target genes Cis,Osmandc-Mycin response to IL-3 was inhibited by
the BET-specific inhibitor (+)-JQ1 (thereafter referred to as JQ1) in a dose-dependent manner (Figure9). In contrast, expression of the control genesc-Fos,p21and36b4was ei- ther increased or remained unaffected (Figure9). However, no cooperative effect between JQ1 and TSA was found in the presence of sub-optimal concentrations of both com- pounds (Figure9), suggesting that both compounds exert partially overlapping effects.
The BET protein Brd2 is bound to the actively transcribedCis gene and is delocalized upon TSA treatment, presumably to hyperacetylated chromatin
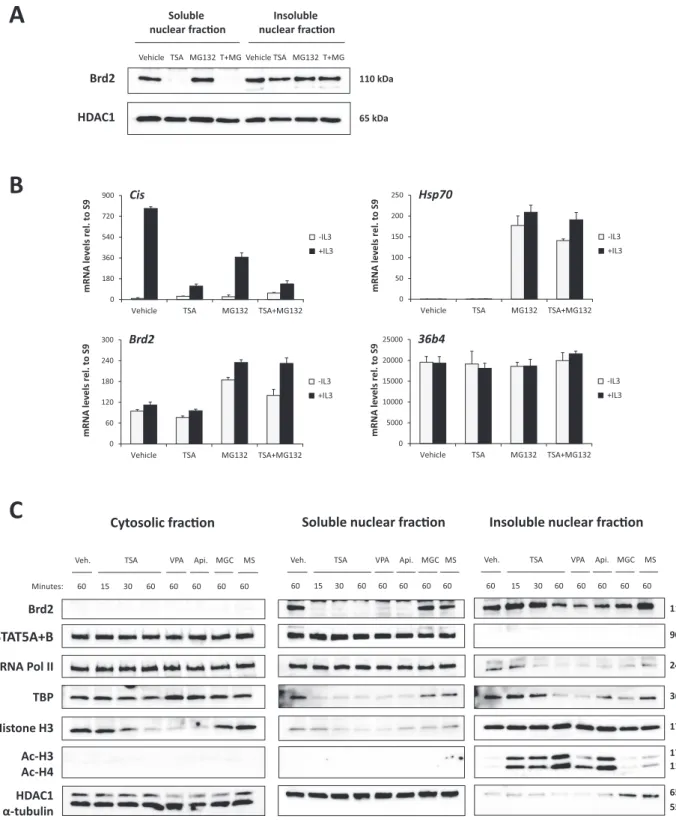
Since the above results suggested a possible implication of Brd2 in STAT5-mediated transcription in Ba/F3 cells, we investigated whether and how TSA could interfere with Brd2 function. We first assessed the subcellular localiza- tion of Brd2 in TSA-treated and untreated Ba/F3 cells by cell fractionation and western blot analysis (Figure 10). Brd2 was exclusively detected in nuclear extracts of Ba/F3 cells (Figure10C), within both the soluble and in- soluble (i.e. mainly chromatin-associated) nuclear fractions (Figure 10A and C). Remarkably, upon TSA treatment, Brd2 protein was depleted from the soluble nuclear frac- tion while it was still detectable in the insoluble nuclear fraction (Figure10A and C). The depletion of Brd2 from the soluble nuclear fraction was not due to proteasome- dependent protein degradation since it was not prevented by pre-treatment with the proteasome inhibitor MG132 (Figure10A). MG132 activity was verified by measuring the mRNA levels ofhsp70(Figure10B), an acknowledged MG132-induced gene (87). The drop in the level of solu- ble nuclear Brd2 protein in TSA-treated cells was also not the consequence of a reducedBrd2gene expression, since Brd2 mRNA levels were not affected by TSA (Figure10B).
These observations suggest that delocalization of nuclear Brd2 from the soluble to the insoluble chromatin fraction following TSA treatment could limit its availability to sup- port STAT5-mediated transcription.
To address that possibility, Brd2 nuclear distribution was evaluated in Ba/F3 cells treated for 15, 30 and 60 min with 200 nM TSA, as well as for 60 min with the deacetylase inhibitors impairing (3 mM VPA, 500 nM apicidin) or do not impairing (1M MGCD0103, 5M MS-275) STAT5 target gene expression (Figure 10C). Brd2 loss from the soluble nuclear fraction was already evident after 15 min of TSA treatment, and was similarly observed upon treat- ment with VPA and apicidin, but not with MGCD0103 or MS-275. Strikingly, Brd2 depletion from the soluble nuclear fraction correlated with the rapid increase in his- tone H3 and H4 acetylation, which was exclusively detected within the insoluble chromatin fraction (Figure 10C). Of note, the soluble cytosolic pool of free histone H3 (88,89) decreased as the chromatin-bound pool of acetylated hi- stones increased, suggesting that histones are rapidly in- corporated into the chromatin upon acetylation induced by TSA, VPA and apicidin. Given that histone H3 occu- pancy decreased simultaneously at the various gene loci in- vestigated, our data suggest a major redistribution of his- tone H3 within the chromatin upon deacetylase inhibitor treatment. Brd2 depletion also correlated with a specific de-
at Universitaetsbibliothek Regensburg on March 20, 2015http://nar.oxfordjournals.org/Downloaded from