molecules
Article
Diarylheptanoid Glycosides of Morella salicifolia Bark
Edna Makule
1,2, Thomas J. Schmidt
3, Jörg Heilmann
1,* and Birgit Kraus
1,*
1
Department of Pharmaceutical Biology, Faculty of Chemistry and Pharmacy, Universität Regensburg, Universitätsstraße 31, D-93053 Regensburg, Germany; edna.makule@nm-aist.ac.tz
2
Department of Food Biotechnology and Nutritional Sciences, Nelson Mandela African Institution of Science and Technology, P.O. Box 447 Arusha, Tanzania
3
Institute of Pharmaceutical Biology and Phytochemistry (IPBP), Westfälische Wilhelms-Universität Münster, PharmaCampus—Corrensstraße 48, D-48149 Münster, Germany; thomschm@uni-muenster.de
* Correspondence: joerg.heilmann@chemie.uni-regensburg.de (J.H.);
birgit1.kraus@chemie.uni-regensburg.de (B.K.); Tel.: +49-941-943-4759 (J.H.);
+49-941-943-4494 (B.K.); Fax: +49-941-943-4990 (J.H.); +49-941-943-4990 (B.K.) Received: 26 October 2017; Accepted: 4 December 2017; Published: 19 December 2017
Abstract: A methanolic extract of Morella salicifolia bark was fractionated by various chromatographic techniques yielding six previously unknown cyclic diarylheptanoids, namely, 7-hydroxymyricanol 5-O- β -
D-glucopyranoside (1), juglanin B 3-O- β -
D-glucopyranoside (2), 16-hydroxyjuglanin B 17-O- β -
D-glucopyranoside (3), myricanone 5-O- β -
D-gluco-pranosyl-(1 → 6)-β-
D-glucopyranoside (4), neomyricanone 5-O- β -
D-glucopranosyl-(1 → 6)- β -
D-glucopyranoside (5), and myricanone 17-O-α-
L-arabino-furanosyl-(1 → 6)-β-
D-glucopyranoside (6), respectively, together with 10 known cyclic diarylheptanoids. The structural diversity of the diarylheptanoid pattern in M. salicifolia resulted from varying glycosidation at C-3, C-5, and C-17 as well as from substitution at C-11 with hydroxy, carbonyl or sulfate groups, respectively. Structure elucidation of the isolated compounds was achieved on the basis of one- and two-dimensional nuclear magnetic resonance (NMR) as well as high-resolution electrospray ionisation mass spectrometry (HR-ESI-MS) analyses. The absolute configuration of the glycosides was confirmed after hydrolysis and synthesis of O-(S)-methyl butyrated (SMB) sugar derivatives by comparison of their
1H-NMR data with those of reference sugars. Additionally, absolute configuration of diarylheptanoid aglycones at C-11 was determined by electronic circular dichroism (ECD) spectra simulation and comparison with experimental CD spectra after hydrolysis.
Keywords: Morella salicifolia; Myricaceae; diarylheptanoid glycosides; myricanol; juglanin
1. Introduction
Morella salicifolia (H
OCHST.
EXA. R
ICH.) V
ERDC. & P
OLHILLbelongs to the family Myricaceae in the order Fagales. It was formerly named Myrica salicifolia H
OCHST. ex A. R
ICH. until the genus Myrica was divided into two genera: Myrica and Morella. M. salicifolia now belongs to the genus Morella, with the new accepted name Morella salicifolia (H
OCHST. ex A. R
ICH.) V
ERDC. & P
OLHILL. (syn. Myrica salicifolia H
OCHST. ex A. R
ICH.) [1]. M. salicifolia is reported to be spread in many mountainous ranges in Tanzania above 1200 m and prefers shallow soil, heath, and rocky areas [2].
The species is distributed mainly in Tanzania, Kenya, Uganda, Rwanda, Burundi, Ethiopia, Democratic Republic of the Congo, Yemen, and Saudi Arabia [2,3]. Traditional medicinal use of M. salicifolia has been previously reported in Tanzania where it is used for the treatment of cough, toothache, decoction, tonic, stomach troubles, skin diseases [4], headaches [5], and opportunistic diseases of human immunodeficiency virus/acquired immune deficiency syndrome such as tuberculosis, chronic diarrhoea, cryptococcal meningitis, and herpes simplex [6]. Further, traditional medicinal uses of
Molecules2017,22, 2266; doi:10.3390/molecules22122266 www.mdpi.com/journal/molecules
M. salicifolia have been reported in other countries such as Ethiopia where it is used for the treatment of skin diseases [7], pain, inflammation, and respiratory disorders [8,9]. In Uganda, M. salicifolia has been used for the treatment of male sexual impotence and erectile dysfunction [10].
Despite the many traditional uses of M. salicifolia, literature describing its phytochemical and pharmacological investigation is scarce. A preliminary phytochemical screening of the methanolic extracts of the stem bark and leaves showed the presence of polyphenols, unsaturated sterols/triterpenes, saponins, glycosides, and carbohydrates [11]. Moreover, results from previously conducted biological activity studies on M. salicifolia showed that a methanolic extract of M. salicifolia stem bark was effective against Bacillus cereus, Neisseria gonorrhoeae, Shigella dysenteriae, and Staphylococcus aureus [11,12]. In vivo testing of a methanolic extract of M. salicifolia in mice showed potent analgesic and antipyretic activity at a concentration of 100 mg/kg [13].
To date, no study has reported the isolation of individual compounds from M. salicifolia. Therefore, the aim of this work was the isolation and structure elucidation of secondary metabolites from crude methanolic extract of M. salicifolia bark to explore the documented activity and traditional usage of the drug in future studies.
2. Results
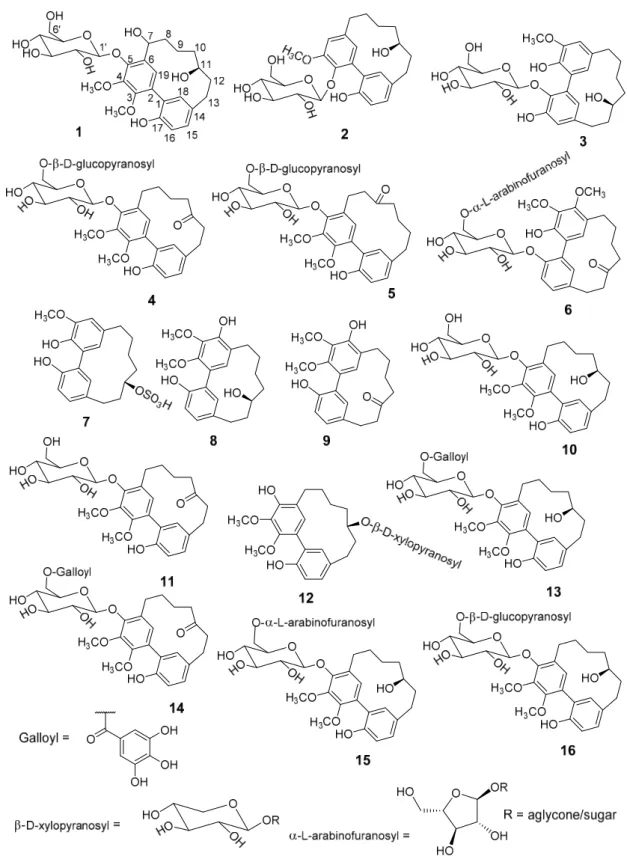
Fractionation of a methanolic extract of M. salicifolia bark resulted in the isolation of 6 unknown (1–6) and 10 known (7–16) cyclic diarylheptanoids of the sub-group meta-meta cyclophane (Figure 1). The known diarylheptanoids were juglanin B-sulfate (7) [14,15], myricanol (8) [16–19], myricanone (9) [16,19], myricanol 5-O- β -
D-glucopyranoside (10) [20], myricanone 5-O- β -
D-glucopyranoside (11) [21], myricanol 11-O- β -
D-xylopyranoside (12) [22], myricanol 5-O-β-
D-(6’-O-galloyl)-glucopyranoside (13) [23], myricanone 5-O-β-
D-(6’-O-galloyl)-glucopyranoside (14) [15], myricanol 5-O-α-
L-arabinofuranosyl-(1 → 6)-β-
D-glucopyranoside (15) [24], and myricanol gentiobiosidse: myricanol 5-O-β-
D-glucopranosyl-(1 → 6)- β -
D-glucopyranoside (16) [23], respectively.
Structure elucidation was done by comprehensive one- and two-dimensional nuclear magnetic resonance (NMR), as well as high-resolution electrospray ionisation mass spectrometry (HR-ESI-MS), sugar hydrolyses, circular dichroism (CD)-analyses, and comparison with published data.
The HR-ESI-MS of compound 1 exhibited ions at m/z 535.2185 [M − H]
−and 1071.4445 [2M − H]
−which are consistent with the molecular formula C
27H
36O
11. The ultraviolet (UV) spectrum (MeOH)
of 1 showed absorption maxima at 213, 250, and 295 nm, which are typical for cyclic biphenyl-type
diarylheptanoids [22,25]. The
1H-NMR spectrum of 1 was similar to published data on compound
10 [20] showing four aromatic protons resonating at δ
H7.02 (1H, dd, J = 2.2, 8.2, H-15), δ
H6.77
(1H, d, J = 8.2, H-16), and δ
H6.87 (2H, s, H-18, H-19). Two aromatic methoxy groups were
observed as one singlet at δ
H3.95 (6H, H
3-20 and H
3-21) and were placed at C-3 and C-4 due to the
[
1H-
13C]-heteronuclear multiple bond correlations (HMBC). Five high-field shifted methylene groups
were observed as multiplets between δ
H1.12 and 2.88 and assigned with the help of [
1H-
1H]-correlated
spectroscopy (COSY) and [
1H-
13C]-HMBC experiments to H-8 ( δ
H2.13, m and δ
H1.97, m), H-9 ( δ
H1.52,
m and δ
H1.15, m), H-10 (δ
H1.79, m and δ
H1.52, m), H-12 (δ
H2.13, m and δ
H1.63, m), and H-13
( δ
H2.84, m). Two methane groups bearing a hydroxy group resonated at δ
H3.84 (m) and 4.92 (dd,
J = 3.6, 11.4) and were assigned to H-11 and H-7 following a proton coupling network from the
COSY and HMBC long-range correlations. Sugar protons typical of a glucose resonating between δ
H3.32 and 3.80 were assigned to H-2
0–H-6
0based on the COSY experiment. The anomeric proton of the
glucose moiety was observed at δ
H5.05 (H-1
0, J = 7.4 Hz), suggesting β -configuration. The position of
the glycosidic linkage was elucidated from the HMBC long-range correlation between H-1
0and C-5
(δ
C150.0). From obtained the UV, NMR (Tables 1 and 2), and HR-MS data, compound 1 was concluded
to be a hitherto undescribed diarylheptanoid, 7-hydroxymyricanol 5-O-β-
D-glucopyranoside, and was
named salicimeckol.
Molecules2017,22, 2266 3 of 15
Molecules 2017, 22, 2266 3 of 15
Figure 1. Structures of the isolated diarylheptanoids from methanolic extract of Morella salicifolia bark.
Compounds 1–6 (new) and 7–16 (known).
Compound 2, as a second previously unknown cyclic diarylheptanoid monoglycoside, was identified as juglanin B 3-O-β-
D-glucopyranoside and named salicireneol A. HR-ESI-MS showed ions at m/z 489.2137 [M − H]
−and m/z 979.4324 [2M − H]
−corresponding to a molecular formula of C
26H
34O
9.Structure elucidation was done in analogy to compound 1 by extensive 1D and 2D NMR measurements.
Figure 1. Structures of the isolated diarylheptanoids from methanolic extract of Morella salicifolia bark.
Compounds 1–6 (new) and 7–16 (known).
Compound 2, as a second previously unknown cyclic diarylheptanoid monoglycoside,
was identified as juglanin B 3-O- β -
D-glucopyranoside and named salicireneol A. HR-ESI-MS showed
ions at m/z 489.2137 [M − H]
−and m/z 979.4324 [2M − H]
−corresponding to a molecular formula of
C
26H
34O
9.Structure elucidation was done in analogy to compound 1 by extensive 1D and 2D NMR
measurements. Accordingly, the
1H- and
13C-NMR data for 2 are in agreement with published data of juglanin B [26,27] complemented by additional sugar signals (Tables 1 and 2).
The molecular mass of compound 3 was deduced from HR-ESI-MS ions at m/z 505.2078 [M − H]
−and 551.2137 [M + HCOO]
−calculated for the molecular formula of C
26H
34O
10. The
1H-NMR of 3 showed four aromatic protons, at δ
H7.04 (H-5, brs), δ
H6.87 (H-19, brs), δ
H6.64 (H-18, brs), and δ
H5.66 (H-15, brs). Furthermore, signals attributed to six aliphatic methylene groups were detected between δ
H0.90 and 2.78 and were assigned to positions H-7–H-10, H-12, and H-13 (Table 1).
One methoxy group resonated at δ
H3.80 (s, 3H) and was assigned to H
3-20 by [
1H-
1H]-rotating-frame nuclear Overhauser effect correlation spectroscopy (ROESY) and HMBC correlations. The anomeric proton of a β-glucopyranosyl moiety was observed at δ
H5.00 (H-1’, d, J = 7.6 Hz) and the glycosidic linkage of 3 was elucidated by an HMBC experiment showing a long-range correlation to C-17 ( δ
C144.7 ppm, Table 2). The position of the hydroxy group at C-11 was deduced from COSY due to lacking long-range correlation signals of H-11 (δ
H3.05, m) in the HMBC experiment. Therefore, compound 3 is 16-hydroxyjuglanin B 17-O- β -
D-glucopyranoside, a hitherto unknown compound and named salicireneol B.
HR-ESI-MS of 4 and 5 showed ions at m/z 679.2682 [M − H]
−and m/z 679.2622 [M − H]
−with the common molecular formula of C
33H
44O
15and calculated mass of 680 Da. The
1H-NMR of 4 showed signals at δ
H3.94 and 3.80 (both s, 3H), which were assigned to the two methoxy groups H
3-20 and H
3-21. Four aromatic protons were assigned to H-15 (7.05, dd, J = 2.1, 8.2), H-16 (6.80, d, J = 8.2), H-18 (6.64, brs), and H-19 (6.57, s) of the aglycone (Table 1). The carbonyl groups at δ
C217.2 ppm were assigned to position C-11 as deduced from the HMBC experiment due to long-range correlations between H-9 ( δ
H1.70, m, 2H), H-10 ( δ
H2.78, m, 1H and δ
H2.65, m, 1H), H-12 ( δ
H2.91, m, 2H), H-13 ( δ
H2.78, m, 1H), and the carbonyl carbon. Further confirmation was achieved from the COSY experiment due to observed cross peaks between H-7 (δ
H2.91, m, 1H and δ
H2.78, m, 1H) and H-8 (1.89, m, 2H), H-8 and H-9 (1.70, m, 2H), H-9 and H-10 (δ
H2.78, m, 1H and δ
H2.65, m, 1H), and H-12 ( δ
H2.91, m, 2H) and H-13 ( δ
H2.78, m, 1H). The anomeric protons of two glucosyl moieties resonated at δ
H4.99 (d, J = 7.2 Hz, H-1’) and δ
H4.28 (d, J = 7.8 Hz, H-1”). Long-range correlations were observed between the anomeric proton H-1’ and C-5 (δ
C149.8 ppm) of the aglycone and the anomeric proton H-1” to C-6’ of the glucose. Therefore, two sugar groups were attached to C-5 of the aglycone and they were confirmed to be two
D-glucose molecules. Hence, the structure of 4 was confirmed to be the hitherto unknown myricanone 5-O- β -
D-glucopranosyl-(1 → 6)- β -
D-glucopyranoside and was given the name saliciclaireone A.
The carbon data of 5 was found to be similar to the published data of neomyricanone 5-O- β -
D-glucopyranoside [22], except that 5 was found to have two 1 → 6 connected glucose moieties attached to C-5. Extensive one- and two-dimensional NMR revealed that compound 5 is neomyricanone 5-O-β-
D-glucopranosyl-(1 → 6)-β-
D-glucopyranoside, a hitherto undescribed compound which was thus named saliciclaireone B. The summarized 1D-NMR data for 4 and 5 were depicted in Tables 1 and 2, respectively.
The HR-ESI-MS of 6 showed a pseudomolecular ion at m/z 649.2509 [M − H]
−in the negative mode, consistent with the molecular formula of C
32H
41O
14. The
1H-NMR spectrum shows 2 methoxy groups at δ
H3.81 and 3.93 ppm (both s, H
3-21 and H
3-20), 4 aromatic protons, and 6 methylene groups. A carbonyl group resonating at δ
C216.1 was assigned to C-11 based on the HMBC experiment showing long-range correlations to δ
H2.80/2.61 (H-10), δ
H2.93/2.79 (H-12), and δ
H2.95 ppm (H-13, 2H). Two anomeric protons observed at δ
H4.97 (H-1’, d, J = 7.2) and δ
H(4.83 H-1” brs), indicated the presence of two sugar moieties with a β -
Dand α -
L-configuration. The positions of glycosidic linkages were elucidated from the HMBC experiment. Long-range correlation was observed between H-1’
(δ
H4.97) and C-17 (δ
C152.7) of the aglycone as well as H-1” (δ
H4.83) and C-6’ (δ
C68.0) of the glucose.
Therefore, it was concluded that the two sugar groups are attached to C-17 of the aglycone. The NMR
signals of the aglycone were similar to those of myricanone (compound 12).
Molecules2017,22, 2266 5 of 15
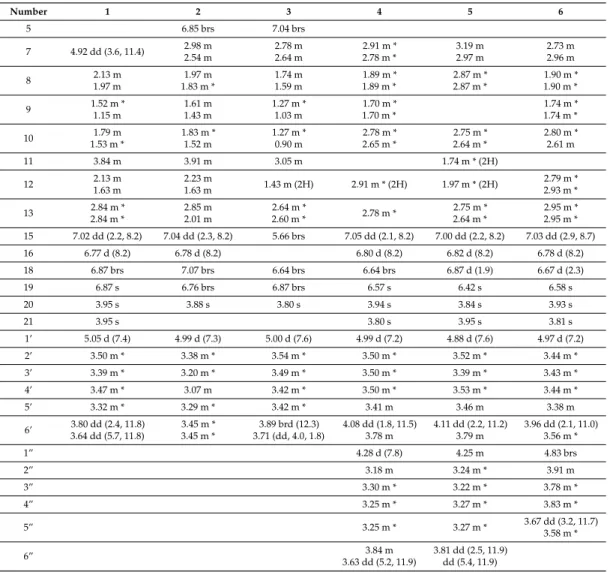
Table 1.
1H-Nuclear magnetic resonance (NMR) data of 1–6 (600 MHz, methanol-d
4, 298 K, δ ppm, mult, J, Hz).
Number 1 2 3 4 5 6
5 6.85 brs 7.04 brs
7 4.92 dd (3.6, 11.4) 2.98 m
2.54 m
2.78 m 2.64 m
2.91 m * 2.78 m *
3.19 m 2.97 m
2.73 m 2.96 m
8 2.13 m
1.97 m
1.97 m 1.83 m *
1.74 m 1.59 m
1.89 m * 1.89 m *
2.87 m * 2.87 m *
1.90 m * 1.90 m *
9 1.52 m *
1.15 m
1.61 m 1.43 m
1.27 m * 1.03 m
1.70 m * 1.70 m *
1.74 m * 1.74 m *
10 1.79 m
1.53 m *
1.83 m * 1.52 m
1.27 m * 0.90 m
2.78 m * 2.65 m *
2.75 m * 2.64 m *
2.80 m * 2.61 m
11 3.84 m 3.91 m 3.05 m 1.74 m * (2H)
12 2.13 m
1.63 m
2.23 m
1.63 m 1.43 m (2H) 2.91 m * (2H) 1.97 m * (2H) 2.79 m *
2.93 m *
13 2.84 m *
2.84 m *
2.85 m 2.01 m
2.64 m *
2.60 m * 2.78 m * 2.75 m *
2.64 m *
2.95 m * 2.95 m * 15 7.02 dd (2.2, 8.2) 7.04 dd (2.3, 8.2) 5.66 brs 7.05 dd (2.1, 8.2) 7.00 dd (2.2, 8.2) 7.03 dd (2.9, 8.7)
16 6.77 d (8.2) 6.78 d (8.2) 6.80 d (8.2) 6.82 d (8.2) 6.78 d (8.2)
18 6.87 brs 7.07 brs 6.64 brs 6.64 brs 6.87 d (1.9) 6.67 d (2.3)
19 6.87 s 6.76 brs 6.87 brs 6.57 s 6.42 s 6.58 s
20 3.95 s 3.88 s 3.80 s 3.94 s 3.84 s 3.93 s
21 3.95 s 3.80 s 3.95 s 3.81 s
1’ 5.05 d (7.4) 4.99 d (7.3) 5.00 d (7.6) 4.99 d (7.2) 4.88 d (7.6) 4.97 d (7.2)
2’ 3.50 m * 3.38 m * 3.54 m * 3.50 m * 3.52 m * 3.44 m *
3’ 3.39 m * 3.20 m * 3.49 m * 3.50 m * 3.39 m * 3.43 m *
4’ 3.47 m * 3.07 m 3.42 m * 3.50 m * 3.53 m * 3.44 m *
5’ 3.32 m * 3.29 m * 3.42 m * 3.41 m 3.46 m 3.38 m
6’ 3.80 dd (2.4, 11.8) 3.64 dd (5.7, 11.8)
3.45 m * 3.45 m *
3.89 brd (12.3) 3.71 (dd, 4.0, 1.8)
4.08 dd (1.8, 11.5) 3.78 m
4.11 dd (2.2, 11.2) 3.79 m
3.96 dd (2.1, 11.0) 3.56 m *
1” 4.28 d (7.8) 4.25 m 4.83 brs
2” 3.18 m 3.24 m * 3.91 m
3” 3.30 m * 3.22 m * 3.78 m *
4” 3.25 m * 3.27 m * 3.83 m *
5” 3.25 m * 3.27 m * 3.67 dd (3.2, 11.7)
3.58 m *
6” 3.84 m
3.63 dd (5.2, 11.9)
3.81 dd (2.5, 11.9) dd (5.4, 11.9)
* Overlapping signals.
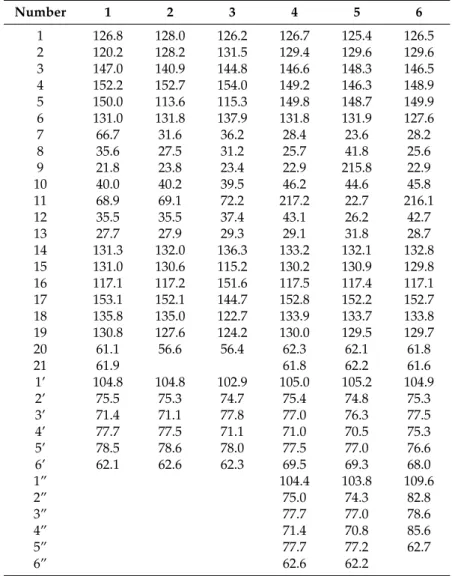
Table 2.
13C-NMR data of 1–6 (150 MHz, methanol-d
4, 298 K, δ ppm).
Number 1 2 3 4 5 6
1 126.8 128.0 126.2 126.7 125.4 126.5
2 120.2 128.2 131.5 129.4 129.6 129.6
3 147.0 140.9 144.8 146.6 148.3 146.5
4 152.2 152.7 154.0 149.2 146.3 148.9
5 150.0 113.6 115.3 149.8 148.7 149.9
6 131.0 131.8 137.9 131.8 131.9 127.6
7 66.7 31.6 36.2 28.4 23.6 28.2
8 35.6 27.5 31.2 25.7 41.8 25.6
9 21.8 23.8 23.4 22.9 215.8 22.9
10 40.0 40.2 39.5 46.2 44.6 45.8
11 68.9 69.1 72.2 217.2 22.7 216.1
12 35.5 35.5 37.4 43.1 26.2 42.7
13 27.7 27.9 29.3 29.1 31.8 28.7
14 131.3 132.0 136.3 133.2 132.1 132.8
15 131.0 130.6 115.2 130.2 130.9 129.8
16 117.1 117.2 151.6 117.5 117.4 117.1
17 153.1 152.1 144.7 152.8 152.2 152.7
18 135.8 135.0 122.7 133.9 133.7 133.8
19 130.8 127.6 124.2 130.0 129.5 129.7
20 61.1 56.6 56.4 62.3 62.1 61.8
21 61.9 61.8 62.2 61.6
1’ 104.8 104.8 102.9 105.0 105.2 104.9
2’ 75.5 75.3 74.7 75.4 74.8 75.3
3’ 71.4 71.1 77.8 77.0 76.3 77.5
4’ 77.7 77.5 71.1 71.0 70.5 75.3
5’ 78.5 78.6 78.0 77.5 77.0 76.6
6’ 62.1 62.6 62.3 69.5 69.3 68.0
1” 104.4 103.8 109.6
2” 75.0 74.3 82.8
3” 77.7 77.0 78.6
4” 71.4 70.8 85.6
5” 77.7 77.2 62.7
6” 62.6 62.2
The attached glycosides were confirmed for β-
D-glucopyranoside and α-
L-arabinofuranoside as described in section of absolute configuration of isolated diarylheptanoids. The furan ring of the α -
L-arabinose was concluded based on its carbon chemical shifts as described by Beier and Mundy [28]. Based on the obtained data, compound 6 was identified to be myricanone 17-O-α-
L-arabinofuranosyl-(1 → 6)-β-
D-glucopyranoside and was named saliciclaireone C.
The 1D-NMR data of compound 6 are summarized in Tables 1 and 2.
1H-NMR of compounds 1–6 can be found in the Supplementary Materials.
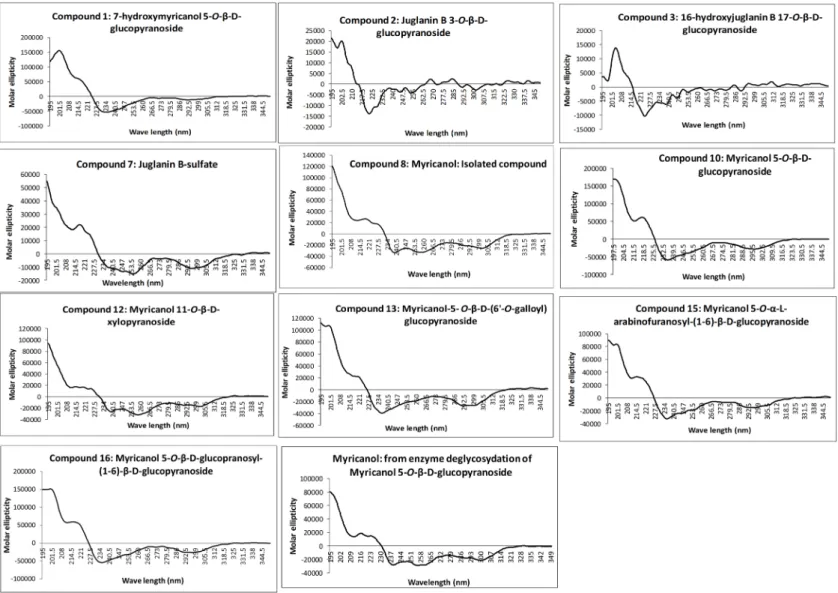
The absolute configuration at C-11 was determined as 11R for all isolated diarylheptanoids by measurement of the CD spectra of the aglycone and comparison with electronic CD spectra simulation.
Recorded experimental CD spectra of the isolated diarylheptanoids and the aglycone obtained from enzyme hydrolysis were found to be very similar (Figure 2) and it was hence concluded that the attached glycosides and sulfate moieties had no influence on conformation of the aglycone and its chromophore. Therefore, CD spectra simulation was performed using myricanol as a model compound.
The myricanol structure contains one chiral center at C-11, which is axially dissymmetric due to the
twisted biphenyl. Thus, the structure of myricanol can occur as two pairs of enantiomers i.e., (R,Ra),
(S,Sa), and (R,Sa), (S,Ra), where “a” stands for the chirality of the axially dissymmetric biphenylic
system [18,29].
MoleculesMolecules 2017, 22, 2266 2017,22, 2266 7 of 157 of 15
Figure 2. Recorded experimental circular dichroism (CD) spectra of isolated diarylheptanoids (molar ellipticity vs. wavelength. (nm)).
Figure 2. Recorded experimental circular dichroism (CD) spectra of isolated diarylheptanoids (molar ellipticity vs. wavelength. (nm)).
Molecular models generated for the R-enantiomer of myricanol resulted in three conformations corresponding to the 11R,Ra, 11R,Sa Molecular models generated for the R-enantiomer of myricanol resulted in three conformations (a), and 11R,Sa (b) forms (Figure 3A–C).
corresponding to the 11R,Ra, 11R,Sa (a), and 11R,Sa (b) forms (Figure 3A–C).
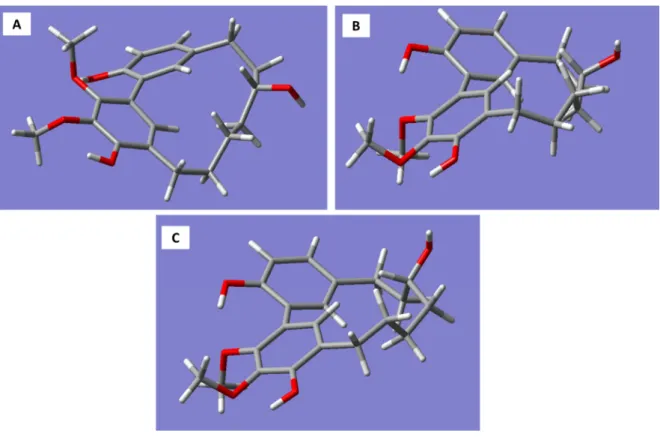
Figure 3. Three-dimensional structures of the conformations of R-myricanol. (A) 11R,Ra myricanol.
RB3LYP/6-31G(d,p) energy: –1192.01521911 a.u. Energy difference from lowest conformer: 2.01 kcal/mol; (B) 11R,Sa myricanol (a). RB3LYP/6-31G(d,p) energy: −1192.01342066 a.u. Energy difference from the lowest conformer: 3.31 kcal/mol; (C) 11R,Sa myricanol (b). Conformation corresponds to the X-ray crystal structure [19]. RB3LYP/6-31G(d,p) energy: –1192.01842217 a.u. Energy difference from the lowest conformer: 0.000 kcal/mol.
The 11R,Sa (b) conformation corresponds to the X-ray structure of myricanol determined by Begley et al. [19]. The simulated CD spectrum of the energetically most favorable 11R,Sa-myricanol (conformer C, Figure 3C) was found to be similar to the experimentally determined spectrum (Figure 4C).
The major cotton effects are of equal sign, indicating that the compound indeed has the 11R,Sa- configuration, as would also be expected based on its reported crystal structure. The spectrum would appear exactly the opposite if the 11S,Ra-enantiomer was present. The spectrum for the much less favorable 11R,Ra-atropisomer (conformer 1, Figure 3A) shows almost entirely the opposite sign (Figure 4A). Since its internal energy is predicted to be more than 2 kcal/mol higher than that of conformer C, it would only represent an insignificant fraction in the conformational equilibrium. The two different conformers of 11R,Sa myricanol (2 and 3, Figure 3B,C) show similar signs with the experimental spectrum (Figure 4B,C) which supports the presence of the 11R,Sa-configuration. The Boltzmann distribution calculated on the basis of the B3LYP/6-31D(d,p) energies of the three conformers would correspond to an even lower amount of conformer 2 (0.3%). Therefore, an averaged spectrum was generated for the theoretical equilibrium mixture corresponding to 97% R,Sa and 3%
R,Ra-myricanol and compared with the experimental CD spectrum of myricanol (Figure 4D), presenting a very good match with the experimental spectrum. A slight inconsistency observed in the 230 nm range (Figure 4B–D) can be explained by an exchange of two electronic transitions very close to each other, at 217 and 223 nm. However, this does not change the general picture of the main bands at long and short wavelength being of the same sign. According to these calculations, natural myricanol was concluded to be 11R and very predominantly Sa-configured. This corresponds to the X-ray structure and matches the CD data of myricanol reported in literature [19,30]. It should hence
Figure 3. Three-dimensional structures of the conformations of R-myricanol. (A) 11R,Ra myricanol.
RB3LYP/6-31G(d,p) energy: –1192.01521911 a.u. Energy difference from lowest conformer: 2.01 kcal/mol;
(B) 11R,Sa myricanol (a). RB3LYP/6-31G(d,p) energy: − 1192.01342066 a.u. Energy difference from the lowest conformer: 3.31 kcal/mol; (C) 11R,Sa myricanol (b). Conformation corresponds to the X-ray crystal structure [19]. RB3LYP/6-31G(d,p) energy: –1192.01842217 a.u. Energy difference from the lowest conformer: 0.000 kcal/mol.
The 11R,Sa (b) conformation corresponds to the X-ray structure of myricanol determined by Begley et al. [19]. The simulated CD spectrum of the energetically most favorable 11R,Sa-myricanol (conformer C, Figure 3C) was found to be similar to the experimentally determined spectrum (Figure 4C). The major cotton effects are of equal sign, indicating that the compound indeed has the 11R,Sa-configuration, as would also be expected based on its reported crystal structure. The spectrum would appear exactly the opposite if the 11S,Ra-enantiomer was present. The spectrum for the much less favorable 11R,Ra-atropisomer (conformer 1, Figure 3A) shows almost entirely the opposite sign (Figure 4A). Since its internal energy is predicted to be more than 2 kcal/mol higher than that of conformer C, it would only represent an insignificant fraction in the conformational equilibrium.
The two different conformers of 11R,Sa myricanol (2 and 3, Figure 3B,C) show similar signs with the experimental spectrum (Figure 4B,C) which supports the presence of the 11R,Sa-configuration.
The Boltzmann distribution calculated on the basis of the B3LYP/6-31D(d,p) energies of the three
conformers would correspond to an even lower amount of conformer 2 (0.3%). Therefore, an averaged
spectrum was generated for the theoretical equilibrium mixture corresponding to 97% R,Sa and
3% R,Ra-myricanol and compared with the experimental CD spectrum of myricanol (Figure 4D),
presenting a very good match with the experimental spectrum. A slight inconsistency observed in
the 230 nm range (Figure 4B–D) can be explained by an exchange of two electronic transitions very
close to each other, at 217 and 223 nm. However, this does not change the general picture of the main
Molecules2017,22, 2266 9 of 15
bands at long and short wavelength being of the same sign. According to these calculations, natural myricanol was concluded to be 11R and very predominantly Sa-configured. This corresponds to the X-ray structure and matches the CD data of myricanol reported in literature [19,30]. It should hence be clear that in the case of the 11S-configured compound, the Ra-atropisomer (i.e., 11S,Ra, representing the enantiomer of the depicted structure) would be the energetically most favorable form and the cotton effects in the CD spectrum would show exactly opposite sign. It is possible that a very small amount of the Ra-atropisomer is present in the conformational equilibrium. Finally, a confirmation of 11R-configuration of diarylheptanoids (1–3, 7, 8, 10, 12, 13, 15, and 16) was demonstrated by their very similar experimental CD spectra (Figure 2) showing congruency to that of myricanol. Experimental CD spectrum of myricanol in comparison to averaged CD spectrum for the S,Sa (87%) and S,Ra form (13%) can be find in the Supplementary Materials.
Molecules 2017, 22, 2266 9 of 15
be clear that in the case of the 11S-configured compound, the Ra-atropisomer (i.e., 11S,Ra, representing the enantiomer of the depicted structure) would be the energetically most favorable form and the cotton effects in the CD spectrum would show exactly opposite sign. It is possible that a very small amount of the Ra-atropisomer is present in the conformational equilibrium. Finally, a confirmation of 11R-configuration of diarylheptanoids (1–3, 7, 8, 10, 12, 13, 15, and 16) was demonstrated by their very similar experimental CD spectra (Figure 2) showing congruency to that of myricanol. Experimental CD spectrum of myricanol in comparison to averaged CD spectrum for the S,Sa (87%) and S,Ra form (13%) can be find in the Supplementary Materials.
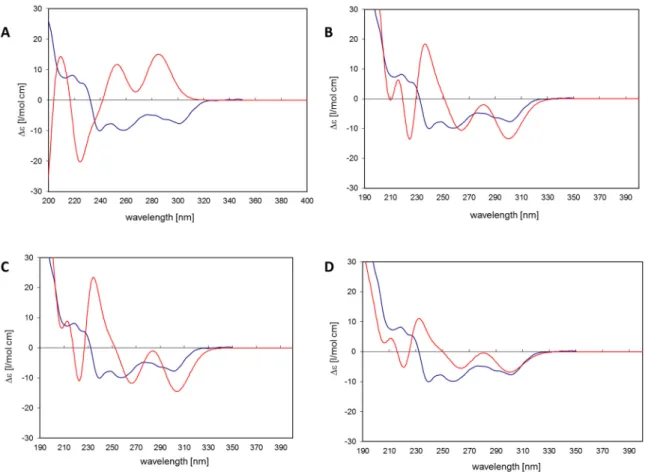
Figure 4. (A) Conformer 1: 11R,Ra myricanol. Blue: Experimental CD spectrum of myricanol. Red:
CD spectrum simulated for conformer 1 by time-dependent density functional theory (TDDFT):
RB3LYP/6-31G(d,p), nstates = 30. No shift, no scaling of calculated spectrum; (B) Conformer 2: 11R,Sa- myricanol (a). Blue: Experimental CD spectrum of myricanol. Red: CD spectrum simulated for conformer 2 by TDDFT: RB3LYP/6-31G(d,p), nstates = 30. No shift, no scaling of calculated spectrum;
(C) Conformer 3: 11R,Sa-myricanol (b), conformation corresponds to the X-ray structure. Blue:
Experimental CD spectrum of myricanol. Red: CD spectrum simulated for conformer 3 by TDDFT:
RB3LYP/6-31G(d,p), nstates = 30. No shift, no scaling of calculated spectrum. (D) Blue: Experimental CD spectrum of myricanol. Red: Averaged CD spectrum for the R,Sa (97%) and R,Ra form (3%).
TDDFT: RB3LYP/6-31G(d,p), nstates = 30. Calculated spectrum was red-shifted by −0.15 eV and scaled by factor 0.5.
3. Discussion
A systematic investigation of the diarylheptanoid pattern of Morella salicifolia revealed the presence of 16 cyclic diarylheptanoids (meta, meta-bridged biphenyls), among them six previously unknown compounds. The secondary metabolite pattern of M. salicifolia demonstrated the close taxonomic relationship of the new genera Morella and Myrica resulting from the taxonomic reorganization of the former postulated genus Myrica [1]. The taxonomic relationship was deduced from comparison of isolated known compounds (7–16) to the same compounds also reported from
Figure 4. (A) Conformer 1: 11R,Ra myricanol. Blue: Experimental CD spectrum of myricanol. Red:
CD spectrum simulated for conformer 1 by time-dependent density functional theory (TDDFT):
RB3LYP/6-31G(d,p), nstates = 30. No shift, no scaling of calculated spectrum; (B) Conformer 2:
11R,Sa-myricanol (a). Blue: Experimental CD spectrum of myricanol. Red: CD spectrum simulated for conformer 2 by TDDFT: RB3LYP/6-31G(d,p), nstates = 30. No shift, no scaling of calculated spectrum; (C) Conformer 3: 11R,Sa-myricanol (b), conformation corresponds to the X-ray structure.
Blue: Experimental CD spectrum of myricanol. Red: CD spectrum simulated for conformer 3 by TDDFT: RB3LYP/6-31G(d,p), nstates = 30. No shift, no scaling of calculated spectrum. (D) Blue:
Experimental CD spectrum of myricanol. Red: Averaged CD spectrum for the R,Sa (97%) and R,Ra
form (3%). TDDFT: RB3LYP/6-31G(d,p), nstates = 30. Calculated spectrum was red-shifted by − 0.15 eV
and scaled by factor 0.5.
3. Discussion
A systematic investigation of the diarylheptanoid pattern of Morella salicifolia revealed the presence of 16 cyclic diarylheptanoids (meta, meta-bridged biphenyls), among them six previously unknown compounds. The secondary metabolite pattern of M. salicifolia demonstrated the close taxonomic relationship of the new genera Morella and Myrica resulting from the taxonomic reorganization of the former postulated genus Myrica [1]. The taxonomic relationship was deduced from comparison of isolated known compounds (7–16) to the same compounds also reported from Myrica species [31–33].
This makes it probable that cyclic diarylheptanoids are characteristic constituents of both Morella and Myrica species.
Additionally, a comparison of experimental data with simulation of electronic circular dichroism (ECD) data revealed that there is no effect of an attached glycoside or sulfate group on the natural aglycone absolute configuration. The obtained absolute configuration of natural myricanol in this study matches very well to that achieved by X-ray in the group of Begley [19]. However, in this study the established CD calculation of myricanol was further used as a reference and a non-destructive method to determine the absolute configuration of isolated diarylheptanoids containing glycosides or sulfate groups. The method used is reliable as the obtained results are in agreement with the published crystal structure. It should also be noted that this method was used to determine the absolute configuration of the meta,meta-bridged biphenyls with chiral center at position 11. There was no sample to prove if the same method can also be applied for the cyclic diarylheptanoids of the meta,para- diphenyl ether type as well as for the ones without chiral center at position 11.
4. Materials and Methods
4.1. General Experimental Procedures
Optical rotations were measured in methanol (MeOH for spectroscopy, Merck, Darmstadt, Germany) at 25
◦C on a Unipol L 1000 polarimeter (Schmidt and Haensch, Berlin, Germany).
CD spectra were recorded on a Jasco J-710 spectrometer (Jasco, Groß-Umstadt, Germany) at a wavelength range of 195–350 nm. UV spectra (MeOH for spectroscopy, Merck, Darmstadt, Germany) were measured using a Cary 50 Scan UV spectrophotometer (Varian, Darmstadt, Germany) equipped with Cary WinUV 3.00 software (Varian, Darmstadt, Germany). The 1D-
1H, 1D-
13C, [
1H-
13C]-heteronuclear single quantum coherence (HSQC), [
1H-
13C]-HMBC, [
1H-
1H]-COSY and [
1H-
1H]-ROESY NMR experiments were recorded on a Bruker AVANCE 600 spectrometer (600.25 MHz for
1H- and 150.93 MHz for
13C-NMR (Bruker, Ettlingen, Germany), and referenced to tetramethylsilane (TMS). Samples were dissolved in methanol-d
4(99.8%, Sigma-Aldrich, Taufkirchen, Germany), acetone-d
6(99.8%), or pyridine-d
5(99.5%, both Deutero, Kastellaun, Germany). Low-resolution (LR)-ESI-MS was measured using the TSQ 7000 spectrometer (Thermo Quest, Finnigan, Egelsbach, Germany) and high-resolution (HR)-ESI-MS was measured using the Q-TOF 6540 UHD mass spectrometer (Agilent Technologies, Santa Clara, CA, USA).
MeOH and acetonitril of HPLC grade (Merck, Darmstadt, Germany) were used for chromatography. For extraction and analysis of MeOH, dichloromethane (DCM) and EtOAc of analytical grade (Acros Organics, Morris Plains, NJ, USA) were used. Open column chromatography was performed using Sephadex
®LH-20 (25–100 µm, 265 g, 90 × 4.76 cm, GE Healthcare GmbH, München, Germany) and fraction control was done by analytical thin layer chromatography (TLC, silica gel 60 F
254aluminium sheets, 20 × 20 cm). The standard mobile phase used for all TLC analyses was ethylacetate/water/acetic acid/formic acid (100 + 26 + 11 + 11). Detection was done at visible light (VIS), and UV 254 and 366 nm before and after spraying a plate with anisaldehyde-sulfuric acid and heating a TLC sheet at 105
◦C for 3–10 min.
Centrifugal partition chromatography (CPC) was performed using SPOT centrifugal partition
chromatography (Armen Instrument, Saint-Avé, France) with EtOAc (for analysis, Acros Organics)
and water as solvent system. Two modes were used; ascending mode, whereby EtOAc was a
Molecules2017,22, 2266 11 of 15