Wölfl, Jencks, Johnston, Varner, and Devey present the selection algorithm used to define a target area for a pilot mapping project based on carefully chosen and publicly available parameters of the marine environment that are of interest to various stakeholders.
Hitting the target
Who should read this paper?
This paper is of particular interest for ocean mappers, bathymetrists, scientists focusing on the ocean floor, entities working on ocean issues (IHO, IOC), GIS specialists, etc.
Why is it important?
This work presents a reproducible process for identifying potential target areas for future mapping campaigns in the North Atlantic. The GIS approach combines several parameters that are of interest for ocean stakeholders
including available multibeam data coverage in order to designate suitable areas for bathymetric surveys.
The results can play a significant role in developing a seabed mapping strategy for the North Atlantic Ocean and beyond. Further, by delineating current bathymetric data coverage of data available through public repositories and archives, we are reminded of the fact that many data sets are still not publicly available, thereby highlighting the importance of open access data and data sharing. The analysis can also be extended to other regions and variables can be neglected and added, depending on specific interests.
About the authors
Dr. Anne-Cathrin Wölfl is a postdoctoral research associate at the GEOMAR Helmholtz Centre for Ocean Research Kiel in Germany and GIS specialist with a focus on marine science. She investigates the deep ocean floor by
hydroacoustic means including the collection, processing, visualization and interpretation of high-resolution bathymetry data. Jennifer Jencks works at the National Oceanic and Atmospheric Administration’s National Centers for Environmental Information (NCEI) in Boulder, Colorado. She is the director of the IHO Data Center for Digital Bathymetry, leads the NCEI Ocean and Coastal Mapping Team, manages global marine geophysical data archives, and is actively involved with many national and international seafloor mapping projects. Gordon Johnston has over 25 years of experience in the surveying industry; in particular, the offshore and hydrographic survey industry. He is a director of Venture Geomatics Limited, providing technical and management support to industry. He is a Chartered Surveyor of the Royal Institution of Chartered Surveyors (RICS) and chair of the RICS Global Geomatics Professional Board. Jesse Varner is a GIS specialist with the University of Colorado Cooperative Institute for Research in Environmental Sciences, working at NOAA’s National Centers for Environmental Information in Boulder, Colorado. He has a degree in computer science from the University of Colorado, and is interested in geospatial web services, interactive web maps, and
cartography. Dr. Colin Devey is Professor of Oceanic Volcanism at GEOMAR in Kiel, Germany. His research centres on the fluxes of heat and materials from the Earth’s interior to the seafloor, trying to understand how the oceanic crust Anne-Cathrin Wölfl
Jennifer Jencks
Gordon Johnston
Jesse Varner
Colin Devey
IDENTIFYING DEEP-SEA TARGET AREAS FOR A PILOT ATLANTIC SEABED MAPPING PROJECT USING GIS TECHNIQUES
Anne-Cathrin Wölfl1, Jennifer Jencks2, Gordon Johnston3, Jesse Varner2,4, Colin Devey1
1GEOMAR Helmholtz Centre for Ocean Research Kiel, Kiel, Germany
2NOAA National Centers for Environmental Information, Boulder, CO, United States
3Venture Geomatics Limited, Banstead, United Kingdom
4Cooperative Institute for Research in Environmental Sciences, Boulder, CO, United States
ABSTRACT
The shape of the seafloor, which primarily reflects the geological processes which have occurred there, influences both ocean circulation and seafloor habitats. A prerequisite for sustainable ocean governance, including the designation of marine protected areas to conserve threatened ecosystems or habitats, is, therefore, the availability of good bathymetric maps. Despite decades of ocean mapping, we still lack this detailed bathymetric information over large parts of the Atlantic seafloor. In an effort to change this situation, the US, Canadian and EU governments, under the “Galway Statement on Atlantic Ocean Cooperation,” established an Atlantic Seabed Mapping International Working Group (ASMIWG) to develop plans to map the entire Atlantic. A first step in this effort is to define 400 x 400 km target areas for a pilot mapping project. Here we present the selection algorithm used to define these pilot areas based on carefully chosen and publicly available parameters of the marine environment that are of interest to various stakeholders. The methodology involved a GIS-based overlay technique that included the parameters of the marine environment as individual layers and combined them in order to obtain information about the suitability of a location as a target area. The results reveal the suitability of areas throughout the North Atlantic and highlight three potential pilot mapping sites.
KEYWORDS
Seafloor; Bathymetry; Multibeam; Geographic information systems; Open access
INTRODUCTION
Human activities are rapidly expanding
throughout the world’s oceans, yet only a small part of the ocean floor has been mapped at high resolution. Auster et al. [2011] recently showed that decision making regarding special area designations in the deep sea becomes an issue when comprehensive data sets are absent. Less than 15% of ocean depths have been measured directly, and only 50% of the world’s coastal waters (less than 200 m deep) have ever been surveyed. This is in stark contrast to the Moon and Mars which have both been mapped completely [Hare et al., 2015; Tanaka et al., 2014]. Most of our information about the structure of the ocean floor comes from estimated seafloor depths derived from gravity measurements using satellite altimetry [Smith and Sandwell, 1997; Sandwell et al., 2014]. Yet this information is low-resolution (pixel size >
1 km) and is inherently under-determined, resulting in large errors (in places > 1,000 m) between the estimated and true depths.
Replacing satellite data with high resolution depth soundings will require a significant international mapping effort. To ensure this effort is directed towards the areas most in need of mapping, we need to know (1) which areas have already been mapped and (2) which areas we should prioritize for mapping first.
In 2016, a study on where to focus mapping activities in the Atlantic was initiated as part of the efforts of the Atlantic Seabed Mapping International Working Group (ASMIWG).
The ASMIWG is one of three working groups focused on implementing the Galway Statement on Atlantic Ocean Cooperation, signed by the European Union, Canada, and
the United States in May 2013. The intent of the Galway Statement is to foster cooperation and increase knowledge of the Atlantic Ocean through improved coordination and collaboration in ocean observation efforts.
The ASMIWG, through partnership, social inclusion, and resourcing infrastructure access, aims to develop and implement a cohesive seabed mapping strategy,
underpinning the Galway 2013 vision and the security of Atlantic Ocean resources. The ASMIWG has a number of work objectives including:
a) Establish the status, priorities and
mechanisms that will contribute to seabed mapping and facilitate better ocean observation and forecasting to support sustainable resource and improved risk management in the shared Atlantic area;
b) Identify the key priorities (e.g.,
bathymetry, seabed habitat classifications, data collection/storage/use/sharing) that need to be addressed in order to develop a unified seabed map of the shared Atlantic;
c) andFocus on the need for an Atlantic seabed map, the availability of data and the need for improved communication and sharing of best practice.
The aim of the present study was to develop a reproducible process for identifying potential target areas within the North Atlantic that are suitable for future bathymetric surveys. The basis for the identification of target areas were specific user group-based parameters of the marine environment as well as
information regarding current multibeam bathymetry data coverage.
GENERAL CRITERIA AND INPUT PARAMETERS
The ASMIWG decided to geographically limit the North Atlantic to the region south of the Arctic Circle (66°N) and north of the Tropic of Cancer (23°N). Furthermore, to avoid conflicts with national jurisdiction, the area was
restricted to international waters, i.e., outside a coastal State’s Exclusive Economic Zone (EEZ), as well as potential Extended Continental Shelf (ECS) claims.
The first step in the analysis was to determine where bathymetric data were already
available. Perhaps surprisingly, even this was not trivial. Only a small percentage of existing multibeam data and associated geographic information is accessible through online repositories, such as the International Hydrographic Organization (IHO) Data Centre for Digital Bathymetry (hosted by NOAA’s National Centers for Environmental Information, NCEI) and the World Data Center PANGAEA. Some portals, such as the General Bathymetric Chart of the Oceans (GEBCO), the Global Multi-Resolution Topography Synthesis (GMRT) and EMODnet Bathymetry, create and provide high-resolution Digital Terrain Models (DTM) of the ocean floor based on these data holdings and contributions from other
institutions, but large volumes of data are either not provided to the repositories or, if present, do not have the required associated metadata to make them discoverable.
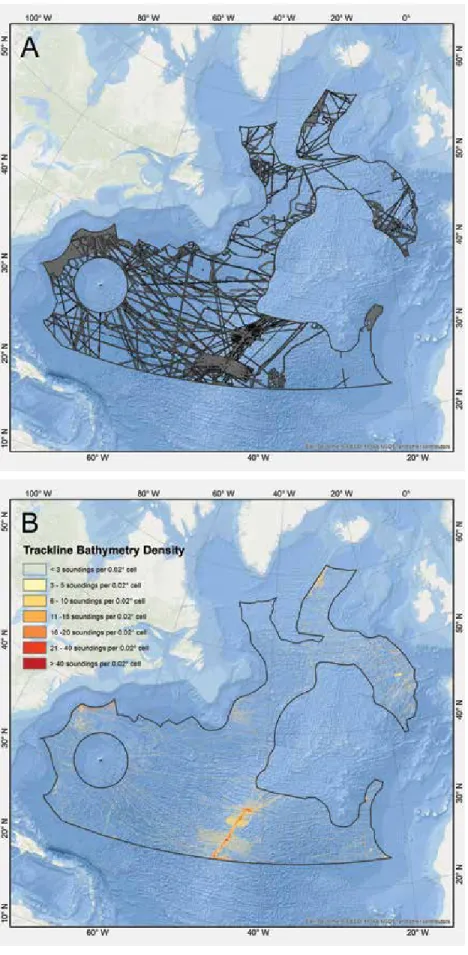
To determine the current data coverage in the North Atlantic, multibeam swaths from open access online databases, including the GMRT
Data Synthesis using GeoMapApp from Columbia University’s Lamont-Doherty Earth Observatory [Ryan et al., 2009] (www.
geomapapp.org), NOAA’s NCEI (NCEI, doi:10.7289/V56T0JNC) and EMODnet Bathymetry (www.emodnet-bathymetry.eu), were combined and displayed. Where only survey tracks were available and the swath coverage was unknown, a buffer of 2.5 km around the track was used (Figure 1A). Further multibeam data swath coverages were
provided from the Spanish and Portuguese national archives. A single beam density grid from NCEI showing the number of soundings per 0.02° cell was also displayed but not included in the data coverage calculations, due to the lack of significant spatial coverage of single beam data in areas where multibeam coverage did not already exist (Figure 1B).
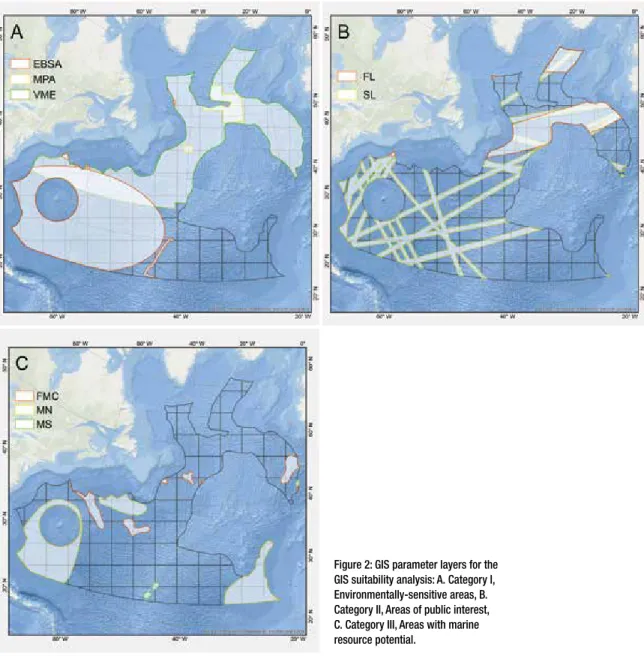
Additional parameters for the target area choice were based on the interests of specific user groups, such as the general public, science and industry. Eight publicly available parameters of the marine
environment were chosen based on
discussions with ASMIWG members (Table 1, Figure 2A-C). These parameters reflect the attributes a potential target area could possess in order to increase its suitability for future planned bathymetric surveys.
The Ecologically or Biologically Significant Marine Areas (EBSAs) are identified by States and intergovernmental organizations based on different criteria, such as uniqueness or rarity and are described as being in need of protection. These criteria were adopted at the 9th meeting of the Conference of the Parties to the Convention on Biological Diversity
Figure 1: Overview map of the study area showing available multibeam data coverage from the Global Multi-Resolution Topography Synthesis (GMRT), National Centers for Environmental Information (NCEI), EMODnet and from Spanish and Portuguese national archives (A) and bathymetric sounding density from single- beam data from NCEI (B).
Figure 2: GIS parameter layers for the GIS suitability analysis: A. Category I, Environmentally-sensitive areas, B.
Category II, Areas of public interest, C. Category III, Areas with marine resource potential.
(COP 9) [CBD Secretariat, 2009]. The EBSA regions included are located in the North- West Atlantic, Wider Caribbean and Western Mid-Atlantic. At present, these areas do not have protective status.
The OSPAR Network of Marine Protected Areas (MPAs) strives to achieve the
sustainable use, protection and conservation of marine biological diversity and ecosystems by introducing certain restrictions in selected
areas [OSPAR, 2003]. MPAs can be nominated within the jurisdiction of a contracting party, but also in areas beyond national jurisdiction and are established by the OSPAR
Commission. Located within the study area are the Charlie-Gibbs North High Seas MPA, Charlie-Gibbs South MPA and Milne Seamount Complex MPA.
The Vulnerable Marine Ecosystems (VMEs) represent ecosystems that might be significantly
affected by fishing activities. According to the Food and Agriculture Organization of the United Nations [FAO, 2009],
“Vulnerability is related to the likelihood that a population, community, or habitat will experience substantial alteration from short- term or chronic disturbance, and the
likelihood that it would recover and in what time frame.” Identification criteria can be found in the International Guidelines for the Management of Deep-sea Fisheries in the High Seas [FAO, 2009]. Similar to the EBSA concept, the VME regions are also not protected. VME closed areas, VME bottom fishing areas as well as VME other access regulated areas have been included within this study.
The Flight Lines (FL) parameter shows the major flight route zones between the European and North American continents [Brunton, 2014]. Of the total over-ocean distance covered by overseas flight routes, 60% is above unmapped areas [Smith et al., 2017]
and, as recent events have shown, the absence of good maps can greatly hinder the searches for aircraft wreckage. Having a detailed map of the seafloor available below this zone could significantly improve flight crash
investigations, as the near-bottom search for wreckage requires good base-maps. In order to perform spatial analysis as well as to enhance the impact of this parameter in the target area assessment, a 100 km buffer zone was created around the flight routes.
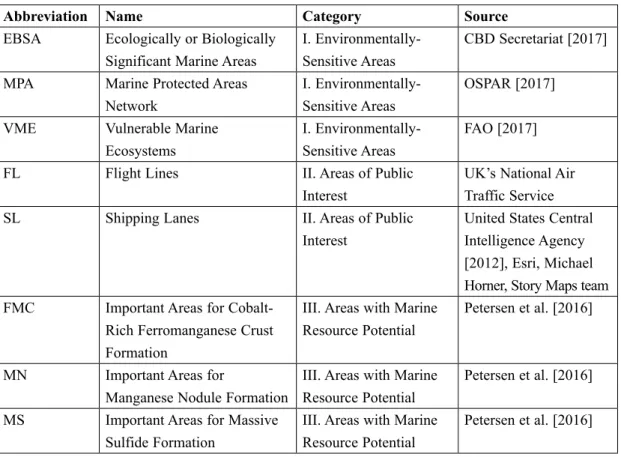
Abbreviation Name Category Source
EBSA Ecologically or Biologically Significant Marine Areas
I. Environmentally- Sensitive Areas
CBD Secretariat [2017]
MPA Marine Protected Areas Network
I. Environmentally- Sensitive Areas
OSPAR [2017]
VME Vulnerable Marine
Ecosystems
I. Environmentally- Sensitive Areas
FAO [2017]
FL Flight Lines II. Areas of Public
Interest
UK’s National Air Traffic Service
SL Shipping Lanes II. Areas of Public
Interest
United States Central Intelligence Agency [2012], Esri, Michael Horner, Story Maps team FMC Important Areas for Cobalt-
Rich Ferromanganese Crust Formation
III. Areas with Marine Resource Potential
Petersen et al. [2016]
MN Important Areas for
Manganese Nodule Formation
III. Areas with Marine Resource Potential
Petersen et al. [2016]
MS Important Areas for Massive Sulfide Formation
III. Areas with Marine Resource Potential
Petersen et al. [2016]
Table 1: Input parameters used in the suitability analysis, their categorization and their source.
Shipping Lanes (SL) are routes used by commercial shipping vessels on a regular basis [United States Central Intelligence Agency, 2012]. Detailed maps of the seafloor would be advantageous in the case of maritime
accidents, not only supporting the search for missing vessels but also regarding the environmental impact. To enhance the influence of this parameter, a 30 km buffer zone was created around lanes of minor significance, a 40 km buffer zone around lanes of medium significance and a 50 km buffer zone around lanes of major significance.
The Important Areas for Manganese Nodule Formation are of potential interest regarding global raw materials supply, with cobalt, copper, manganese, nickel and titanium the main metals of economic interest. The nodules generally form on the deep seafloor at water depths between 3,000 and 6,000 m, except in areas characterized by young oceanic crust, high relief and high sedimentation rates [Petersen et al., 2016].
The Important Areas for Ferromanganese Crust Formation are usually found on the flanks of seamounts in water depths between 800 and 2,500 m. The crustal deposits mainly form on rock outcrops in high-relief seafloor areas.
These crusts are also of potential interest as sources of metals, with cobalt, copper, nickel and titanium being the main economic elements present [Petersen et al., 2016].
The Important Areas for Massive Sulfide Formation are related to oceanic spreading centres and young island arc volcanoes.
Massive sulfides usually form at high-
temperature hydrothermal sites, where seawater
is heated by volcanism. Metal deposits of economic interest, such as copper, zinc, gold and silver occur in water depths between 1,000 and 5,000 m [Petersen at al., 2016].
GIS-BASED SUITABILITY ANALYSIS The aim of this analysis was to create a map that shows the suitability of every 400 x 400 km cell as a potential target site within the North Atlantic study area. The basic
assumption is that the greater the number of parameters present at a certain site, the higher its suitability. As a starting point, a grid of 400 x 400 km cells, referred to as polygons, was generated and overlaid on the study area. The grid was created in a Lambert azimuthal equal- area projection centred over the North Atlantic (central meridian 35°W, latitude of origin 45°N), to ensure that each polygon represents the same area. The choice of polygon size was based on the calculation that, with an
appropriately equipped vessel, one polygon could be surveyed within approximately 100 days. The exclusion of the EEZ and potential ECS claims resulted in the cropping and reduction of the polygon sizes.
GIS-based suitability techniques are increasingly used for various environmental planning applications [Brail and Klosterman, 2001], such as for land use planning
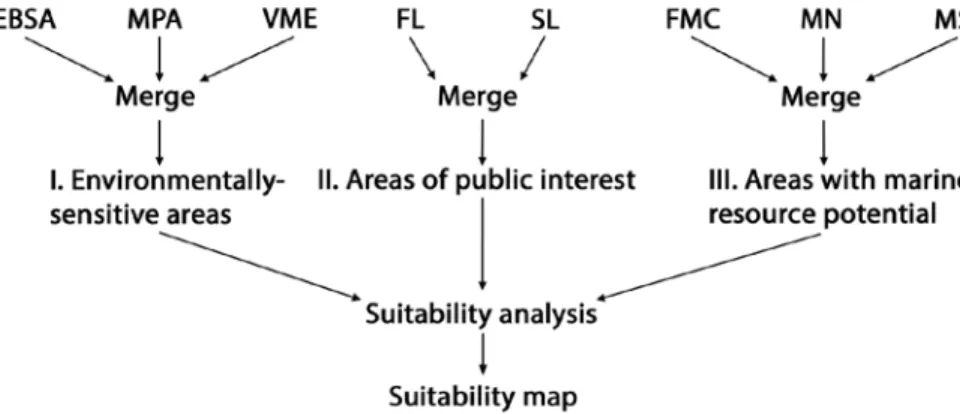
[Pramanik, 2016]. In our study a GIS-based overlay technique was applied using ArcGIS 10.4 (Figure 3). To ensure a balance between the different user-group interests, the selected parameters were classified into three
categories: EBSA, MPA and VME were combined into the category “Environmentally- Sensitive Areas” (Figure 2A); FL and SL into
the category “Areas of Public Interest” (Figure 2B); and FMC, MN and MS into the category
“Areas with Marine Resource Potential”
(Figure 2C).
Prior to the analysis, information on the selected parameters was converted into geospatial vector layers (shapefiles) and merged according to their categorization. The three category layers were converted to raster data sets with a cell size of 1 x 1 km to obtain high resolution information. Cells with no data were assigned a value of 0 reflecting the absence of parameters. A value of 1 was assigned to cells containing data, indicating the occurrence of at least one parameter within this cell. Finally, an expression was executed adding all values of the three category raster data sets in each cell using the Raster Calculator geoprocessing tool in the Spatial Analyst toolbox. The output is a newly created raster data set that shows the spatial overlap of the categories. A very low suitability stands for the absence of all categories, a low suitability for the occurrence of one category, a medium suitability for the occurrence of two categories and a high suitability for the occurrence of all three categories.
RESULTS AND DISCUSSION
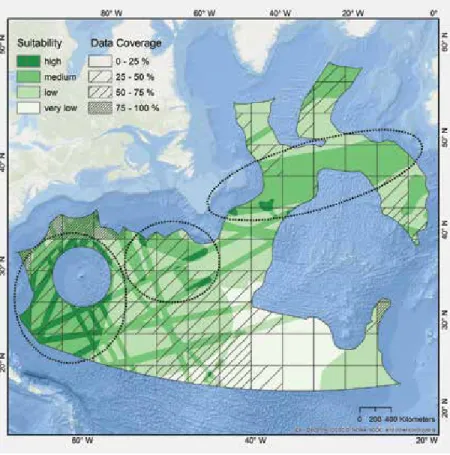
Figure 4 shows the results of the suitability analysis. A high occurrence of desired
attributes at a specific location results in a high suitability as a potential target site. For
visualization purposes, the multibeam data coverage was classified into four bands (0-25%, 25-50%, 50-75% and 75-100%) for every target area.
The first region of interest is a belt of medium suitability around 50°N that stretches from east to west with two high suitability patches in the southwest. The parameters occurring in this area include MPA and VME, belonging to Category I - Environmentally-sensitive areas;
FL and SL, making up Category II - Areas of public interest; as well as FMC, categorized into the Category III - Areas with marine resource potential. Most parts of the belt have less than 25% multibeam data coverage. Single beam data is quite sparse, especially in the western area of the belt.
Another area with highly suitable locations occurs around 35°N and 50°W. This is partly due to the occurrence of EBSA and VME
Figure 3: Workflow of data preparation and GIS suitability analysis.
(Category I) and SL (Category II), but also to the occurrence of FMC and MN (Category III). The surrounding area can be considered low
suitability. In this zone, less than 50% of the area has been mapped by multibeam echo sounders. Similar to the first region, single beam data coverage is sparse.
A high suitability zone is also found in the southwestern part of the study area (25°N, 65°W). This zone is rather scattered with the surrounding areas revealing a medium suitability. The high suitability results from the concurrence of EBSA (Category I), SL (Category II) and MN (Category III) as well as, to a lesser extent, VME (Category I). The multibeam data
coverage in this area ranges between 0 and 50%. Single beam is more widespread compared to the other regions with partly high amounts of soundings per 0.02° cell.
Figure 4: Result map showing the suitability of potential target sites and the percentage of multibeam data coverage divided into four classes. High suitability regions are highlighted (dotted line).
Based on this analysis, three priority target polygons were defined (Figure 5). Their selection should be seen as a flexible suggestion for future mapping initiatives rather than a rigid, defined set of polygons.
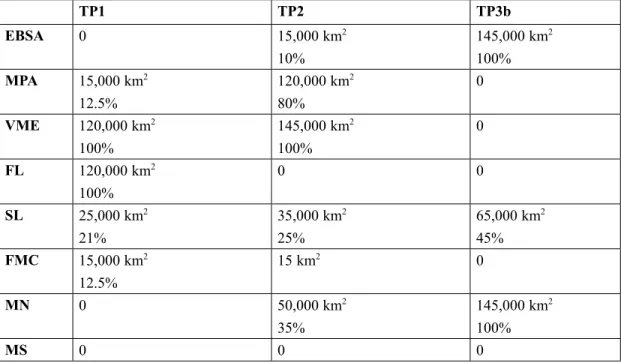
Statistics on the occurrence of the selected parameters within the target polygons can be found in Table 2.
Target Polygon 1 (TP 1 – Milne Seamount Polygon) is the northernmost selected polygon in the study area, located mid-way between Europe and the North American continents (Figure 5). According to Harris et al. [2009], this polygon is located in the abyss, the zone between the continental slope and the hadal zone (below 6,000 m) and is characterized by plains (<300 m relief) and hills (300-1,000 m relief). Furthermore, seamounts (defined as large isolated elevation(s) beneath the ocean surface, usually of conical form and greater than 1,000 m in relief above the seafloor [Cochrane, 2002; IHO, 2008]) occur in the southern part, including Milne Seamount [IHO-IOC GEBCO, 2017]. The target polygon is approximately 120,000 km2 in size with 13% being classified as highly suitable. All three categories with the following five parameters can be found within this polygon: MPA (Milne Seamount Complex), VME (VME other access regulated areas), FL, SL and FMC.
Multibeam data coverage amounts to 13%.
Target Polygon 2 (TP 2 – Sohm Plain Polygon) lies within the Sohm Plain [Hartwell et al., 2014] (Figure 5) and is characterized by abyssal plains and abyssal hills [Harris et al., 2009]. The area is slightly larger than TP 1
(145,000 km2) and 14% of the polygon is classified as highly suitable. All categories with four parameters occur: EBSA (Wider Caribbean and Western Mid-Atlantic), VME (VME other access regulated areas), SL, and MN. Twenty-four percent of the polygon area is covered by multibeam bathymetry.
In the third zone, two polygons (Target
Polygon 3a and 3b) with similar characteristics can be found (Figure 5). The polygons lie in the Sargasso Sea, east of the US coastline and north of the Caribbean. The sizes of the polygons are 120,000 km2 and 145,000 km2, respectively. Almost half of each polygon is considered highly suitable (48% and 45%). In both cases, all categories with three parameters are found: EBSA (Wider Caribbean and Western Mid-Atlantic), SL and MN.
Multibeam data covers 29% and 26% of the polygons. The decisive aspect when selecting the target polygon in the third zone was the larger size of the polygon and the lower percentage of multibeam data coverage. The seafloor of Target Polygon 3b (TP3 – Sargasso Sea Polygon) is characterized by abyssal hills, few abyssal plains and also the hadal zone [Harris et al., 2009].
These polygons represent only the top three areas for initial mapping, and many other relevant areas are highlighted as a result of our analysis. Interdependencies between some of the selection criteria (especially the multibeam coverage density and the designation of environmentally sensitive areas) can lead to the suitability of some areas being
underestimated. For example, only detailed knowledge about the seafloor can be used as the basis for inclusion into protection concepts
such as the OSPAR Network of Marine Protected Areas (MPAs). Similar arguments are applicable to assessments of some types of marine resource potential, such as
ferromanganese crusts (only found on seamounts). This can be illustrated using the example of a location off the west coast of Africa (25°N, 35°W; Figure 4) where, although none of the three categories show high suitability, multibeam data coverage is quite sparse (~ >25 %), indicating that a mapping effort would still be needed. It appears quite possible that, in terms of
Category 1 (Environmentally Sensitive Areas), no protection or management concept has been assigned in this region due to the lack of information about the seafloor and its characteristics. A first step to draw the necessary attention to this area could be to map it at a high resolution. So, while the primary aim of this paper is to highlight target areas suitable for future mapping initiatives,
we not only acknowledge, but stress, that all relatively unmapped regions (e.g., the southeastern part of the study area) warrant further study as at present so little information is available that we cannot accurately assess their environmental or resource relevance.
CONCLUSIONS
A GIS-based suitability analysis was selected to identify suitable target sites for initial future mapping initiatives in the North Atlantic Ocean. Sites were chosen based on user group-based parameters of the marine environment as well as on multibeam data coverage. Our answer to the question “where to map next?” is the presentation of three target polygons that are appropriate priority targets for mapping in the future. Each showed a high occurrence of desired
attributes, reflected in a high suitability class and relatively low multibeam data coverage.
TP1 TP2 TP3b
EBSA 0 15,000 km2
10%
145,000 km2 100%
MPA 15,000 km2 12.5%
120,000 km2 80%
0 VME 120,000 km2
100%
145,000 km2 100%
0
FL 120,000 km2
100%
0 0
SL 25,000 km2
21%
35,000 km2 25%
65,000 km2 45%
FMC 15,000 km2 12.5%
15 km2 0
MN 0 50,000 km2
35%
145,000 km2 100%
MS 0 0 0
Table 2: Surface area of parameters in km2 and percentage in Target Polygon 1 (120,000 km2), Target Polygon 2 (145,000 km2) and Target Polygon 3b (145,000 km2).
Our analysis also highlighted the fact that a lack of regional bathymetric data can lead to spurious low-suitability classifications, as is probably the case in the southeastern part of the study area. This illustrates that our suitability analysis is only a positive analysis and can only highlight areas which are highly suitable for further mapping but cannot be used to exclude areas from mapping.
The value of our analytical algorithm is that it can be easily adjusted to include new criteria or new data as they become available. It provides an objective way to use the selected criteria to prioritize mapping areas. The methodology can be adapted to other regions and can include a variety of parameters based on stakeholder interest. The approach has the potential to take the mapping and ocean science community a step further towards filling large knowledge gaps in the North Atlantic and will help avoid duplication of effort. The analysis could be significantly improved if all global multibeam data were universally discoverable and accessible.
ACKNOWLEDGMENTS
Special thanks are due to the Atlantic Seabed Mapping International Working Group (ASMIWG) for contributions and support.
Multibeam coverage shapefiles have been derived from the EMODnet Bathymetry portal (www.emodnet-bathymetry.eu). This is a European initiative, started in 2009, to compile and maintain a catalogue of available
bathymetric data sets and to produce and publish the EMODnet Digital Terrain Model (DTM) for the European sea regions. The latest DTM has a grid resolution of 1/8 * 1/8
arc minutes, was released in October 2016 and has the following reference: http://doi.
org/10.12770/c7b53704-999d-4721-b1a3- 04ec60c87238. Furthermore, we gratefully acknowledge the provision of multibeam coverage shapefiles from Luis Somoza Losada and the Working Group for the Extension of the Continental Shelf of Spain and Nuno Lourenco and the Portuguese Task Group for the Extension of the Continental Shelf. Many thanks also go to Sven Petersen for providing shapefiles detailing the marine resource potential. We also thank three anonymous reviewers for helpful reviews of this
manuscript. This work has been developed in cooperation with the European Union’s Horizon 2020 research and innovation project AtlantOS (633211) (A-CW and CD) and with NOAA (JJ and JV).
REFERENCES
Auster, P.J.; Gjerde, K.; Heupel, E.; Watling, L.; Grehan, A.; and Rogers, A.D.
[2011]. Definition and detection of vulnerable marine ecosystems on the high seas: problems with the “move- on” rule. ICES Journal of Marine Science, Vol. 68, pp. 254-64.
Brail, R.K. and Klosterman, R.E. (eds.).
[2001]. Planning support systems – integrating geographic information systems, models and visualisation tools.
ESRI Press, Redlands, CA.
Brunton, J. [2014]. North Atlantic skies – the gateway to Europe. NATS Blog. Retrieved from: www. http://nats.aero/blog/2014/06/
north-atlantic-skies-gateway-europe.
CBD Secretariat [2009]. Azores scientific criteria and guidance – for identifying
ecologically or biologically significant marine areas and designing representative networks of marine protected areas in open ocean waters and deep sea habitats.
Montreal, Canada: Convention on Biological Diversity Secretariat.
CBD Secretariat [2017]. Database outlining EBSA’s regions: North-West Atlantic, Wider Caribbean and Western Mid-
Atlantic. Montreal, Canada: Convention on Biological Diversity Secretariat. Retrieved from: www.cbd.int.
Cochrane, K.L. (ed.) [2002]. A fishery manager’s guidebook. Management measures and their application. FAO Fisheries Technical Paper No. 424. Rome, Italy. 231 pp.
FAO [2009]. International guidelines for the management of deep-sea fisheries in the high seas. Rome, Italy: FAO.
FAO [2017]. Database outlining VME closed areas, bottom fishing areas, other access regulated areas. Rome, Italy: FAO.
Available at: www.fao.org.
Hare, T.M.; Hayward, R.K.; Blue, J.S.;
Archinal, B.A.; Robinson, M.S.; Speyerer, E.J.; Wagner, R.V.; Smith, D.E.; Zuber, M.T.; Neumann, G.A.; and Mazarico, E.
[2015]. Image mosaic and topographic map of the moon. U.S. Geological Survey Scientific Investigations Map 3316, 2 sheets. doi 10.3133/sim3316.
Hartwell, S.R.; Wingfield, D.K.; Allwardt, A.O.; Lightsom, F.L.; and Wong, F.L.
[2014]. Polygons of global undersea features for geographic searches
(undersea_features.shp). U.S. Geological Survey Open-File Report 2014-1040, 8 p.
doi 10.3133/ofr20141040.
Harris, P.; Macmillan-Lawler, M.; Rupp, J.; and
Baker, E.K. [2009]. Geomorphology of the oceans. Marine Geology, Vol. 352, pp. 4-24.
IHO [2008]. Standardization of undersea feature names: guidelines proposal form terminology. 4th Edition. Monaco:
International Hydrographic Bureau.
IHO-IOC GEBCO [2017]. Gazetteer of undersea feature names. Retrieved from:
www.gebco.net.
OSPAR [2003]. Guidelines for the identification and selection of marine protected areas in the OSPAR maritime area. OSPAR Convention for the Protection of the Marine Environment of the Northeast Atlantic, Meeting of the OSPAR Commission, Bremen: June.
Reference Number: 2003-17.
OSPAR [2017]. Database outlining marine protected areas in the OSPAR maritime area. London, UK: OSPAR. Retrieved from: www.ospar.org.
Petersen, S.; Krätschell, A.; Augustin, N.;
Jamieson, J.; Hein, J.R.; and Hannington, M.D. [2016]. News from the seabed – geological characteristics and resource potential of deep-sea mineral resources.
Marine Policy, Vol. 70, pp. 175-187. doi 10.1016/j.marpol.2016.03.012i.
Pramanik, M.K. [2016]. Site suitability analysis for agricultural land use of Darjeeling district using AHP and GIS techniques model. Earth Systems and Environment, Vol. 2. doi 10.1007/s40808- 016-0116-8.
Ryan, W.B.F.; Carbotte, S.M.; Coplan, J.O.;
O’Hara, S.; Melkonian, A.; Arko, R.;
Weissel, R.A.; Ferrini, V.; Goodwillie, A.;
Nitsche, F.; Bonczkowski, J.; and Zemsky R. [2009]. Global multi-resolution topography synthesis. Geochemistry
Geophysics Geosystems, Vol. 10, pp. 1525- 2027, Q03014. doi 10.1029/2008GC002332.
Sandwell, D.T.; Müller, D.R.; Smith, W.H.F.;
Garcia, E.; and Francis, R. [2014]. New global marine gravity model from CryoSat-2 and Jason-1 reveals buried tectonic structure. Science, Vol. 346, pp.
65-67. doi 10.1126/science.1258213.
Smith, W.H.F.; Marks, K.M.; and Schmitt, T.
[2017]. Airline flight paths over the unmapped ocean. Earth and Space Science New Eos, Vol. 98. doi 10.1029/2017EO069127.
Smith, W.H.F. and Sandwell, D.T. [1997].
Global sea floor topography from satellite altimetry and ship depth soundings.
Science, Vol. 277, pp. 1956-1962. doi 10.1126/science.277.5334.1956.
Tanaka, K.L.; Skinner, J.A., Jr.; Dohm, J.M.;
Irwin, R.P., III; Kolb, E.J.; Fortezzo, C.M.;
Platz, T.; Michael, G.G.; and Hare, T.M.
[2014]. Geologic map of Mars. U.S.
Geological Survey Scientific Investigations Map 3292, scale 1:20,000,000, pamphlet 43 p. doi 10.3133/sim3292.
United States Central Intelligence Agency [2012]. Map of the world oceans.
Washington, D.C.: Central Intelligence Agency.