The transcript elongation factor SPT4/SPT5 is involved in auxin-related gene expression
in Arabidopsis
Julius Du¨rr
1, Ihab B. Lolas
2, Brian B. Sørensen
1, Veit Schubert
3, Andreas Houben
3, Michael Melzer
3, Rainer Deutzmann
4, Marion Grasser
1,2and Klaus D. Grasser
1,2,*
1Department of Cell Biology & Plant Biochemistry, Biochemie-Zentrum Regensburg (BZR), University of
Regensburg, Universita¨tsstrasse 31, D-93053 Regensburg, Germany, 2Department of Biotechnology, Chemistry and Environmental Engineering, Aalborg University, Sohngaardsholmsvej 49, DK-9000 Aalborg, Denmark,
3Leibniz Institute of Plant Genetics and Crop Plant Research (IPK), Corrensstrasse 3, 06466 Gatersleben, Germany and 4Institute for Biochemistry I, Biochemie-Zentrum Regensburg (BZR), University of Regensburg, Universita¨tsstrasse 31, D-93053 Regensburg, Germany
Received September 25, 2013; Revised December 21, 2013; Accepted January 9, 2014
ABSTRACT
The heterodimeric complex SPT4/SPT5 is a tran- script elongation factor (TEF) that directly interacts with RNA polymerase II (RNAPII) to regulate mes- senger RNA synthesis in the chromatin context.
We provide biochemical evidence that in Arabidopsis, SPT4 occurs in a complex with SPT5, demonstrating that the SPT4/SPT5 complex is conserved in plants. Each subunit is encoded by two genes SPT4-1/2 and SPT5-1/2. A mutant affected in the tissue-specifically expressed SPT5- 1 is viable, whereas inactivation of the generally expressed SPT5-2 is homozygous lethal. RNAi- mediated downregulation of SPT4 decreases cell proliferation and causes growth reduction and developmental defects. These plants display espe- cially auxin signalling phenotypes. Consistently, auxin-related genes, most strikingly AUX/IAA genes, are downregulated in SPT4–RNAi plants that exhibit an enhanced auxin response. In Arabidopsis nuclei, SPT5 clearly localizes to the transcriptionally active euchromatin, and essentially co-localizes with transcribing RNAPII. Typical for TEFs, SPT5 is found over the entire transcription unit of RNAPII-transcribed genes. In SPT4–RNAi plants, elevated levels of RNAPII and SPT5 are detected within transcribed regions (including those of downregulated genes), indicating transcript elongation defects in these plants. Therefore, SPT4/
SPT5 acts as a TEF inArabidopsis, regulating tran- scription during the elongation stage with particular
impact on the expression of certain auxin-related genes.
INTRODUCTION
Transcription by RNA polymerase II (RNAPII) proceeds through distinct steps including promoter recruitment, ini- tiation, elongation and termination. It is well established that the early stages of the transcription cycle, resulting in the initiation of messenger RNA (mRNA) synthesis, are a main target to control gene expression. Over the past 15 years, it became apparent that transcript elongation is also dynamic and highly regulated. Accordingly, a variety of transcript elongation factors (TEFs) were identified that act in a concerted manner, facilitating efficient mRNA syn- thesis (1–3). They serve diverse functions during transcrip- tion such as modulating the catalytic properties and processivity of RNAPII and assisting the progression of the enzyme through repressive chromatin (1,3). In different eukaryotic model systems, studies of mutants defective in various TEFs have revealed that these factors play critical roles in development, illustrating their importance in main- taining proper gene expression programs (3–5). In addition to their function in gene transcription, elongating RNAPII and TEFs are involved in the coordination of pre-mRNA synthesis and processing (6).
One of the TEFs that was characterized in yeast and metazoa as regulator of RNAPII-catalyzed transcript elongation, is a heterodimeric complex consisting of SPT4 and SPT5 and is accordingly referred to as SPT4/
SPT5 (also called DSIF) (7). Originally, SPT4andSPT5 were identified in a yeast genetic screen for mutations sup- pressing transcriptional defects caused by insertions of the transposable element Ty (spt, suppressor of Ty) (8).
*To whom correspondence should be addressed. Tel: +49 941 943 3032; Fax: +49 941 943 3352; Email: Klaus.Grasser@ur.de
doi:10.1093/nar/gku096
ßThe Author(s) 2014. Published by Oxford University Press.
This is an Open Access article distributed under the terms of the Creative Commons Attribution Non-Commercial License (http://creativecommons.org/licenses/
by-nc/3.0/), which permits non-commercial re-use, distribution, and reproduction in any medium, provided the original work is properly cited. For commercial re-use, please contact journals.permissions@oup.com
at Universitaetsbibliothek Regensburg on February 18, 2014http://nar.oxfordjournals.org/Downloaded from
SPT5 is the only transcription factor conserved in all three domains of life and is known as NusG in bacteria (7).
Eukaryotic SPT5 consists of multiple domains including an N-terminal acidic domain, an NGN domain, several KOW domains and a C-terminal repeat region (CTR).
In some species, there is an additional KOW domain within a C-terminal extension. KOW domains can mediate protein–protein and protein–nucleic acid inter- actions, whereas the CTR typically contains residues that can be phosphorylated (7). Other than the generally conserved SPT5, SPT4 occurs in eukaryotes and archaea, but not in bacteria. SPT4 is a small zinc finger protein, and it interacts with SPT5 via the NGN domain, forming the SPT4/SPT5 heterodimer (9).
Yeast cells lacking SPT4 are viable, whereas SPT5 appears to be essential for life in various eukaryotes (7).
SPT4/SPT5 can influence transcription positively and negatively, and in mammalian cells, it regulates transcript elongation in collaboration with another multi-subunit complex termed negative elongation factor (NELF).
However, although SPT4/SPT5 occurs in all eukaryotes, negative elongation factor is not encoded in plant, yeast and nematode genomes (7,10). SPT4/SPT5 can facilitate the elongation stage of RNAPII-catalyzed mRNA synthe- sis, reducing pausing or arrest during transcript elongation (11–14). The exact mechanism of SPT4/SPT5 action is unknown. Structural studies demonstrated that the NGN domain-mediated strategic positioning of SPT4/
SPT5 at the RNAPII clamp domain places SPT4/SPT5 on the elongation complex in a way that locks nucleic acids (i.e. the DNA–RNA hybrid and the transcription bubble) in the enzyme active centre cleft. Thereby, nucleic acid dissociation may be prevented, rendering the elongation complex stable and processive, which allows RNAPII to reach successfully the end of the transcription unit (15–17). Moreover, SPT4/SPT5 may be involved in the recruitment of other TEFs that facilitate transcript elongation (7,10). In addition to their role in transcript elongation, SPT4/SPT5 is involved in pre-mRNA process- ing events including capping and splicing (7).
Because SPT4/SPT5 has not been studied in plants, we set out to examine SPT4 and SPT5, revealing that the two proteins occur in a complex inArabidopsis cells.
Consistent with a function in transcript elongation, SPT5 co-localizes with transcribing RNAPII to euchromatin and associates with the transcription units of RNAPII- transcribed genes. Downregulation of SPT4 expression correlated with markedly altered transcript levels of auxin-related genes and in line with that various plant features known to be regulated by auxin are affected in these plants. Our results indicate that SPT4/SPT5 can modulate the expression ofArabidopsis genes transcribed by RNAPII, particularly influencing the transcription of genes involved in auxin signalling.
MATERIALS AND METHODS Plasmid constructions
The coding sequences of the different genes were amplified by polymerase chain reaction (PCR) with KAPA DNA
polymerase (PeqLab) using an Arabidopsis thaliana com- plementary DNA library as template and the primers (providing also the required restriction enzyme cleavage sites) listed in Supplementary Table S3. The PCR frag- ments were inserted into suitable plasmids using standard methods. All plasmid constructions were checked by DNA sequencing, and details of the plasmids generated in this work are summarized inSupplementary Table S3.
Plant material
Arabidopsis thaliana Col-0 plants, various T-DNA inser- tion mutant lines from the SALK and SAIL collections kindly provided by Nottingham Arabidopsis Stock Centre (http://arabidopsis.info/) and additional transgenic lines were grown on soil in a phytochamber or on solid (0.8%
agar) Murashige-Skoog (MS) medium in a plant incuba- tor. Plants were transformed by Agrobacterium-mediated transformation and genotyped by PCR with gene-specific primers and primers specific for the T-DNA (Supplementary Table S3) as previously described (18,19). T2–T4 plants were used for most experiments.
Plant phenotypes were observed and documented as pre- viously described (20). All root growth assays were per- formed on solid 0.5MS with 1% sucrose and grown on vertically oriented plates in a plant incubator. For indole- 3-acetic acid (IAA) treatment on solid MS, plants were grown for 3 days on plates without IAA, moved onto plates with or without IAA and grown for another 11 days. Using the ImageJ 1.45d3 software (http://rsbweb.
nih.gov/ij/), the root length was measured at days 6 and 14, and the elongation rate was determined by normaliza- tion to the mock treatment. IAA treatment in liquid medium was performed as previously described (21). For estradiol-induction assays, plants were grown on solid MS in the absence or presence of 2mM estradiol for 14 days.
Alternatively, plants were grown on solid MS without es- tradiol for 7 days, and then 10 plants were moved to 25 ml liquid MS with 1% sucrose. After 1 day, seedlings were either mock treated with 0.1% dimethyl sulfoxide or treated with 2mM estradiol dissolved in dimethyl sulfoxide and grown for six additional days.
Antibodies
The C-terminal region of SPT5-2 (aa 792–1041) was ex- pressed inEscherichia colias 6His tagged fusion protein using plasmid pQE-SPT5-2 C and purified by metal- chelate affinity purification as previously described (22).
The protein was used for commercial immunization in rabbit and the obtained antiserum was tested as previously described (18,19). In addition for chromatin immunopre- cipitation (ChIP), we used the commercial primary antibodies against RNAPII-CTD-S2P (rabbit, ab5095, Abcam), RNAPII-CTD-S5P (rabbit, ab1791, Abcam) and H3 C-terminal region (rabbit, ab1791, Abcam). For immunostaining, we used primary antibodies against non- phosphorylated RNAPII-CTD (mouse, ab817, AbCam) and RNAPII-CTD-S2P (rat, 04–1571, Millipore) as well as the secondary antibodies anti-rabbit-Cy3 (Cat: 111–
165–144, Jackson Immuno Research), anti-rat-Alexa 488
at Universitaetsbibliothek Regensburg on February 18, 2014http://nar.oxfordjournals.org/Downloaded from
(Cat: 112–545–167, Jackson Immuno Research) and anti-mouse-Cy5 (Cat: 715–175–151, Jackson Immuno Research).
Reverse-transcribed PCR
For reverse-transcribed PCR (rtPCR), total RNA was ex- tracted with the RNeasy Mini Plant kit (Qiagen). Random hexamer-primed complementary DNA was prepared from total RNA with RevertAidTMH Minus M-MuLV Reverse Transcriptase (Thermo Fisher Scientific) that was used for PCR, or qPCR with KAPA SYBR FAST Universal reagents (PEQLAB Biotechnologie GmbH) and a Mastercycler ep realplex2 (Eppendorf). Targets were quantified with specific primer pairs (Supplementary Table S3). Expression levels were normalized to ACT8 (AT1G49240) andEF1 (AT5G60390) taking the primer efficiency into consideration. P-values were calculated with the softwareRversion 2.15.3.
Transcript profiling using microarray hybridization
Total RNA was isolated from the aerial part of the 10-day- old seedlings grown on solid MS with RNeasy Mini Plant kit (Qiagen) and quality checked with a 2100 Bioanalyzer (Agilent Technologies). Probe-labelling and microarray hy- bridization was performed by the Regensburg microarray facility KFB (http://www.kfb-regensburg.de/) using the ATH1 chip (Affymetrix) representing 22 800 probe sets.
The experimental design comprised three replicates of each genotype, with one replicate corresponding to one RNA extraction of an independent pool of plants. The raw data from the Affymetrix GeneChip arrays (CEL files) were summarized with the robust multi-chip analysis followed by quality control with principal component analysis (23). Transcripts showing a significantly differen- tial expression were identified by pair-wise comparison using a Student’s t test with a P<0.01. Only transcripts with 2-fold change in transcript level were further analysed. Microarray data have been deposited in the Gene Expression Omnibus repository (www.ncbi.nlm.nih.
gov/geo) under accession number GSE49590. Analysis of significantly overrepresented GO categories among up- and downregulated genes (P<0.05), was performed using the BiNGO plugin V2.44 (http://www.psb.ugent.be/cbd/
papers/BiNGO/) for Cytoscape (24).
Light microscopic analyses of plant morphology
Morphological details of plants were examined by light microscopy using a Zeiss Discovery V8 stereomicroscope or a Zeiss Axioscope, and documented using a Zeiss Axiocam MRC5. Fixation and clearing of leaves and siliques was performed as previously described (25).
Staining forb-glucuronidase (GUS) activity of leaves or whole plants (for 3 h) was performed in GUS staining solution [50 mM NaHPO4, pH 7.2; 0.5 mM K3Fe(CN)6; 0.5 mM K4Fe(CN)6; 1% Triton X-100 and 2 mM X-Gluc].
Fixation, substitution, embedding and histological analysis of leaves were performed as recently described (26). For the analysis of root proliferation, roots of 5 d seedlings were stained for 10 min in 20mM propidium iodide solution, before analysis using a Leica SP8
confocal microscope (Leica Microsystems). Cell size and number of green fluorescent protein (GFP)-fluorescent cells were analysed using the ImageJ 1.45d3 software.
Affinity purification and characterization of GS-tagged proteins fromArabidopsis cells
Arabidopsis suspension-cultured PSB-D cells were main- tained and transformed as previously described (27).
Proteins of 15-g cultured cells were extracted in 20-ml ex- traction buffer (25 mM HEPES, pH 7.4, 100 mM NaCl, 0.05% NP-40, 1 mM dithiothreitol, 2 mM MgCl2, 5 mM ethylene glycol tetraacetic acid, 10% glycerol and a pro- teinase inhibitor cocktail) and GS/GS-SPT4 were affin- ity purified using IgG-coupled magnetic beads. Eluted proteins were analysed by sodium dodecyl sulphate- polyacrylamide gel electrophoresis (SDS-PAGE) and immunoblotting as previously described (19). For mass spectrometry, proteins contained in gel slices were digested with 2mg trypsin (sequencing grade, Roche) per 100ml gel volume in 50 mM NH4HCO3overnight at 37C.
Peptides were eluted by two extractions with 100 mM NH4HCO3, followed by one extraction with 50 mM NH4HCO3in 50% acetonitrile. Peptides of the combined extracts were separated on a Ultimate 3000 RSLC nano HPLC System (Dionex) by reversed-phase chromatog- raphy using an AcclaimPepmap 100 C18 nano column (ThermoScientific) in a linear gradient of 0.1% formic acid (eluent A) and 80% acetonitrile in 0.1% formic acid (eluent B). The LC System was coupled to a MaXis 4 G UHR-Q TOF-system (Bruker Daltonics) via a nanoelectrospray source (Bruker Daltonics). Up to five most abundant precursor ions were selected for fragmen- tation by collisional dissociation. The data were launched to Mascot using the ProteinScape software (Bruker Daltonics). Mascot (v2.3.02) was used to search the NCBI nr protein data base. The criteria for reliable protein identification were Mascot scores >85. This value defines a cut-off value where the probability of false-positive identification is 5%. The experimental back- ground of contaminating proteins was assessed and sub- tracted based on 15 GS affinity purifications of the GS-tag only as well as unrelated GS fusion proteins.
The remaining proteins with a mean score of 100 with at least two detected peptides with a score >25 were retained as possible interactors.
In vitroGST pull-down
In vitrotranscription/translation of the N-terminal regions of SPT5 and SPT5L and pull-down assays with GST and GST-SPT4 were performed as recently described (28).
Immunostaining and super-resolution microscopy
Nuclei of meristematic Col-0 cells of root tips were fixed in 4% paraformaldehyde/3.6% sucrose, and squashed onto slides. Immunostaining with different antibodies was performed as previously described (29). Nuclei were counterstained with 4’,6-diamidino-2-phenylindole (1mg/
ml) in Vectashield (Vector Laboratories). To analyse the structures of immunosignals and chromatin at an optical resolution of 100 nm (super-resolution) structured
at Universitaetsbibliothek Regensburg on February 18, 2014http://nar.oxfordjournals.org/Downloaded from
illumination microscopy was applied using a C-Apo 63/
1.2 W Korr objective of a Zeiss ELYRA PS.1 microscope system and the software ZEN (Zeiss). Image stacks were captured separately for each fluorochrome using appropri- ate excitation and emission filters. The degree of co-local- ization between SPT5 and the RNAPII forms was measured in a single representative slice of each image stack and calculated as ‘Overlap coefficient (OC)’ (30) using the ZEN software.
Chromatin immunoprecipitation
ChIP assays using 21 days after stratification plants and different antibodies and preimmune serum were per- formed as previously described in detail (20,31). Five microlitres precipitated DNA (diluted 1:50 for input, 1:10 for H3 and 1:5 for SPT5, RNAPII-CTD-S2P and RNAPII-CTD-S5P) was analysed by qPCR with locus- specific primers (Supplementary Table S3). qPCR was performed as described for rtPCR. The IP data were normalized to the input. P-values were calculated with the softwareRversion 2.15.3.
RESULTS
Identification and expression ofArabidopsis SPT4 andSPT5
To identify possible orthologues of human and yeast SPT4 and SPT5, we searched the Arabidopsis database (http://
www.arabidopsis.org/) with the BLASTP program using these amino acid sequences as a query. The search resulted in two prominent hits each, indicating that two Arabidopsis genes code for SPT4 (At5g08565 and At5g63670 termed SPT4-1 and SPT4-2, respectively) and two genes encode SPT5 (At2g34210 and At4g08350 termedSPT5-1andSPT5-2, respectively) (Supplementary Figure S1A). SPT4-1 and SPT4-2 (both proteins:
13.4 kDa) share 87.9% amino acid sequence identity, and SPT5-1 (110.3 kDa) and SPT5-2 (115.4 kDa) have 65.8% of their amino acid sequence in common.
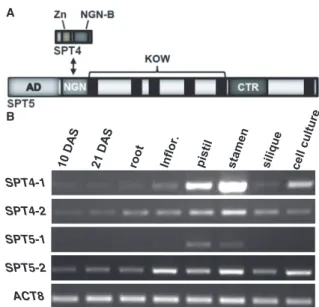
Comparison of the Arabidopsis SPT4 sequences with those of other organisms demonstrated that the zinc- binding motif (including four invariant Cys residues) and the NGN-binding motif (interacting with SPT5) are conserved (Supplementary Figure S2). Arabidopsis SPT5, like the yeast and metazoan counterparts, displays an N-terminal acidic domain, and the NGN and KOW domains are conserved. The CTR is different from that of yeast SPT5, but it shares similarity with human and Drosophila SPT5 (Supplementary Figure S3). Thus, the overall structures of Arabidopsis SPT4 and SPT5 resemble those of their relatives from yeast and metazoa (Figure 1A). In addition to SPT5-1/2, the Arabidopsis genome encodes a third protein with some similarity to SPT5, termed SPT5-like (SPT5L) that is plant-specific and has been implicated in gene silencing pathways (32–34). SPT5L (158 kDa) shares 17.9% amino acid sequence identity with SPT5-2 and has in common with SPT5 a (shorter) acidic domain, the NGN domain and three KOW domains, but in addition within its extensive C-terminal part, it contains multiple WG/GW repeats.
Based on a large set of publicly available Arabidopsis transcript profiling data (http://www.arabidopsis.org/) the SPT4-1, SPT4-2 and SPT5-2 genes are ubiquitously ex- pressed throughout the plant (Supplementary Figure S1B). However, SPT5-1 appears to be expressed at low levels (or not at all) in the majority of analysed tissues except for pollen, where the SPT5-1 transcript is clearly detected. We used rtPCR with primers specific forSPT4- 1/2 and SPT5-1/2 to validate these data in selected Arabidopsis tissues. In line with the transcript profiling data, the transcripts of SPT4-1, SPT4-2 and SPT5-2 were detected in varying amounts in all samples (Figure 1B). TheSPT4-1transcript was detected at com- paratively low levels in most tissues, whereas remarkable amounts were observed in stamen and pistil. TheSPT5-1 transcript was exclusively detected in stamen and pistils.
Because stamen and pistils were isolated from open flowers, it is possible that in line with the aforementioned microarray data, the signal detected in our rtPCRs originated from pollen RNA. Therefore, the SPT4-1, SPT4-2andSPT5-2genes appear to be widely expressed in the plant, whereasSPT5-1expression is likely restricted to pollen.
Plant lines affected in the expression ofSPT4 andSPT5 To examine the role ofSPT4andSPT5inArabidopsis, we have analysed available T-DNA insertion lines. While no suitable lines were available forSPT4-1, we examined one line each for SPT4-2 and SPT5-1, and several lines for SPT5-2 (Supplementary Figure S1A). In plants homozy- gous for the T-DNA insertion inSPT4-2(termedspt4-2), noSPT4-2transcript could be detected by rtPCR analysis,
A
SPT4-1 SPT4-2 SPT5-1 SPT5-2 ACT8 B
Figure 1. Schematic representation ofArabidopsisSPT4–SPT5 and ex- pression of theSPT4/SPT5genes. (A) Domain structure of SPT4 and SPT5, see text for details. (B) Transcript levels of the SPT4-1/2 and SPT5-1/2genes as well as of the reference geneACT8, were examined by rtPCR and a representative experiment is shown. RNA samples derived from selected tissues (aerial parts of 10 and 21 days after strati- fication (DAS) seedlings, roots, inflorescence heads, pistils, stamen, fully elongated green siliques and suspension cultured cells) were analysed with gene-specific primers.
at Universitaetsbibliothek Regensburg on February 18, 2014http://nar.oxfordjournals.org/Downloaded from
while thespt4-1transcript occurred at approximately wild- type levels. spt4-2 plants grew and developed essentially like Col-0 control plants (Supplementary Figure S4A–D).
In plants harbouring a T-DNA insertion in the SPT5-1 gene, no SPT5-1transcript could be detected in stamen.
spt5-1plants are viable and have an appearance and fer- tility similar to Col-0 plants (Supplementary Figure S4E–H). The situation was different for plants harbouring a T-DNA insertion in the ubiquitously expressedSPT5-2.
Four independent segregating T-DNA insertion lines were analysed (Supplementary Figure S1A). Inspt5-2-1plants, SPT5-2transcript levels were not reduced and accordingly the plants had wild-type appearance. However, for three lines (spt5-2-2,spt5-2-3,spt5-2-4), despite great efforts, we were unable to identify plants homozygous for the T-DNA insertions. The segregation pattern of the viable plants (33% wild-type and 66% hemizygous for the T-DNA insertion) indicated that SPT5-2 is an essential gene and individuals homozygous for the T-DNA inser- tion are not viable. To study the role of SPT5-2 in plant growth/development, we attempted unsuccessfully downregulating SPT5-2 expression using the RNAi and amiRNA strategies with constructs under control of the CaMV 35S promoter. In view of this outcome, Arabidopsisplants were transformed with the RNAi con- struct under control of an estradiol-inducible expression system (35). This allowed induction of RNAi expression in seedlings grown in liquid culture by applying estradiol, which (except for line 160.5) resulted in downregulation ofSPT5-2 transcript levels (Supplementary Figure S5A).
The reduced expression of SPT5-2 correlated with decreased growth of the RNAi lines both in liquid and solid medium that was also evident from a reduction in fresh weight of the plants by 60–70% (Supplementary Figure S5B–D). These experiments revealed thatSPT5-2 is an essential gene inArabidopsisand induced downregu- lation of its expression severely impairs plant growth.
Reduced expression ofSPT4causes vegetative and reproductive defects
Col-0 plants were transformed with an RNAi construct directed against SPT4-2 under control of the 35S promoter to study the effect of reducedSPT4 expression.
Several independent transformed lines were analysed, and plants harbouring the RNAi construct displayed a reduced size both under long-day (Figure 2A) and short- day conditions (Supplementary Figure S6A). Owing to the sequence similarity of the two genes, rtPCR experiments demonstrated that the transcript levels of both SPT4-1 and SPT4-2 were reduced in the transgenic lines.
Moreover, the transcript levels were reduced to different extent in the various lines (Figure 2B), and the degree of downregulation corresponded to the plant size of the various lines (Figure 2A). Thus, plants of line R3 were smallest and displayed the lowestSPT4 transcript levels.
Because in yeast spt4D cells (relative to wild-type cells), reduced levels of 3xFLAG-SPT5 were detected (36), we compared the amount of native SPT5 in SPT4-R3 and Col-0. We also observed reduced amounts of SPT5 in SPT4-R3 plants relative to Col-0 (Supplementary
Figure S6B). Further phenotypic analyses of the SPT4–
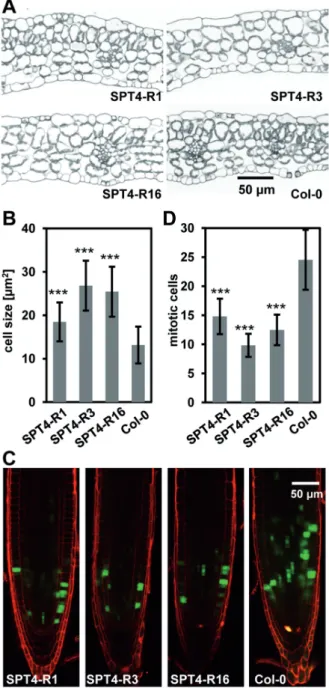
RNAi plants revealed that the degree of growth reduction of the individual plant lines relative to Col-0 is also evident from the differences in leaf size, rosette diameter and plant height (Figure 2C–E). The effects observed were most severe for the RNAi lines R3 and R7, whereas the other RNAi lines were affected more mildly. For further analyses, we concentrated on the strongly affected RNAi line R3 and the less severely affected lines R1 and R16 relative to Col-0. These analyses revealed that the RNAi plants had fewer rosette leaves (Supplementary Figure S6C) and exhibited reduced fresh/dry weight (Supplementary Figure S6D and E). To examine whether defects in cell proliferation and/or cell expansion are responsible for the reduced growth of the plants with decreased SPT4 expression, leaf sections of the RNAi lines and Col-0 were analysed. In line with the reduced size of the leaves (Figure 2C), fewer palisade paren- chyma cells (e.g. 60% reduction in SPT4-R3) were counted across leaf blade sections of RNAi plants (Supplementary Figure S6F). Closer inspection revealed that palisade cells of RNAi plants were enlarged relative to Col-0 and less tightly packed (i.e. in line R3,Figure 3A and B), but still because of the reduced cell number leaves of RNAi, plants were clearly smaller than those of Col-0.
To further investigate cell proliferation, SPT4-RNAi and Col-0 plants were crossed with a pCYCB1;1-GFPmarker line, which allows visualization of cells at the G2-M phase of the cell cycle (37). Scoring the number of GFP- expressing cells in the root meristem demonstrated fewer mitotic cells in the RNAi lines as compared with Col-0 (Figure 3C and D), indicating that cell proliferation is reduced in the plants with decreased SPT4expression.
In addition to the defects during vegetative develop- ment, the RNAi lines exhibited differences during the re- productive phase, when compared with Col-0. The RNAi plants had fewer leaves at bolting, but the bolting time was similar to Col-0 (Supplementary Figure S7AandB). They also had fewer primary and secondary inflorescences than the control plants (Supplementary Figure S7C and D).
Analysis of the flowers revealed that the floral organs of the RNAi plants had a reduced size relative to Col-0 flowers (Supplementary Figure S7E). Freshly harvested siliques of the RNAi lines were smaller than Col-0 siliques and they displayed a reduced abscission of floral organs (Supplementary Figure S7F). In line with their decreased size, clearing of fully elongated siliques showed that the RNAi lines contained a markedly reduced number of seeds per silique (Supplementary Figure S7G,H), as a significant fraction of the ovules did not develop (Supplementary Figure S7I). Hence, the com- bination of a decreased number of inflorescences and the reduced seed set result in a distinctly affected fertility of the SPT4–RNAi plants.
SPT4 is involved in the expression of auxin-related genes In view of the transcription-related function of SPT4 and the growth defects of the RNAi plants defective inSPT4 expression, genome-wide transcript profiling was per- formed to identify possible alterations in gene expression.
at Universitaetsbibliothek Regensburg on February 18, 2014http://nar.oxfordjournals.org/Downloaded from
Figure 2. Phenotype of SPT4-RNAi plants. (A) Representative individuals of the different RNAi lines relative to Col-0 (28 DAS top, 21 DAS bottom) are shown. (B) The transcript levels ofSPT4-1/2,SPT5-2and the reference geneUBQ5 in the RNAi lines and Col-0 were examined by rtPCR with gene-specific primers. The RNA was isolated from 10 DAS plants and a typical result is shown. (C) Leaves were photographed of 26 DAS plants grown on solid MS. Rosette diameter 35 DAS (D) and plant height 15 d after bolting (E) were determined and analysed using a one-way analysis of variance (ANOVA). Error bars indicate SD of at least 10 plants. Data sets marked with asterisks are significantly different from Col-0 as assessed by Dunnett’s multiple comparison test: *P<0.05, **P<0.01 or ***P<0.001. Each experiment was performed at least three times with similar results.
at Universitaetsbibliothek Regensburg on February 18, 2014http://nar.oxfordjournals.org/Downloaded from
RNA isolated from aerial parts of 10-day-old SPT4-R3 and Col-0 seedlings was comparatively examined by microarray hybridization. 501 genes (2.2%) were2-fold upregulated, whereas 662 genes (2.9%) were 2-fold
downregulated in SPT4-R3 relative to Col-0. To gain insight into the biological processes, in which the signifi- cantly differentially expressed genes are involved, we analysed these genes for gene ontology (GO) (24). A GO category that was downregulated strikingly comprises genes involved in ‘response to auxin stimulus’
(Supplementary Figure S8). Among the auxin-related genes (Supplementary Table S1) remarkably manyAUX/
IAA genes were detected. Most prominent was the subgroup of AUX/IAA genes, whose expression is indu- cible by auxin in Arabidopsis seedlings (38) or that were found to be induced by short-term IAA application (39).
We validated the expression of severalAUX/IAAgenes by quantitative real-time rtPCR, essentially confirming the microarray data (Table 1andSupplementary Figure S9).
These experiments demonstrated that seven of nine auxin- inducible AUX/IAA genes (38) were 2.7 - to 56-fold downregulated in SPT4-R3 relative to Col-0 plants. In plants of the less severely affected SPT4-R1 and SPT4- R16 lines, theAUX/IAA genes were also downregulated, albeit to a lesser extent (Supplementary Figure S9).
Subsequently, it was examined whether the inducibility of the AUX/IAA genes was affected in plants of the SPT4-R3 line, when compared with Col-0. In SPT4-R3 plants, the transcripts of the tested IAA1, IAA5, IAA19 and IAA29 genes were clearly induced to a lesser extent after treatment of the plants with IAA (Figure 4A).
To examine whether the altered expression of auxin- related genes is biologically relevant, we analysed add- itional plant characteristics including leaf venation pattern as well as primary root length, root gravitropism and lateral root density that are known to be influenced by auxin (40,41). Vein patterning was studied in cleared leaves of RNAi and Col-0 plants. While the venation of cotyledons was hardly affected in the RNAi lines, dif- ferences were observed in the first and second leaf (Supplementary Figure S10A). The effect was severe with SPT4-R3 leaves and clearly weaker with the SPT4- R1/R16 plants. The SPT4-R3 leaves lacked most of the tertiary and higher-order veins, and in addition to the reduced vein branching, the leaves showed markedly more free-ending veins. Root growth experiments revealed that primary roots of Col-0 plants tend to grow straight vertically, while the gravitropism of the primary root of SPT4-R3 plants was affected exhibiting a more wavy growth pattern (Figure 4B). The length of the primary root was measured for 2 weeks, revealing that the roots of the RNAi plants grew more slowly than those of Col-0 and again SPT4-R3 was most severely affected (Supplementary Figure S10B). In addition, the RNAi plants had fewer lateral roots and the density of lat- eral roots along the primary root was reduced (Figure 4C).
Because of these findings that indicate alterations in auxin signalling in the SPT4-RNAi plants, we tested the response of the plants to the application of exogenous IAA, known to inhibit Arabidopsis root elongation (42).
Plants were treated with different concentrations of IAA, and the elongation rate of the primary root of RNAi plants was determined relative to that of untreated plants. Root elongation was more severely inhibited by IAA in the RNAi plants than in Col-0 (Figure 4D),
Figure 3. SPT4-RNAi plants have larger cells, but are affected in cell proliferation. (A) Sections of leaves (12 DAS) of the different RNAi plant lines and Col-0. (B) Quantification of palisade parenchyma cell size based on light microscopic images. Cell size was analysed using a one-way ANOVA. Error bars indicate SD of at least 57 cells. Data sets marked with asterisks are significantly different from Col-0 as assessed by Dunnett’s multiple comparison test: *P<0.05, **P<0.01 or
***P<0.001. (C) CLSM of primary root tips of the different plant lines (5 DAS) harbouring apCYCB1;1-GFPreporter (GFP fluorescence in green and propidium iodide staining in red). (D) The number of GFP-expressing mitotic cells per root tip was analysed using a one- way ANOVA. Error bars indicate SD of at least 23 roots of three independent experiments. Data sets marked with asterisks are signifi- cantly different from Col-0 as assessed by Dunnett’s multiple compari- son test: *P<0.05, **P<0.01 or ***P<0.001.
at Universitaetsbibliothek Regensburg on February 18, 2014http://nar.oxfordjournals.org/Downloaded from
suggesting that the RNAi plants are more sensitive to the application of exogenous IAA. To further explore the auxin response in plants with reduced expression of SPT4, a DR5-GUS reporter (43) was introgressed into SPT4-R3 and Col-0 plants. Comparative histochemical staining for GUS activity of the aerial parts of the plants showed a generally more intense staining in SPT4-R3 plants than in Col-0 (Figure 4E). While with Col-0 staining was essentially restricted to the leaf margins and hydathodes, with SPT4-R3 staining was seen additionally across the leaf blade and veins. These experiments revealed that in SPT4-R3 plants, the auxin response (as visualized using the DR5 reporter) is stronger and spatially less confined than in Col-0.
SPT4/SPT5 complex inArabidopsis
Since SPT4 interacts with SPT5 in other organisms (7), we intended to identify interactors of Arabidopsis SPT4.
Therefore, SPT4-2 C-terminally fused to a GS-tag and the unfused GS-tag (44) were expressed under control of the 35S promoter inArabidopsissuspension-cultured cells, an approach that was used to identify other nuclear protein complexes (45,46). The Coomassie-stained banding pattern after SDS-PAGE of total protein extracts of non-transformed cells and of cells expressing
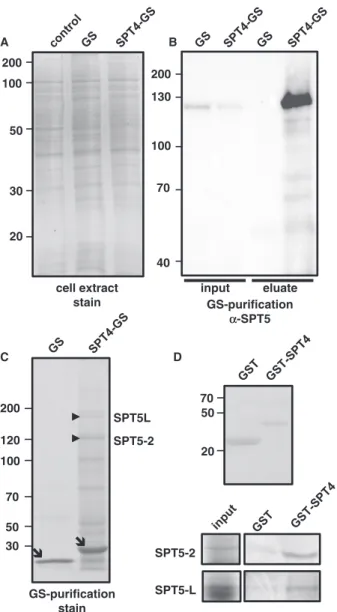
SPT4-GS or GS was similar and the bands corresponding to GS and GS-SPT4 did not stand out in the extracts of the transformed cell lines (Figure 5A). To identify proteins interacting with SPT4, SPT4-GS and the GS control were comparatively isolated from the same amount of cell extract by IgG affinity purification. For analysis of the protein fractions, antisera were raised against recombin- ant full-length SPT4-2 and the C-terminal part of SPT5-2.
While the SPT4 antiserum proved not useful, the SPT5 antiserum reacted specifically with a protein band of the expected size of 120 kDa in an immunoblot analysis of the SPT4-GS and GS input samples (Figure 5B). This band was clearly enriched in the SPT4-GS eluate, but not detectable in the GS control eluate. This indicates that SPT4 and SPT5 occur in a protein complex in Arabidopsis cells. To identify possible additional interactors of SPT4, SPT4-GS eluates (along with control GS eluates) were analysed by SDS-PAGE, and proteins contained in gel slices were analysed compara- tively after tryptic digestion by mass spectrometry (Supplementary Table S2). In line with the immunoblot analysis, we identified by mass spectrometry the protein band reacting with the SPT5 antiserum as SPT5-2 (Figure 5C). Interestingly, SPT5L (32,33) was also clearly identified in all SPT4-GS eluates with high scores, but not in the GS control samples. The bands corresponding to SPT5-2 and SPT5L are among the most prominent Coomassie-stained bands of the SPT4- GS eluates (except for the bands corresponding to the tagged SPT4-GS and GS proteins), indicating that both proteins are interactors of SPT4-2. Moreover, co-purifying reproducibly with SPT4-GS (Supplementary Table S1) we identified subunit 1 of the putative Arabidopsis CCR4-NOT complex, a multiprotein complex that in yeast is involved in the control of tran- script elongation (47) as well as the ELO2 and ELO3 subunits of the Elongator complex that is also well characterized in Arabidopsis (45,48). The two largest subunits of RNAPII (NRPB1/2) were identified in the SPT4-GS samples (and not in the GS controls) with somewhat lower confidence. We intended to perform similar affinity purification experiments with a SPT5-2- GS fusion, but because of a pronounced genetic instability of theSPT5coding sequence in bacteria (bothE. coliand Agrobacterium tumefaciens), despite great efforts, we were unable to generate the required construct to express the SPT5 fusion protein in plant cells. To examine whether SPT4 and SPT5 interact directly (as in other organisms), in vitro pull-down experiments were performed with recombinant GST and with GST fused to SPT4 (GST- SPT4). Thein vitrotranslated N-terminal part of SPT5-2 (including the NGN domain) was incubated with immobilized GST-SPT4-2 and as a negative control with GST. Bound proteins were eluted and analysed by SDS-PAGE. SPT5-2 clearly bound to GST-SPT4 and only background was detected with GST (Figure 5D).
Similarly, we observed that the N-terminal part of SPT5L specifically interacted with GST-SPT4 and not with GST. Therefore, both SPT5-2 and SPT5L can directly interact with SPT4.
Table 1. Regulation ofAUX/IAAgenes in SPT4-R3 plants relative to Col-0
AGI Gene Auxin
induciblea
Fold change microarray
Fold change qPCR
At4g14560 IAA1 +,# 8.42 9.14
At3g23030 IAA2 +,# 5.14 4.10
At1g04240 IAA3 # 2.66 3.72
At5g43700 IAA4 + 3.08 2.73
At1g15580 IAA5 +,# 3.41 10.14
At1g52830 IAA6 + 6.63 4.70
At3g23050 IAA7 1.13
At2g22670 IAA8 1.14
At5g65670 IAA9 1.36
At1g04100 IAA10 1.02
At4g28640 IAA11 +,# 1.12
At1g04550 IAA12 1.21
At2g33310 IAA13 +,# 1.51
At4g14550 IAA14 4.69
At1g80390 IAA15 n.d.
At3g04730 IAA16 2.31
At1g04250 IAA17 1.73 1.02
At1g51950 IAA18 1.28
At3g15540 IAA19 +,# 6.97 8.66
At2g46990 IAA20 1.12
At3g16500 IAA26 1.15
At4g29080 IAA27 1.41
At5g25890 IAA28 1.00
At4g32280 IAA29 +,# 24.61 56.12
At3g62100 IAA30 1.57
At3g17600 IAA31 1.11
At2g01200 IAA32 1.01
At5g57420 IAA33 1.15
At1g15050 IAA34 1.01
aAUX/IAA genes that are auxin-inducible according to Overvoorde et al. (38) are indicated by +, and those which are inducible by short-term IAA application according to Paponov et al. (39) are indicated by #.
at Universitaetsbibliothek Regensburg on February 18, 2014http://nar.oxfordjournals.org/Downloaded from
SPT5 localizes to euchromatin and associates with actively transcribed genes
Using super-resolution structured illumination micros- copy and our SPT5-specific antiserum, the localization of SPT5 was studied in meristematic cells of the Arabidopsis root tip. The SPT5 signal was exclusively detected in the nucleus (Figure 6), but mitotic chromo- somes were SPT5 negative (data not shown). This demon- strates that SPT5 is a nuclear protein of interphase cells.
To investigate the sub-nuclear distribution of SPT5 relative to transcribing RNAPII, cells were simultaneously labelled with the respective antibodies and counterstained with DAPI. We used RNAPII antibodies specific for the elongating form [phosphorylated at Ser2 of the heptamer repeats of the carboxy-terminal domain (CTD)] and specific for the non-phosphorylated form. However, owing to heterogeneity of CTD phosphorylation and
variations in repeat sequence, a single RNAPII CTD may be recognized by several antibodies specific for dif- ferent phosphorylation states. After applying super-reso- lution microscopy, it became obvious that SPT5 and both forms of RNAPII composed separate reticulate structures within the euchromatin, but they were absent from the nucleolus and heterochromatin (Figure 6). Further analysis of the degree of co-localization between SPT5 and the RNAPII signals revealed that SPT5 is more clearly associated with the elongating (CTD-S2P) than with the non-phosphorylated form of RNAPII. This is seen, for instance, in the insets (Figure 6, bottom) by the bright red areas (indicating SPT5, but no RNAPII signal) in the merged image of SPT5 and the nonphosphorylated form of RNAPII, whereas in the merged image of SPT5 and the elongating RNAPII hardly any red areas are seen, as due to the co-localization of the two signals, the vast majority of the SPT5 signals appear yellow or orange.
Figure 4. SPT4-RNAi plants display auxin-related defects. (A) Reduced IAA inducibility ofAUX/IAAgenes. Six DAS seedlings were treated for 2 h with 20mM IAA, and transcript levels of the indicatedAUX/IAAgenes were measured using quantitative rtPCR. Fold change in transcript levels after IAA treatment was analysed using a one-way ANOVA. Error bars indicate SD of at least three biological and three technical replicates. Data sets marked with asterisks are significantly different from Col-0 as assessed by Dunnett’s multiple comparison test: *P<0.05, **P<0.01 or
***P<0.001. (B) Documentation of 10 DAS plants grown on solid MS. (C) The number of lateral roots per centimetre of primary root was scored at the indicated DAS. Data were analysed using a one-way ANOVA. Error bars indicate SD of at least 14 plants. Data sets marked with asterisks are significantly different from Col-0 as assessed by Dunnett’s multiple comparison test: *P<0.05, **P<0.01 or ***P>0.001. The experiment was performed three times with similar results. (D) Elongation rate of the primary root at different IAA concentrations relative to untreated plants. The relative elongation rate was analysed using a one-way ANOVA. Error bars indicate SD of at least 13 plants. Data sets marked with asterisks are significantly different from wild-type as assessed by Dunnett’s multiple comparison test: *P<0.05, **P<0.01 or ***P<0.001. The experiment was performed twice with similar results. (E) Response to auxin as visualized using theDR5-GUSreporter. Col-0 and SPT4-R3 plants harbouring the DR5-GUS reporter were histochemically stained for GUS activity and representative images are shown. Aerial part of plants (18 DAS), cotyledon, first and second leaf (from left to right) were analysed. Size bars correspond to 1 mm.
at Universitaetsbibliothek Regensburg on February 18, 2014http://nar.oxfordjournals.org/Downloaded from
To examine the association of SPT5 with transcribed genes in more detail using ChIP, we have chosen to study the distribution of SPT5 at a relatively long gene transcribed by RNAPII (At3g02269, transcribed region of 17.5 kb), as different regions of the gene can be reliably discriminated. For these experiments, the SPT5 antiserum was used in comparison with the preimmune serum, and the ChIP efficiency of different gene regions (Figure 7A) was quantified by qPCR. SPT5 was detected along the
entire transcribed region of At3g02260 with increasing levels towards the 30-end of the gene (Figure 7B). Only background levels were detected at intergenic region 6 and at the DOG1 gene (Figure 7B) that is expressed seed-specifically (49), and therefore is not transcribed in the ChIP material. For comparison, ChIP assays were performed using a histone H3-specific antibody, revealing a similar association of H3 at all tested regions including the intergenic region and the DOG1 gene (Figure 7C).
Similar results were obtained for the long transcribed region of another gene (At1g48090) that we have tested by ChIP (data not shown). Therefore, in these assays typical of TEFs, SPT5 is found along the entire region transcribed by RNAPII. In additional ChIP experiments, we compared in SPT4-R3 and Col-0 chromatin, the asso- ciation of SPT5 with the At3g02260 gene, whose transcript levels according to our microarray experiment (and add- itional rtPCR tests) is similar in Col-0 and SPT4-R3.
We detected elevated levels of SPT5 along the transcribed region of this gene in SPT4-R3 (Figure 7D). In view of the co-localization of SPT5 and elongating RNAPII, similar ChIP assays were performed with antibodies specific for the elongating forms of RNAPII (phosphorylated within the CTD repeats at positions Ser2 or Ser5) and against histone H3. In line with the elevated SPT5 association, RNAPII-S2P and RNAPII-S5P were detected at increased levels in SPT4-R3 when compared with Col-0, whereas H3 association was not significantly altered (Figure 7E–G).
In these experiments, RNAPII-S5P is somewhat more enriched towards the 50 end of the transcription unit, whereas RNAPII-S2P occurs with slightly higher tendency towards the 30 end of the transcribed region, a feature that is well documented in yeast and metazoa (50).
In plants, details of the RNAPII-CTD phosphorylation during the transcription cycle are not known, but recently kinases were identified that catalyze phosphoryl- ation of specific serine residues within the CTD (51) and a distribution of RNAPII-S2P/S5P comparable with our observations was found at some Arabidopsis genes (52).
Subsequently, we examined the distribution of RNAPII- S2P and RNAPII-S5P at threeAUX/IAAgenes in Col-0.
As with At3g02260, RNAPII-S5P was found enriched at the 50-end of the (relatively short) transcription units, whereas RNAPII-S2P was detected more readily at the 30-end (Figure 7H). The association of RNAPII-S5P with the IAA1, IAA19 and IAA29 genes that are downregulated in SPT4-R3, was compared in Col-0 and SPT4-R3 plants. RNAPII-S5P was enriched in SPT4-R3 in the 50region of the transcription units, but not in the 30 region (Figure 7I). The association of SPT5 was enhanced in SPT4-R3 relative to Col-0 both in the 50and 30regions of theAUX/IAAtranscription units (Figure 7J). Elevated levels of RNAPII (and RNAPII-associated TEFs) along transcribed regions suggest defects in transcript elongation such as decreased elongation rates (1,53).
DISCUSSION
Transcript elongation is a complex process and differential phosphorylation of the RNAPII-CTD is involved in
_ _ _ _ _
200 100
50
30
20
cell extract stain A
_ _ _
_ _ _
GS-purification stain
SPT5L SPT5-2 200
120 100
50 70
30
►
► C
130
100
70
40 200
_ _
_ _ _
GS-purification αα-SPT5 input eluate B
50
_
20
_
70
_
D
SPT5-2 SPT5-L
Figure 5. SPT4 occurs in a complex with SPT5 and SPT5L. (A) Protein extracts of untransformed cells and of cells expressing unfused GS or SPT4-GS after SDS-PAGE and Coomassie-staining of the gel. (B) Immunoblot analysis with an anti-SPT5 serum of input samples and eluates of the GS/SPT4-GS affinity purifications. (C) Eluates of the affinity purifications after SDS-PAGE and Coomassie- staining of the gel. The unfused GS-tag and SPT4-GS are indicated by arrows, whereas the bands corresponding to SPT5-2 and SPT5L, identified by mass spectrometry in the SPT4-GS eluate, are indicated by arrowheads. (D) Pull-down assays with recombinant GST and GST- SPT4 (shown in the top panel).The N-terminal regions of in vitro translated 35S-Met-labelled SPT5-2 (aa1-314) and SPT5L (aa1-294) were incubated with immobilized GST and GST-SPT4-2. After washing the glutathione beads, eluted proteins were analysed by SDS- PAGE and detected by phosphorimaging (bottom panels). Aliquots of the protein input samples (25%) are also shown.
at Universitaetsbibliothek Regensburg on February 18, 2014http://nar.oxfordjournals.org/Downloaded from
coordinating mRNA synthesis and the different process- ing steps. In addition, a variety of TEFs is engaged facilitating mRNA synthesis by RNAPII in the chromatin context, but also modulating the linkage to the processing
events (6,50). SPT4/SPT5 is a typical example of a TEF that directly interacts with RNAPII, regulating the elong- ation phase of mRNA synthesis (7,10). We have characterized hereArabidopsisSPT4/SPT5, demonstrating
Figure 6. SPT5 localizes to transcriptionally active euchromatin. Co-localization analysis of SPT5 (red) with elongating RNAPII (CTD-S2P, green) and RNAPII (non-phosphorylated CTD, white) within euchromatic regions of the nucleus of a meristematic cell visualized by SIM. The nucleus was counterstained with DAPI (blue). The proteins evident as looped fibres form differential reticulate structures sometimes in contact with each other and with chromatin. They are not present in the nucleolus (n) and within heterochromatin (arrows). For comparison with the SIM images, the merged nucleus (four colours) is also shown in wide-field (WF) illumination. Analysis of the degree of co-localization between SPT5 and the RNAPII signals (overlap coefficient, OC) revealed that SPT5 is more clearly associated with the elongating (OC = 0.86;n= 18; SD = 0.0240) than with the non-phosphorylated (OC = 0.71;n= 18; SD = 0.0212) form of RNAPII. The preferential association of SPT5 with RNAPII-CTD-S2P rather than the non-phosphorylated form of RNAPII is also obvious from the insets.
at Universitaetsbibliothek Regensburg on February 18, 2014http://nar.oxfordjournals.org/Downloaded from
that it is conserved in plants and apparently serves critical functions in gene expression. Affinity purification of SPT4 from suspension-cultured cells resulted in efficient co- purification of SPT5-2, strongly indicating that the SPT4/SPT5 heterodimer occurs in plants. Interestingly, we also identified SPT5L as interactor, a chromatin- associated protein implicated in RNA-directed DNA methylation (32–34). SPT5L displays limited similarity to SPT5, but the two proteins share the NGN domain that mediates the interaction between SPT5 and the NGN-binding domain of SPT4 (9). Therefore, an
interaction between SPT4 and SPT5L is not unexpected and in vitro GST pull-down assays confirmed that the N-terminal portions of both SPT5-2 and SPT5L (including their NGN domains) interacted directly with SPT4-2. In view of the 3D structure of the RNAPII- SPT5NGN-SPT4 complex (16,17), it is unlikely that SPT5 and SPT5L are found in the same complex. One should rather expect that the two proteins occur in differ- ent complexes, which would be in agreement with the different mechanisms SPT5 and SPT5L appear to be involved. It will be attractive to elucidate whether the
Figure 7. SPT5 associates with the transcribed region of genes transcribed by RNAPII. (A) Schematic representation (not drawn to scale) of At3g02260 with the boxed region indicating the transcribed region (exons, introns) of 17.5 kb and the bars above indicate the relative positions of the regions analysed by ChIP in (B–G). ChIP analyses of At3g02260 in (B–G) and of the indicatedAUX/IAAgenes (50and 30 indicate that the PCR amplicon is located in the 50or 30 part of the transcribed region, respectively) in (H–J). The analysed genotype (Col-0 or SPT4-R3) is given above each histogram as well as the used antibody: PI, preimmune; SPT5; H3; S2P (RNAPII-CTD phospho-Ser2); S5P (RNAPII-CTD phospho- Ser5). For the ChIP experiments, percentage input was determined by qPCR and analysed using one-way ANOVA. Error bars indicate SD of at least three biological and three technical replicates. Data sets marked with asterisks are significantly different from PI (B, H) or wild-type (D–G, I, J) as assessed by Dunnett’s multiple comparison test: *P<0.05, **P<0.01 or ***P<0.001.
at Universitaetsbibliothek Regensburg on February 18, 2014http://nar.oxfordjournals.org/Downloaded from
plant-specific SPT4/SPT5L plays a role in gene silencing.
The two largest subunits of RNAPII (NRPB1, NRPB2) also co-purified with SPT4, and based on structural studies NRPB1 would be expected to be linked to SPT4 indirectly via the NGN domain of SPT5. Moreover, subunits of the TEF complexes CCR4-NOT (47) and Elongator (45,48) were found to co-elute reproducibly with SPT4-GS, but not with the GS control. In previous experiments, the isolation of affinity-tagged SPT4 from yeast cells resulted in the co-purification of SPT5 and the two largest subunits of RNAPII (54). When SPT5 was affinity-purified from yeast cells, SPT4 and RNAPII were identified as interactors as well as depending on puri- fication conditions additional TEFs including SPT6 and IWS1 (54,55). Therefore, our protein interaction experi- ments, identifying other TEFs and RNAPII as interactors, are in principle consistent with the findings in yeast, and suggest that SPT4/SPT5 is involved in transcript elong- ation inArabidopsis.
InArabidopsis, both SPT4 and SPT5 each are encoded by two closely related genes.SPT5 is essential for life in yeast,Drosophila, zebra fish and mammalian cells (7,10), and in line with that the generally expressed SPT5-2 is essential inArabidopsis. In contrast, expression ofSPT5- 1, whose expression appears to be restricted to pollen, seems to be dispensable, most likely becauseSPT5-2can supplySPT5function throughout the plant.SPT4is non- essential in yeast under normal growth conditions, but its importance in higher eukaryotes has not been clarified (7).
Downregulation of SPT4-1 and SPT4-2 expression by RNAi in Arabidopsis results in severe growth defects that are correlated with the extent of reduction in SPT4 transcript levels. Although the cell size is slightly increased in the SPT4–RNAi plants, the decreased growth is caused by the predominating effect of markedly reduced cell pro- liferation. Moreover, SPT4–RNAi plants exhibit various developmental defects including reduced leaf number, lacking floral organ abscission and impaired fertility.
The role of SPT5 in global gene expression was examined by transcript profiling in zebrafish embryos 24 h after fertilization and HeLa cells, comparing samples with downregulated SPT5 expression and controls. Both studies revealed that a relatively small number of genes was differentially expressed in the samples depleted in SPT5, for instance, in zebrafish only
<5% of the genes were affected (56,57). Likewise, our transcript profiling experiment comparing transcript levels of the SPT4-R3 plants with those of Col-0 revealed that 5.1% of the genes were 2-fold differen- tially expressed. InArabidopsismutants that are defective in other TEFs, for instance, TFIIS and Elongator, simi- larly the transcript levels of only a relatively small propor- tion of genes was affected (58,59). Genome-wide chromatin association studies in yeast imply that TEFs (including SPT4/SPT5) are found at all transcribed genes (60). The finding that only a subset of genes is incorrectly expressed in the absence of a certain TEF, indicates that a number of genes for some reason appear to be more sen- sitive to the loss/depletion of a specific TEF (4,10).
Transcript elongation is a non-uniform process and due to the influence of many factors (i.e. TEFs, chromatin
structure, mRNA processing factors) it rather displays a considerable degree of heterogeneity when elongation rates of different genes (or even within a single gene) are compared (53). Currently, it is still ill-defined to which extent different characteristics of a gene (e.g. DNA sequence, inducibility, expression level, RNAPII density, chromatin structure, co-transcriptional mRNA process- ing) determine RNAPII elongation rate and the require- ment of particular TEFs for proper transcription (6,53,61). Most likely it is the combination of these influencing factors that account for the dependency of some genes on the action of certain TEFs.
In line with several potential auxin-related phenotypes that we have observed for the SPT4–RNAi plants, genes involved in auxin signalling were prominent among the genes downregulated in SPT4-R3. Most striking was the downregulation of AUX/IAA genes. The Arabidopsis genome encodes 29 AUX/IAA proteins that act as short- lived repressors of auxin response factor (ARF) transcrip- tion factors.Arabidopsisencodes 22 ARFs, which bind to auxin response elements in target gene promoters, and depending on the type of ARF they can act as transcrip- tional repressor or activator. Auxin-promoted degrad- ation of AUX/IAAs results in release of active ARFs from AUX/IAA-ARF heterodimers and subsequently the ARFs can regulate target gene expression (40,41).
Members of the AUX/IAA and ARF families to some extent are differentially expressed and they have the po- tential of forming not only different types of heterotypic, but also homotypic complexes. This provides an enormous range of transcriptional regulators with poten- tially distinct specificities, although it is still unclear to which extent these protein interactions occur in the plant (62). The reduced transcript levels ofAUX/IAA genes in SPT4–RNAi plants most likely result in lower AUX/IAA repressor levels that may cause elevated activity of activating ARFs. In agreement with that enhanced auxin response was visualized in leaves of SPT4–RNAi plants using theDR5-GUSreporter. In these plants, particularly the auxin-inducible AUX/IAAs were downregulated, which typically encode the more unstable AUX/IAA proteins (39). They are considered as tools to rapidly re- plenish AUX/IAA pools, which then counteract further transcriptional response (40,41). However, in SPT4–
RNAi plants the transcript levels of auxin-inducible AUX/IAAs are not only downregulated, but their inducibility by IAA is also noticeably affected, which may contribute to the enhanced auxin response. Perhaps the rapid transcriptional induction of these genes on IAA treatment poses a special problem in the presence of limiting amounts of SPT4. Forward genetic screens have identified various aux/iaa mutants and the majority of them are gain-of-function mutations, increasing the stabil- ity of the AUX/IAAs. These mutants display a variety of developmental defects associated with a reduced sensitiv- ity to auxin (40,41). However, in the SPT4–RNAi plants there are likely lower levels of AUX/IAA repressors than in wild type to be destabilized on auxin treatment.
Therefore, one would expect that these plants are more sensitive towards exogenously applied auxin, and in agree- ment with that we observed that relative to Col-0 the root
at Universitaetsbibliothek Regensburg on February 18, 2014http://nar.oxfordjournals.org/Downloaded from
elongation rate of the SPT4–RNAi plants is more readily affected by IAA.
Typical of a TEF that facilitates transcription by RNAPII, we found that SPT5 localizes to the transcrip- tionally active euchromatin in Arabidopsis nuclei. It co- localizes with transcribing RNAPII phosphorylated at Ser2 within the CTD repeats more clearly than with non-phosphorylated RNAPII, a finding that is consistent with the features reported for Drosophila SPT5 (63). In line with the super-resolution microscopic analyses, ChIP experiments performed with Arabidopsis seedlings revealed that SPT5 associates with the entire transcribed regions of RNAPII-transcribed genes, but not with an intergenic region or a non-transcribed gene. SPT5 appeared to be enriched towards the 30 end of the transcribed region. Genome-wide chromatin association experiments in yeast demonstrated that SPT4 and SPT5 display a peak at the 50end of the transcription units and an enrichment towards the 30 end of the transcribed regions (60). The somewhat different distribution seen in our ChIP experiments is likely due to the small number of genes tested, or it may reflect a biological difference that could be examined in future genome-wide studies. When comparing chromatin of SPT4-R3 and Col-0 plants, increased levels of SPT5 and transcribing RNAPII (Ser5P, Ser2P) were found along the transcribed region of the long At3g02260 gene as well as at the AUX/IAA genes that are downregulated in SPT4-R3. Various TEFs were found to modulate RNAPII elongation rates and/or processivity (1,3,53). Elevated levels of RNAPII (and TEFs) are indicative of transcript elongation defects, and may be caused by reduced elongation rates. Thus, down-regulation of SPT6 in Drosophila or mutation of SPT5 in yeast, relative to the wild-type controls resulted in decreased RNAPII elongation rates and increased RNAPII occupancy at transcribed genes (64,65). At un- altered transcript initiation rates, decreased RNAPII elongation rates may cause higher RNAPII density.
Studies in different systems documented that SPT4/SPT5 acts as a regulator of transcript elongation in vitro and in vivo (11–14,65,66). In yeast, reduced RNAPII processivity was reported for a spt4 mutant (66), whereas for a spt5mutant, a decreased transcript elong- ation rate was observed that may be related to a function of SPT4/SPT5 facilitating RNAPII transcription through obstacles to transcript elongation such as nucleosomes (65). In line with these findings, our ChIP experiments indicate that decreased levels of SPT4 cause transcript elongation defects also in Arabidopsis, as evident from the enhanced RNAPII (and SPT5) occupancy within tran- scription units. Still the majority of genes is normally ex- pressed in the SPT4–RNAi plants, but the transcription (and inducibility) of certain genes (i.e. AUX/IAA) is clearly affected, resulting in reduced transcript levels. In addition to SPT4/SPT5, several otherArabidopsischroma- tin factors were identified that affect auxin signalling, raising the possibility that auxin-related gene expression is particularly sensitive to effects on transcript elongation in the chromatin context. Thus, the chromatin remodelling factor PKL is involved in IAA14-mediated repression of ARF7/19 in lateral root initiation (67).
Auxin signalling (including AUX/IAA expression) was perturbed in mutant plants affected in SDG2, a histone methyltransferase that catalyzes H3K4me3, which is a histone mark characteristic of transcribed genes (68).
The chromatin factor PRZ1 is required for accurate H3K9/14ac levels (within promoter and transcribed region) at auxin-controlled loci (69). Moreover, in mutants affected in the expression of the well-characterized TEF, Elongator, auxin-related genes were downregulated and accordingly the plants displayed phenotypes characteristic for auxin signalling defects (45). In view of these findings, it will be attractive to test, whether additional chromatin factors involved in transcript elongation contribute to auxin-related gene expression.
SUPPLEMENTARY DATA
Supplementary Dataare available at NAR Online.
ACKNOWLEDGEMENTS
The authors thank Andrea Bleckmann for advice regard- ing light microscopy and auxin experiments, Thomas Stempfl for help with the microarray experiment, Eduard Hochmuth for recording mass spectra, Joachim Griesenbeck for stimulating discussions throughout the project, Geert De Jaeger for Arabidopsis PSB-D cells, Peter Doerner and Arp Schnittger for the pCYCB1;1- GFPmarker line, Uli Hammes for theDR5-GUSmarker line, Ruth Stadler for the estradiol-inducible expression system and the Nottingham Arabidopsis Stock Centre (NASC) for providingArabidopsisT-DNA insertion lines.
FUNDING
The Danish Research Council (to K.D.G.); EU Research Training Network CHIP-ET [FP7-PEOPLE-2013-ITN to A.H. and K.D.G.]; German Research Foundation (DFG) through [SFB960 to R.D., M.G. and K.D.G.].
Funding for open access charge: DFG programme
"Open Access Publishing" (University of Regensburg).
Conflict of interest statement. None declared.
REFERENCES
1. Saunders,A., Core,L.J. and Lis,J.T. (2006) Breaking barriers to transcription elongation.Nat. Rev. Mol. Cell Biol.,7, 557–567.
2. Selth,L.A., Sigurdsson,S. and Svejstrup,J.Q. (2010) Transcript elongation by RNA Polymerase II.Ann. Rev. Biochem.,79, 271–293.
3. Sims,R.J., Belotserkovskaya,R. and Reinberg,D. (2004)
Elongation by RNA polymerase II: the short and the long of it.
Genes Dev.,18, 2437–2468.
4. Grasser,K.D. (2005) Emerging role for transcript elongation in plant development.Trends Plant Sci.,10, 484–490.
5. Smith,E. and Shilatifard,A. (2013) Transcriptional elongation checkpoint control in development and disease.Genes Dev.,27, 1079–1088.
6. Perales,R. and Bentley,D. (2009) ‘‘Cotranscriptionality’’: the transcription elongation complex as a nexus for nuclear transactions.Mol. Cell,36, 178–191.
at Universitaetsbibliothek Regensburg on February 18, 2014http://nar.oxfordjournals.org/Downloaded from