doi: 10.3389/fmars.2019.00393
Edited by:
Minhan Dai, Xiamen University, China Reviewed by:
ShuhJi Kao, Xiamen University, China Christoph Waldmann, University of Bremen, Germany
*Correspondence:
Heather M. Benway hbenway@whoi.edu
Specialty section:
This article was submitted to Ocean Observation, a section of the journal Frontiers in Marine Science
Received:19 November 2018 Accepted:24 June 2019 Published:12 July 2019
Citation:
Benway HM, Lorenzoni L, White AE, Fiedler B, Levine NM, Nicholson DP, DeGrandpre MD, Sosik HM, Church MJ, O’Brien TD, Leinen M, Weller RA, Karl DM, Henson SA and Letelier RM (2019) Ocean Time Series Observations of Changing Marine Ecosystems: An Era of Integration, Synthesis, and Societal Applications. Front. Mar. Sci. 6:393.
doi: 10.3389/fmars.2019.00393
Ocean Time Series Observations of Changing Marine Ecosystems: An Era of Integration, Synthesis, and Societal Applications
Heather M. Benway1* , Laura Lorenzoni2,3, Angelicque E. White4, Björn Fiedler5, Naomi M. Levine6, David P. Nicholson1, Michael D. DeGrandpre7, Heidi M. Sosik1, Matthew J. Church8, Todd D. O’Brien9, Margaret Leinen10, Robert A. Weller1, David M. Karl4, Stephanie A. Henson11and Ricardo M. Letelier12
1Woods Hole Oceanographic Institution, Woods Hole, MA, United States,2National Aeronautics and Space Administration, Washington, DC, United States,3College of Marine Science, University of South Florida, St. Petersburg, FL, United States,
4School of Ocean and Earth Science and Technology, University of Hawai‘i at Manoa, Honolulu, HI, United States,¯
5GEOMAR Helmholtz Centre for Ocean Research, Kiel, Germany,6Dana and David Dornsife College of Letters, Arts and Sciences, University of Southern California, Los Angeles, CA, United States,7Department of Chemistry and Biochemistry, University of Montana, Missoula, MT, United States,8Flathead Lake Bio Station, University of Montana, Missoula, MT, United States,9National Oceanic and Atmospheric Administration, Silver Spring, MD, United States,10Scripps Institution of Oceanography, La Jolla, CA, United States,11National Oceanography Centre, Southampton, United Kingdom,12College of Earth, Ocean, and Atmospheric Sciences, Oregon State University, Corvallis, OR, United States
Sustained ocean time series are critical for characterizing marine ecosystem shifts in a time of accelerating, and at times unpredictable, changes. They represent the only means to distinguish between natural and anthropogenic forcings, and are the best tools to explore causal links and implications for human communities that depend on ocean resources. Since the inception of sustained ocean observations, ocean time series have withstood many challenges, most prominently availability of uninterrupted funding and retention of trained personnel. This OceanObs’19 review article provides an overarching vision for sustained ocean time series observations for the next decade, focusing on the growing challenges of maintaining sustained ocean time series, including ship-based and autonomous coastal and open-ocean platforms, as well as remote sensing. In addition to increased diversification of funding sources to include the private sector, NGOs, and other groups, more effective engagement of stakeholders and other end- users will be critical to ensure the sustainability of ocean time series programs. Building a cohesive international time series network will require dedicated capacity to coordinate across observing programs and leverage existing infrastructure and platforms of opportunity. This review article outlines near-term observing priorities and technology needs; explores potential mechanisms to broaden ocean time series data applications and end-user communities; and describes current tools and future requirements for managing increasingly complex multi-platform data streams and developing synthesis
products that support science and society. The actionable recommendations outlined herein ultimately form the basis for a robust, sustainable, fit-for-purpose time series network that will foster a predictive understanding of changing ocean systems for the benefit of society.
Keywords: ocean time series, marine ecosystems, climate, end-users, synthesis, sustained observations
INTRODUCTION
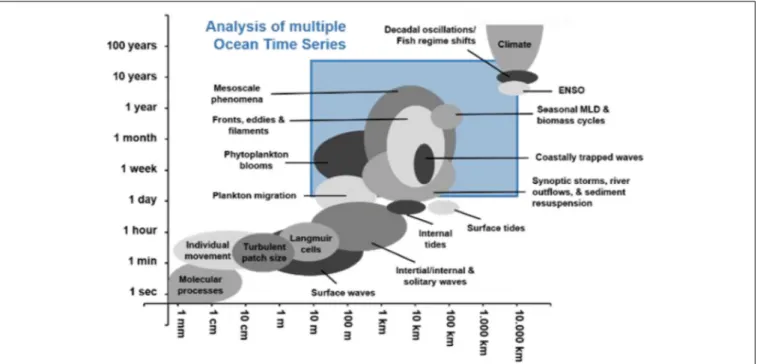
Humans depend on the ocean for many goods and services, including fisheries and aquaculture production, natural products, water purification, shoreline protection, transportation, and recreation. Oceanic processes affecting these services vary over a range of time and space scales (Figure 1), with anthropogenic forcing contributing an added layer of complexity. In a growing effort to distinguish between natural and human-induced changes, which statistically requires several decades of sustained measurements (Henson et al., 2016), ocean time series from ships, autonomous surface and underwater vehicles, and satellite-based platforms have taken on a greater importance. Long-term ocean observations have already provided unprecedented insights into how marine ecosystems function and how they are changing over a range of temporal and spatial scales.
Sustained time series observations come at a cost, as they require lasting investments in trained personnel, institutions, and infrastructure that facilitate repeat measurements of physical, atmospheric, biological, and biogeochemical variables. However, the payoffs on these investments are significant, as ocean time series data help characterize natural patterns of ocean system variability and associated links to regional climate indices, as well as long-term anthropogenic impacts on marine ecosystems (Neuer et al., 2017). The resulting long-term data sets also provide the mechanistic and observational knowledge of ocean structure and function that form the conceptual basis of Earth System Models, which are in turn critical to forecasting marine ecosystem changes and informing management and policy development (Karl, 2010; Valdés and Lomas, 2017).
These data sets also directly support calibration/validation of autonomous in situ and remote (satellite, airborne) sensors.
In addition to monitoring changes in marine ecosystems, time series programs benefit the oceanographic community by providing data sets to support the scientific goals of countless ancillary projects. Furthermore, ship-based time series, in particular, have long served as invaluable training sites for scientists of all career stages, as testbeds for new technology and methods, and as incubators for interdisciplinary scientific inquiry.
As part of the Global Ocean Observing System (GOOS), the Framework for Ocean Observing (Lindstrom et al., 2012) outlined a strategy for establishing universally accepted sets of Essential Ocean Variables (EOVs), advancing technology, particularly for biological and biogeochemical variables, and integrating across observing programs and platforms to develop products that support science and society. However, it is noteworthy that there is a striking discrepancy between these EOV sets and the core variables that have been measured by
keystone ocean time series for over 30 years.Lampitt et al. (2010) highlighted the importance of Eulerian observatories and the need for regional to global arrays in monitoring long-term ocean change. Since then, some of this vision has been realized through the development of networks that integrate observing assets across time and space scales. However, increased international coordination and attention to sustained funding mechanisms are needed to develop a more cohesive ocean time series network and ensure more routine incorporation of ocean time series in products that support science and society. Building on lessons learned and recommendations put forth by Lampitt et al. (2010) andKarl (2010), this OceanObs’19 review article brings much needed attention to the growing challenges of maintaining sustained ocean time series (coastal and open ocean, in situ, and remote) and outlines near-term observing priorities and technology development, mechanisms to broaden end-user communities, tools for dealing with increasingly complex multi- platform data streams, and synthesis products as part of an overarching vision for sustained ocean time series. In this paper, we highlight four major themes we view as important areas for development over the coming decade:
(1) Strengthen marine ecological observing capacity through enhancement of shipboard, autonomous, and satellite- based observing assets.
(2) Promote greater integration of ocean time series data and Earth System Models to better understand processes underlying ocean change and improve predictive capacity.
(3) Broaden applications and end-users of ocean time series data.
(4) Foster global collaboration and networking to advance science, expand and improve measurements, and optimize data access.
THE CURRENT OCEAN TIME SERIES MODEL: INSIGHTS AND CHALLENGES
Since the early to mid-20th century, sustained repeat measurements of ocean physics, biology, and biogeochemistry have provided insights into marine ecosystem function and patterns of variability in the ocean. The earliest examples of such observatories include Station E1 of the Western Channel Observatory in the English Channel (1903), Station M in the Norwegian Sea (1948), the California Cooperative Oceanic Fisheries Investigations (CalCOFI) in the California Current System (1949), Ocean Station Papa in the northeast Pacific (1947), Hydrostation S in the Sargasso Sea (1954), and the Boknis Eck Time Series Station in the Baltic Sea (1957). The Joint
FIGURE 1 |Temporal and spatial scales of a range of ocean processes. The blue square highlights the range of space and time scales that can be addressed by ship-based time series measurements (fromValdés and Lomas, 2017).
Global Ocean Flux Study (JGOFS) era saw the establishment of seven new time series programs, including the Bermuda Atlantic Time-series Study (BATS), European Station for Time series in the Ocean, Canary Islands (ESTOC), DYnamique des Flux Atmosphériques en MEDiterranée (DYFAMED), Hawaii Ocean Time-series (HOT), Kerguelen Point Fixe (KERFIX), Kyodo Northwest Pacific Ocean Time-series (KNOT), and South East Asia Time-Series Station (SEATS), each with its own scientific drivers but all motivated by a common overarching set of JGOFS objectives and implementation procedures, including standard core measurements and protocols, offering ample opportunities for comparative analyses of marine ecosystem state and function (e.g., Karl et al., 2003). Today, ocean time series are operating throughout the global ocean and across multiple platforms, including ship- and shore-based programs, autonomous assets (stationary moorings, free-floating floats, guided gliders, autonomous surface ships, etc.), satellites, and formalized single- and multi-platform observing networks such as the Argo and Biogeochemical-Argo (BGC-Argo) Programs, the Ocean Observatories Initiative (OOI), OceanSITES, the Marine Biodiversity Observation Network (MBON), and the Long-Term Ecological Research (LTER) Program. The aforementioned time series platforms and networks collectively span the broad range of time and space scales needed to query the biological, physical, and chemical states of the ocean and examine links to local, regional, and global-scale processes. Ship-based ocean time series have also increasingly served as test beds for the development of new sensors, methodologies, and calibration/validation sites.
They have provided valuable seagoing and hands-on training opportunities for the next generation of ocean scientists, as well as a forum for international collaboration and capacity building.
Insights From Sustained Ocean Time Series Observations
Marine ecosystems are experiencing unprecedented rates of change associated with rising atmospheric carbon dioxide (CO2) levels and climate change, including concurrent shifts in temperature, circulation, stratification, nutrient input, oxygen (O2) content, and ocean acidification. Marine food webs comprise a delicate balance among primary producers, intermediate consumers, and top predators. Sustained repeat ocean time series measurements across multiple platforms have documented changes in marine ecosystems over a range of time and space scales in both open ocean and coastal systems.
Changing Ocean Chemistry
The ocean has absorbed 25–30% of the anthropogenic CO2
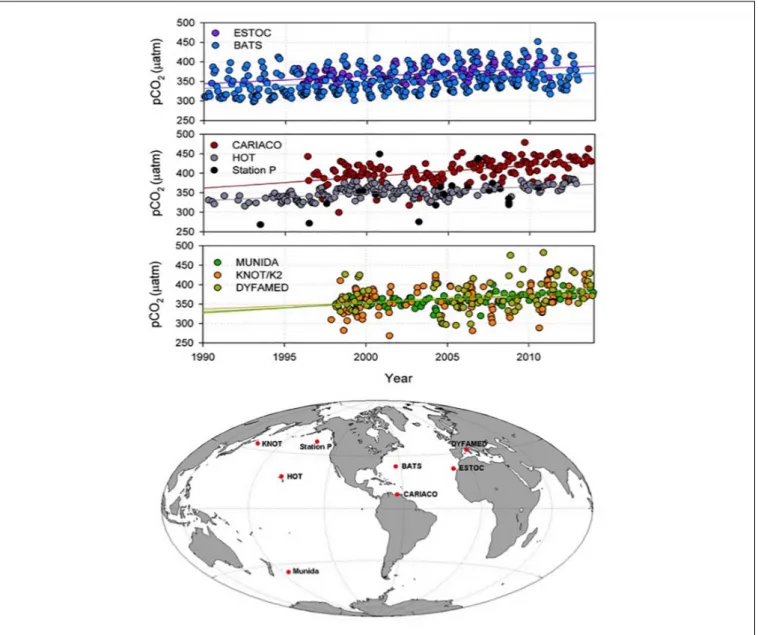
emitted since the preindustrial era (Sabine et al., 2004;Gruber et al., 2019). Recent analyses of ocean partial pressure of CO2 (pCO2) across multiple independent open ocean shipboard ocean time series sites (Figure 2) show increasing acidity across ocean basins over the past 2–3 decades (Bates et al., 2014;
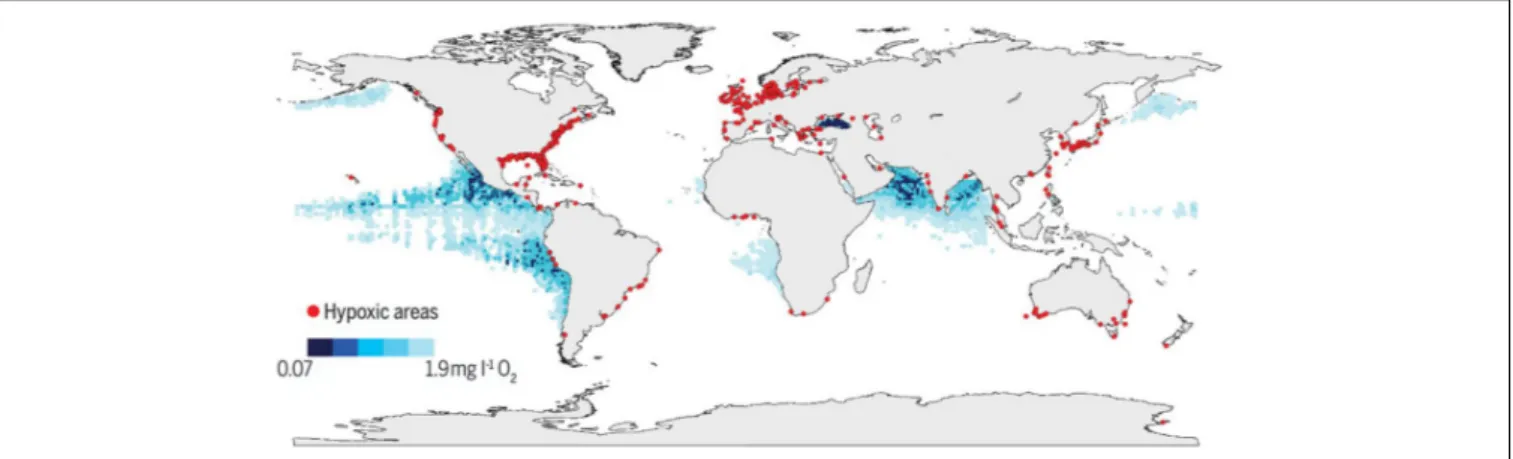
Tanhua et al., 2015), demonstrating the global extent of this phenomenon and the importance of high-resolution data sets to remove seasonality and elucidate longer-term trends. In addition to increasing acidity, warming, increased stratification, and circulation changes have reduced O2levels, particularly in eastern boundary upwelling systems off southern California, South America, and West Africa (Stramma et al., 2008) (Figure 3).
The CalCOFI ocean time series has documented a decline in O2 levels and a shoaling of the oxygen minimum layer over the past 2–3 decades that is likely to affect organisms living in the water column and on the seafloor (Bograd et al., 2008).
FIGURE 2 | Top:Time series observations ofpCO2normalized for seasonal variations.Bottom:Locations of the time series stations. The increasing trend inpCO2
observed over several decades at the time series stations is indicative of the increasing uptake of anthropogenic CO2by the ocean, which leads to rising ocean acidity. DYFAMED, DYnamique des Flux Atmosphériques en MEDiterranée; KNOT, Kyodo North west Pacific Ocean Time-series/K2. Figure modified from Tanhua et al. (2015).
Two to three decades of time series observations across the tropical and subtropical North Atlantic have recorded decadal- scale changes in the O2 content of the subtropical underwater that are likely driven by ventilation changes tied to the Atlantic Multidecadal Oscillation (AMO) (Montes et al., 2016). The Candolim Time Series (CATS) off western India has documented an intensification of the O2-deficient zone of the Arabian Sea, presumably in response to increases in land-derived nutrient inputs (Naqvi, 2006).
Biological Rates and Carbon Export
Long-term biogeochemical and ecological time series observations have yielded fundamental insights into processes controlling carbon exchange between the air and sea, rates
of carbon transformation throughout the marine food web, and fluxes of carbon into the ocean’s interior. For example, in subtropical gyres, annual net community production (NCP) and air–sea exchange of CO2dominate the flow of carbon near the ocean surface (Quay and Stutsman, 2003). NCP reflects the ocean’s capacity to biologically sequester atmospheric CO2 for periods of months to millennia by exporting organic carbon to the deep sea. Quantifying NCP with high confidence and reproducibility represents a key challenge for the oceanographic community. Ocean time series programs have provided seasonal observations for quantifying NCP by geochemical approaches (e.g., Neuer et al., 2007), and more recently have helped to facilitate development of a new suite of ocean productivity measurements that supplement shipboard observations with
FIGURE 3 |Global map of low and declining O2levels in the open ocean and coastal waters fromBreitburg et al. (2018). The global map indicates coastal sites where anthropogenic nutrients have exacerbated or caused O2declines to<2 mg L−1(<63µmol L−1) (red dots), as well as ocean O2minimum zones at 300 m (blue shaded regions). Figure permissions granted through AAAS license # 4578800750164 (accompanying documentation provided).
autonomous and remote sensing platforms and sensors (Church et al., 2013). The use of new platforms for measurement of ocean NCP have broadened our understanding of the factors that drive changes in NCP over a range of space and time scales.
As an example, measurements of upper ocean chemical mass balances of O2 and dissolved inorganic carbon (DIC) made with a profiling float and a surface mooring at Ocean Station Papa have helped document the impact of the recent subarctic northeast Pacific warm sea surface temperature (SST) anomaly (“the Blob” –Bond et al., 2015) on annual NCP (Yang et al., 2018).
Systematic comparison of different measurement- and platform- based NCP estimates is critical for identifying pathways that regulate carbon fluxes and testing assumptions and uncertainties underlying productivity measurements and models.
Marine Ecosystem Shifts and Species Distribution Ocean time series observations have documented prominent marine ecosystem shifts associated with well known interannual- to decadal-scale climate cycles such as the El Niño-Southern Oscillation (ENSO) and the AMO. For example, in the coastal Pacific Ocean, ENSO has been shown to affect primary productivity in surface waters (IMARPE time series stations, Peru and MBARI, CA) (Chavez et al., 2011), while in the oligotrophic Pacific (HOT), a shift in the phytoplankton community was linked to changes in the North Pacific climate system (Karl et al., 2001; Corno et al., 2007). The CARIACO Ocean Time Series in the Cariaco Basin off the northern coast of Venezuela documented similarly important climate and ecosystem changes in the tropical Atlantic. In 2004, the phytoplankton community in this region underwent a marked shift from mostly diatoms to much smaller phytoplankton, accompanied by increased phytoplankton diversity and zooplankton biomass, and declining primary productivity. These changes reflected adjustments in regional circulation and biogeochemistry that were attributed to both natural shifts and human pressures, with severe negative impacts on local ecosystem services (Taylor et al., 2012). Regrettably, the CARIACO time series program was terminated in 2017.
Ocean time series have provided important insights regarding the impacts of anthropogenic change on individual species and communities of phytoplankton, which support the entire marine food web and are key players in global biogeochemical cycles. These data sets not only document ecological response but they provide the baseline knowledge needed to develop predictive capacity. Using historical data from the Continuous Plankton Recorder (CPR) time series in the North Atlantic, Barton et al. (2016) mapped the biogeography of prominent North Atlantic phytoplankton taxa and then used a model to project future changes in biogeography and community composition. While temperature is an important driver, this study also demonstrated the importance of ocean circulation and surface conditions that influence mixed layer depth (light, salinity, macronutrients). Similarly, an analysis of a long- term phytoplankton time series from the English Channel (Edwards et al., 2013) revealed highly predictable relationships between key functional traits easily measured in the laboratory (light utilization, nitrate uptake, growth rate) and seasonal environmental variations, providing the necessary basis for the use of trait-based modeling approaches to predict phytoplankton response to environmental change.
Management of Marine Resources
Ocean time series observations of marine ecosystems have the capacity to inform management of marine resources such as commercial fisheries and prediction of harmful algal blooms (HABs) and associated human health risks. Marine food webs are inextricably linked to human communities, particularly in coastal waters that are home to keystone commercial fisheries. Ocean time series observations off the United States east (Martha’s Vineyard Coastal Observatory, MVCO) and west (CalCOFI) coasts have recently documented warming-related phenological changes in organisms at lower trophic levels. Such climate-driven shifts in bloom phenology affect the function of marine food webs and, ultimately, alter the ocean’s capacity to provide food and sequester carbon. High-resolution flow cytometer measurements from
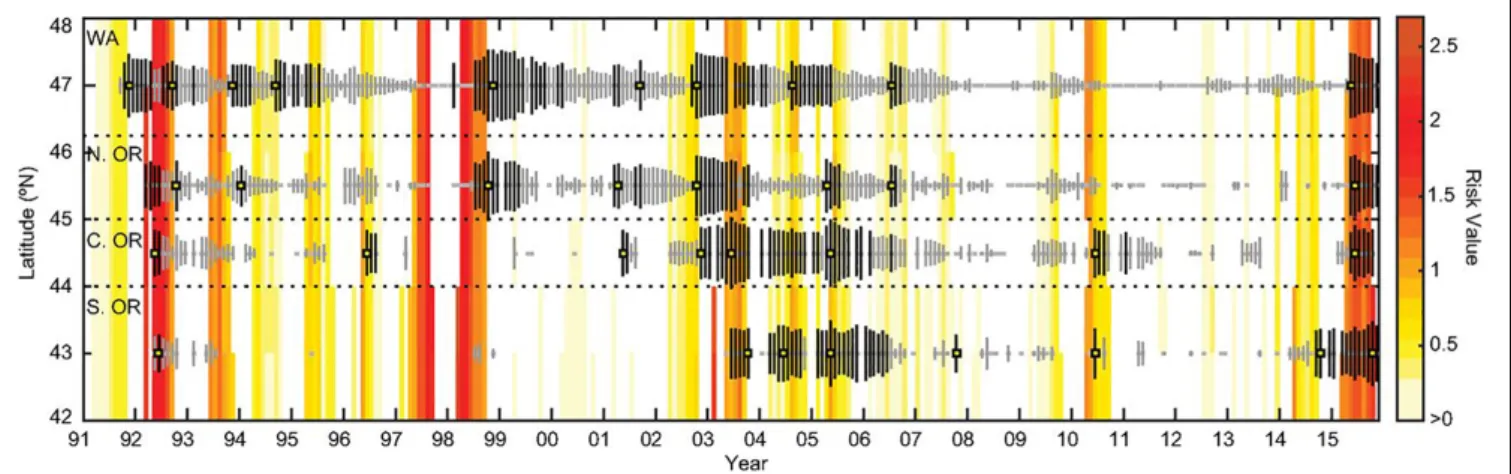
FIGURE 4 |Domoic Acid (DA) risk analysis model output (yellow to red) and DA levels in Oregon (OR) and Washington (WA) razor clams (vertical bars) from 1992 to 2015. Model values indicate increased risk of elevated DA based on proxies of warm ocean parameters; model values are only calculated during upwelling season, when concentrations of phytoplankton are likely to be greatest each year. White regions indicate that elevated DA is least likely, as the model equals zero and/or it is downwelling season. From top to bottom, monthly maximum DA values (vertical bars) are latitudinally binned as follows: WA (46.3◦N to 48◦N), northern OR (45◦N to 46.3◦N), central OR (44◦N to 45◦N), and southern OR (42◦N to 44◦N). Bar length is proportional to the monthly maximum DA value. Color indicates DA≥20 ppm (black lines), from 1 to<20 ppm (gray lines), or not detected (gray squares). An absence of points indicates no DA data available. Annual DA maxima used in model evaluation are highlighted with yellow squares. Figure fromMcKibben et al. (2017).
an ocean time series in New England coastal waters revealed phenological changes in Synechococcus, with spring blooms occurring earlier in response to warmer water temperatures (Hunter-Cevera et al., 2016). Data from the CalCOFI time series (Asch, 2015) also showed shifts in the phenology of larval fishes tied to earlier surface ocean warming in the California Current ecosystem, a productive commercial fishery.
A study from the northern California Current (McKibben et al., 2017) documented an increased incidence of shellfish containing domoic acid associated with warm SST anomalies during the upwelling season over the past 20 years. This warm water could be tied to the warm phases of the Pacific Decadal Oscillation (PDO) and ENSO. A risk assessment model based on this connection of climatic and local events can predict domoic acid outbreaks along the United States west coast and other eastern boundary current systems worldwide (Figure 4).
Challenges of Sustained Ocean Time Series Observations
Despite the well-established benefits of sustained marine ecosystem observations, ocean time series programs face many challenges, including:
• availability of sustained funding;
• varying levels of access to analytical facilities, instrumentation, and technology;
• lack of standardized sampling and analytical approaches across time series, all of which hinder comparability of data sets across sites (Lorenzoni and Benway, 2013);
• varying levels of data access with no community guidelines for data citation to ensure proper crediting of time series data providers (Neuer et al., 2017); and
• multiple disconnected databases and interfaces for accessing time series data without a universal set of data and metadata reporting guidelines.
In a funding environment that typically prioritizes innovative, curiosity-driven science and supports projects on 3- to 5-year timelines, it is a challenge to maintain long-term uninterrupted funding for ocean time series programs, which can result in data gaps, changes in sampling methodology and frequency, and high personnel turnover that can compromise data quality and scientific utility of the data sets. Additionally, long-term time series observations often rely on the availability of major infrastructure such as ships, which requires advance planning, scheduling, and attention to maintenance to support smooth operations.
Thus, many time series operate on a shoestring budget or as add-ons to other existing sampling programs of opportunity, which are not necessarily sustainable. The fate of many time series programs is determined by the availability of resources and shifting priorities of public or private funding sources.
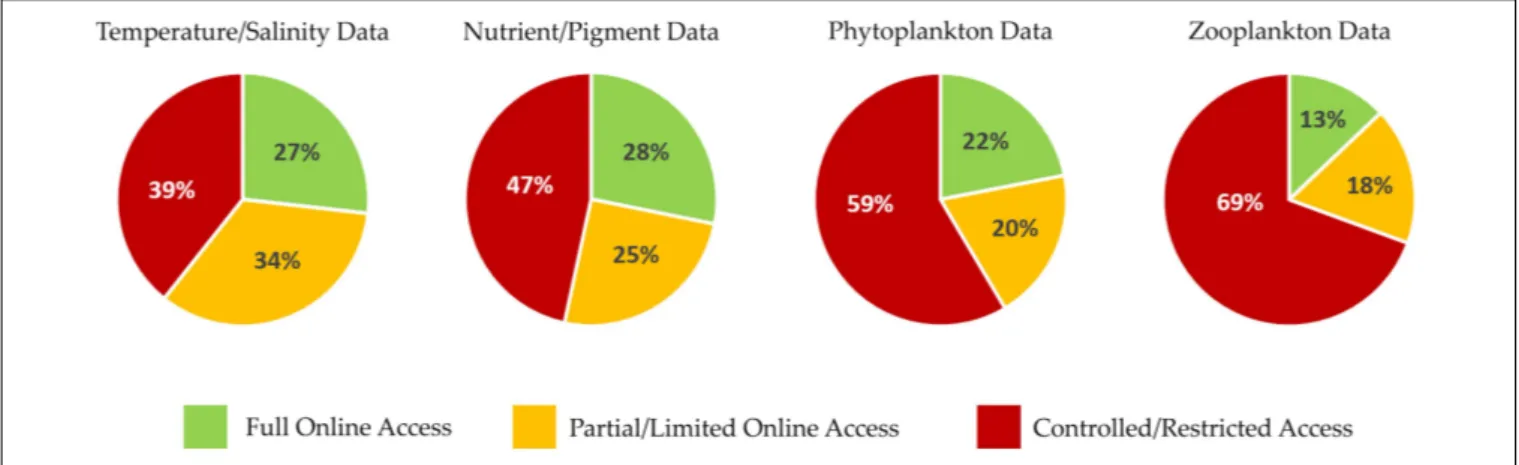
Data sharing and discoverability are still major issues in the ocean time series community. While some funding agencies require that time series data sets be made accessible to the broader community on a reasonable timeline, other time series data may have limited access with significant time lags or be fully proprietary, which presents a challenge to conducting science across time series sites. When a time series scientist’s productivity is evaluated based on research and publications, there is limited incentive to invest time in sharing data that have been collected with a great deal of effort. Issues of time series data accessibility were recently broached via a survey of time series data contributors to the International Group for Marine Ecological Time Series (IGMETS) study, an effort led
FIGURE 5 |Results of an anonymous survey sent out to all scientists who participated in the International Group for Marine Ecological Time Series (IGMETS) study indicating level of data accessibility by major variable groupings. Green indicates full/free online access to all of the data. Yellow/orange indicates that data are online but have intentional time delays of 2 years or subsetted/incomplete variable sets, requiring users to contact person/institute for the most up-to-date and complete data. Red indicates that none of the data are online and are only available by contacting the data collector or institutional data manager. Compared with physical and biogeochemical data, the percentage of freely available biological data is lower, with a relatively large fraction of zooplankton and phytoplankton data being protected. This likely reflects the amount of time and expertise that is required to collect biological data sets. Training a full species-level microscope plankton taxonomist takes years. Unrestricted and freely available plankton time series tend to be government-run programs with consistent funding that are often tied into legal mandates or water quality monitoring.
by the Intergovernmental Oceanographic Commission (IOC)- UNESCO, the International Ocean Carbon Coordination Project (IOCCP), and the Ocean Carbon and Biogeochemistry (OCB) Program (O’Brien et al., 2017). Based on survey responses (Figure 5), the top two reasons for limiting and/or delaying data access were: (1) to have sufficient time to QA/QC the data and research and publish new findings from their data collection efforts, and (2) to monitor community data usage as a means to justify continued support for the program(s). In addition, the oceanographic community has seen a proliferation of ocean databases with a broad range of overlapping scientific and programmatic drivers. Funding of these database-only initiatives not only takes away from support for oceanographic sampling efforts themselves (e.g., time series), but a continued lack of connectivity and interoperability among databases translates to a great deal of duplicative effort. The lack of synergy among databases also makes it more challenging for end-users to find comparable data sets of interest from within and across regions.
Addressing these issues will require a more unified and standardized approach for how time series data are managed and accessed in order to maximize the return on investment and enable ready access to end-users. Additionally, developing mechanisms to incentivize data sharing would go a long way toward addressing this problem. For example, collaborative time series science activities such as IGMETS and the International Council for the Exploration of the Sea (ICES) working groups on microbial, phytoplankton, and zooplankton ecology found that while many time series scientists were not willing to submit their data to a free-access public database, they were willing to loan their data to the working group’s protected cooperative data pool to support comparative analysis and scientific products for broad distribution (Mackas et al., 2012;O’Brien et al., 2012, 2013, 2017;Paerl et al., 2015). This protected pool limits data access to working group participants and ensures that they receive
proper citation, credit, and acknowledgment in any scientific product or paper that includes their data. While perhaps not an ideal solution, this model has been effective for supporting the development of topically focused scientific products that utilize time series data. These types of guarantees and controls are not typically available in a public database. IGMETS may have found an acceptable middle-ground, in which it will be creating a (optional-participation) data journal publication in conjunction with its next report, slated to be released in 2020.
Data publications assign both a citation and a DOI to the contributed data, and have strong interest from the current IGMETS data-contributing participants. This concept has also been applied successfully for data submission to the Surface Ocean CO2 Atlas (SOCAT). Ultimately, it is a high priority to identify solutions that reduce the lag time between data collection and provision, streamline data access, improve interoperability between data systems, and properly cite data providers.
OCEAN TIME SERIES OF THE FUTURE Building Biological and Ecological Monitoring Capacity
Monitoring and diagnosing marine ecosystem change requires physiological and molecular measurements of individuals, as well as measurements at different ecosystem scales to explore changes in community structure, trophic dynamics, biodiversity, and biogeographic distribution. Currently, there is limited capacity to measure biological populations and processes remotely (autonomous and satellite-based platforms). Shipboard measurements and incubation experiments are constrained in their spatiotemporal representation, and there is still discrepancy across different methods and approaches, making it difficult to compare observations across multiple time series. While the
oceanographic community has made great strides over the past couple of decades in developing physical and biogeochemical observing capacity, a more holistic understanding of marine ecosystem function and change is still needed. The oceanographic community is now developing sensors, instruments, platforms, and systems that could make large-scale and long-term ocean biological observation possible in the future. Advances in imaging, acoustic measurement, and genomic sensing show great promise for the future. Although each approach is in a different stage of maturity, there is great enthusiasm within the communities for investment to develop these capabilities.
These observations of life in the sea complement and integrate with physical and biogeochemical observations, and together will provide a more comprehensive understanding of the ocean.
Critical to this development is the involvement of private industry, and cooperative, fruitful partnerships between the scientific community and instrument developers to ensure that new technologies address observational needs in different oceanic regimes.
Shipboard and Autonomous Observations
A key scientific driver of many time series, particularly those from the JGOFS era, is the need to quantify the role of the ocean in the global carbon cycle, specifically the relationship between carbon export and biological productivity.
Carbon export is frequently modeled as a function of primary production; however, analyses of primary production and export measurements from several ocean time series programs have revealed unexpected relationships between these processes (e.g., Helmke et al., 2010; Maiti et al., 2013). This may reflect methodological issues, undersampling of both production and export in time and space, and/or incomplete understanding of the pathways catalyzing carbon transformation through the oceanic food web. In many cases, time series programs have relied on the use of14C-bicarbonate assimilation as a proxy measurement of net primary production, with export derived from sediment trap estimates of sinking particle flux. Although both of these methodological approaches have received criticism, their consistent application at time series sites continues to provide insight into factors regulating temporal variability in upper ocean biology. More recently, measurements of NCP, including several approaches amenable to autonomous sensing, have been used with increasing frequency to further constrain productivity and carbon export. Among the most popular of these approaches are those leveraging high-frequency autonomous measurements of O2or bio-optical measurements of particle concentrations in the upper ocean (Juranek and Quay, 2013;Estapa et al., 2017).
More routine integration of such measurements into existing time series programs will provide new insights into processes controlling time-varying relationships between productivity and export. Moreover, leveraging of such autonomous sensing methodologies with shipboard time series programs offers the potential for robust intercomparison across methods and new data to test our understanding of the connectivity between production and export.
Time-varying changes in plankton community structure are known to have direct influences on key ecosystem properties,
including regulating the balance between productivity and respiration (i.e., NCP), governing rates of particulate matter export from the upper ocean to the interior waters, and altering the stoichiometry of nutrient availability and supply. State-of- the-art methodologies for assessing spatiotemporal dynamics in plankton biomass and community composition generally rely on: (1) microscopic visualization for quantification of plankton abundance, size, and diversity; (2) bio-optical characterization of plankton light harvesting pigments and/or estimates of bulk particulate material from absorption and scattering of light; and (3) nucleic acid- or protein-based analyses of plankton diversity, abundances, and metabolic function. Automated instruments that can enumerate and characterize individual plankton are an important class of technologies that have demonstrated capability to advance biological and ecological time series. In some cases, existing methodologies integrate one or more of these approaches; for example, development of an imaging flow cytometer couples the identification of plankton based on pigmentation to microscopic visualization of individual cells (Olson and Sosik, 2007; Sosik and Olson, 2007). Scanning flow cytometers (Dubelaar and Gerritzen, 2000), underway flow cytometers (Swalwell et al., 2011), and imaging-in-flow cytometers (Olson and Sosik, 2007) are now producing multi- month to multi-year time series of picocyanobacteria (Sosik et al., 2003; Hunter-Cevera et al., 2016), diatoms (Sosik and Olson, 2007;Peacock et al., 2014), dinoflagellates (Campbell et al., 2010, 2013;Dugenne et al., 2014), microzooplankton (Brownlee et al., 2016), and cytometrically defined subpopulations of phytoplankton (Thyssen et al., 2008). Notably, in many cases with these approaches, genus- to species-level resolution can be achieved, along with temporal resolution of hours to days. Time series capabilities have also been demonstrated for non-cytometric imaging instruments that are especially effective at characterizing relatively large colonial and chain- forming phytoplankton, mesozooplankton, marine snow, and other particles (e.g., Scripps Plankton Camera, Underwater Vision Profiler, Continuous Particle Imaging and Classification System, various holographic camera systems – e.g.,Bochdansky et al., 2016). Such technologies are amenable to field-based deployment, permitting detailed spatiotemporal analyses of plankton community dynamics. While these technologies are providing unprecedented scales of observation, much of the focus has been on examining dynamics underlying stocks of plankton in the upper ocean. The development of new observational tools aimed at characterizing taxa that are actively contributing to export is needed to further elucidate linkages between plankton food webs and material and energy export.
Multi-frequency acoustic systems have more commonly been used in shipboard applications to help constrain distribution and biomass of zooplankton and fish but they can also be deployed via autonomous platforms (Benoit-Bird and Lawson, 2016), providing access to a broad range of spatial and temporal scales. Ship-based acoustic measurements have proven to be promising tools for estimating biomass and identifying small-scale physical features that affect nutrient availability and productivity (e.g., Lavery et al., 2010). Recent acoustic measurements of mesopelagic fish, which play a major role in
marine food webs and carbon export, suggest that previous abundances have been significantly underestimated (Irigoien et al., 2014; Davison et al., 2015). More routine incorporation of acoustic technology across different platforms in ocean time series programs represents an important opportunity to monitor the health and status of marine ecosystems and their response to climate and environmental change, including ecological and biophysical interactions (Karstensen et al., 2015), animal physiology, biodiversity, biogeographic shifts, and contributions of different trophic levels to carbon export (Benoit-Bird and Lawson, 2016).
Several OceanObs’09 reviews (e.g.,Borges et al., 2010;Byrne et al., 2010; Claustre et al., 2010) highlighted the need for new autonomous biogeochemical sensors and systems, in particular, sensors to quantify DIC and total alkalinity (TA). Either of these in situ systems, combined with available pCO2 or pH sensors, can be used to quantify the inorganic carbon system.
These measurements, e.g., on a BATS mooring, could help understand the imbalance between NCP and export production, a longstanding conundrum that highlights the challenges of ship- based time series (Michaels et al., 1994), as discussed above.
In fact, since OceanObs’09, new DIC and TA instruments have been successfully developed and their potential demonstrated with short deployments (Liu et al., 2013;Spaulding et al., 2014;
Fassbender et al., 2015; Wang et al., 2015). These instruments are not widely used, however, because of their cost, complexity, power requirements, and reagent consumption. Slow but steady improvements are being made, but the timeline from initial concept to commercialization for in situ analyzers is typically
>10 years. Public competitions such as the XPRIZE can provide the funding and community momentum needed to overcome such barriers and push the technology forward (e.g., Wendy Schmidt Ocean Health XPRIZE on pH sensor development to study ocean acidification, Okazaki et al., 2017). There is new technology similar to that used for O2 optodes that could lead to simplified inorganic carbon sensors (Clarke et al., 2015, 2017).
A variety of inexpensive and low-power infrared CO2 sensors are also now being used for marine sensing applications (Fietzek et al., 2014;Bastviken et al., 2015;Hunt et al., 2017).
There has been a striking lack of sensor technologies able to overcome the challenges inherent in automated biological sampling in the ocean. As a result, these types of data sets have lagged behind those associated with physical, and to a certain extent, biogeochemical characterization. However, advances in recent years have poised the ocean observing community to overcome this challenge (e.g., Boss et al., 2018). Sophisticated autonomous bio-analytical systems have been developed that can characterize and quantify microbial populations through automated flow cytometry (Thyssen et al., 2014;Hunter-Cevera et al., 2016) and in situ genetic analysis (McQuillan and Robidart, 2017). These instruments have revealed unexpected diel microbial cycles (Ottesen et al., 2014) and provided new insight into the timing of spring blooms (Hunter-Cevera et al., 2016), as discussed above. Advances inin situsampling and associated molecular-level characterization highlight another exciting path for future prospects that complement and extend other types of biological measurement capabilities. The Environmental Sample
Processor (ESP;Scholin et al., 2017) is a noteworthy technological advance that has already provided time series observations with applications including quantification of biologically produced toxins (Doucette et al., 2009) and use of in situhybridization to species-specific probes for sensitive detection of HAB species (Greenfield et al., 2006), zooplankton (Harvey et al., 2011), and bacteria (Robidart et al., 2012; Ussler et al., 2013). Emerging technologies and continuing developments promise to expand these applications and pave the way toward instrument systems that are smaller, require less power, and enable larger numbers of samples per deployment.
In the future, biogeochemistry and biological processes may be more intensively studied at time series sites by using multiple platforms, as is becoming commonplace in the physical oceanography community. For example, in the Salinity Processes in the Upper-ocean Regional Study (SPURS) (Lindstrom et al., 2017), sea surface salinity variability was studied by simultaneously using Eulerian (moorings) and Lagrangian (surface drifters, subsurface floats) platforms, 3- D mapping using surface and subsurface gliders and ships with a further broadscale view from satellites. Pioneering field programs such as EXport Processes in the Ocean from RemoTe Sensing (EXPORTS) (Figure 6) that extensively usein situsensor technology centered on an established time series location (in this case Ocean Station Papa in the northeast Pacific Ocean), perhaps portend a multi-platform future for marine biogeochemical time series research.
Satellite Observations
To more effectively manage marine resources (e.g., fisheries, wetland systems, coral reef systems, etc.) and assess human health risks (e.g., HABs) in densely populated coastal regions, increased spatial and temporal resolution will be necessary.
Remote sensing products have been fundamental tools for providing critical data in coastal regions and monitoring and understanding how marine ecosystems across the globe are responding to climate variability and change. Passive satellite ocean color measurements, as well as active remote sensing with Light Detection And Ranging (LiDAR), have proven to be essential for supporting science and applications related to ocean biogeochemistry and ecology. Remote sensing platforms provide some of the most fundamental global observations currently in existence, and the need for sustained space-based ocean observations has been highlighted at a global level [Schmitt, 2018;
National Academies of Sciences, Engineering, and Medicine, 2017; Committee on Earth Observation Satellites (CEOS)].
In the coming decade, new advances in passive ocean color measurements such as the hyperspectral radiometer on the Plankton, Aerosol, Cloud, ocean Ecosystem (PACE) mission will yield higher-resolution ocean color measurements that will enable diagnosis of key marine ecosystem parameters from space, such as phytoplankton community composition (Cetini´c et al., 2018). Further development of active remote sensing tools such as LiDAR for ocean applications will provide critical information on the vertical distribution of plankton, and enable measurements in areas of high cloud cover or very high latitudes, where periods of winter darkness preclude complete annual
FIGURE 6 |Schematic of EXport Processes in the Ocean from Remote Sensing (EXPORTS) sampling campaign that includes ships, moorings, floats, gliders, sediment traps, and satellite observations. EXPORTS is a large-scale NASA-led field campaign that is leveraging existing ocean time series and other ocean observing assets to provide critical information for quantifying the export and fate of upper ocean net primary production (NPP) using satellite observations and state of the art ocean technologies. Figure fromSiegel et al. (2016).
coverage of phytoplankton biomass (Behrenfeld et al., 2017).
LiDAR systems remotely measure the vertical distributions of optical properties and particles in the upper ocean. Continued development of compact LiDAR systems for deployment on ships and autonomous platforms has the potential to greatly improve the quality and scope of a variety of oceanographic investigations, as demonstrated on recent deployments on passenger ferries as part of the Gulf of Maine North Atlantic Time Series (GNATS) program (Collister et al., 2018). More routine use of this technology will greatly improve our ability to investigate the role of particles in physical and biogeochemical oceanographic processes (see alsoJamet et al., 2019).
Given the cost, infrastructure, and planning efforts involved, support for satellite missions typically happens at the national and international levels. With national science budgets either decreasing or remaining flat, it is essential that advocacy for ocean-focused, space-based missions remains high. International partnerships (e.g., CEOS) coupled with advancement of measurement technologies with planned missions remain at
the forefront of all space agencies. Leveraging the rapidly growing small satellite and CubeSat industries will also be fundamental to advancing and expanding space-based ocean observations to better meet the measurement requirements needed to address scientific priorities. Over the past decade, small satellite and CubeSat instrumentation have seen a leap forward in technological development. These platforms will continue to expand over the next decade, increasing the potential for significant advancements in Earth system research through dramatically increased observational capabilities (e.g.,Schueler and Holmes, 2016). In a review of the current state of the scientific and technological potential of CubeSats, the National Academies concluded that the technological innovation being developed through CubeSats has rendered access to space more affordable (National Academies of Sciences, Engineering, and Medicine, 2016); this in turn allows for the design of missions that could meet the observational requirements needed to study marine ecosystem structure and function, biogeochemical fluxes, phenology and biodiversity. CubeSats
and small satellites also have the capacity to achieve higher spatial resolution (submesoscale) than standard satellite systems (Schueler and Holmes, 2016). CubeSat observations can complement observations from larger spacecrafts, increasing the scientific gains of a mission and establishing satellite constellations. As with any new technology, CubeSats and small satellites will require further testing and advancement to achieve climate-quality observations. Sensor performance, stability and reliability must be carefully evaluated prior to routine and widespread deployment of these platforms. Private industry and non-traditional vendors have interest in developing these technologies as well, and partnerships with scientists should be further explored and encouraged for the benefit of all.
Integration
Time series measurements made from different platforms (e.g., ships, autonomous platforms, and satellites) collectively provide the necessary spatiotemporal breadth required to monitor and study marine ecosystem function. When multiple time series are combined, a basin-wide and even global picture of variability can emerge. To better support science and management needs and fully realize the value of ocean time series programs, it is imperative that we invest in the development of numerical tools and approaches for bringing data sets together across different sites and platforms.
Data Integration
Large spatial-scale analyses using multiple time series enable the detection and interpretation of linkages between marine ecosystem function (e.g., food web dynamics, biogeochemistry, biodiversity, etc.) and climate variability and change (e.g., O’Brien et al., 2017). However, thus far, bringing together data sets across ocean time series in support of broader synthesis product development has met obstacles such as heterogeneity in sampling frequency and methodologies, as well as variable competing objectives and levels of data access across time series programs. While observations of physical parameters and associated data processing and quality control procedures are well established, biogeochemical parameters, particularly biological and ecological measurements, are less mature (Lindstrom et al., 2012). This represents a major frontier for data integration innovation across multidisciplinary time series sites, particularly shipboard platforms, that could initially focus on the most mature EOVs in order to achieve a higher degree of intercomparability.
This is crucial for end-users who are interested in long- term marine changes such as ocean deoxygenation or ocean acidification that yield only small signal-to-noise ratios on shorter time scales. In addition, metadata reporting standards are lacking, particularly for novel technologies that are just now being integrated across time series (Lorenzoni and Benway, 2013).
An investment in data coordination across the time series community and with data management centers is needed to build a more sustainable and cost-effective data management model. Rather than investing in additional data management centers and portals, there is a much greater need for improved interoperability among existing centers that serve time series data. The community needs more opportunities (workshops,
working groups, etc.) to work together to standardize data and metadata documentation and reporting protocols across platforms and variables to improve data discoverability and intercomparability. Data management centers and data portals also need improvement, as time series data formatting is often awkward, difficult to manipulate, and not standardized even within a single time series. Carefully curated data products with user-friendly interfaces and several different output formats would significantly improve usability of time series data.
Working Across Platforms
Targeted process studies and field campaigns have recently demonstrated great success using multi-platform measurements to study bloom dynamics (Fennel et al., 2011), carbon export (Cetini´c et al., 2012;Omand et al., 2015;Siegel et al., 2016), and the role of mesoscale eddies in O2and nutrient availability (e.g., Mahadevan et al., 2012;Fiedler et al., 2016;Honda et al., 2018).
Autonomous sensors expand the observational footprint of ocean time series by capturing variability on shorter time scales.
High-frequency measurements from stationary platforms such as moorings capture episodic events that contribute significantly to annual biogeochemical budgets and net ecosystem state (Jonsson and Salisbury, 2016). Platforms such as gliders can expand the observational footprint of a ship, providing the broader context needed to understand spatial variability in key marine ecosystem characteristics. Time series sites, especially those regularly accessed by ships, serve an important role both for sensor testing and the science conducted with sensors. Nearby oceanographic facilities and research vessels make it possible to deploy sensors on various platforms and recover after short periods (e.g., using gliders). For long-term deployments on moorings or free-drifting subsurface floats, shipboard time series can provide the necessary calibration data to quality-control and interpret the more limited sensor data (Johnson et al., 2010;Plant et al., 2016). For example, shipboard biogeochemical time series stations will play a critical role for groundtruthing data from emerging mobile autonomous observation networks such as the growing BGC-Argo program (Biogeochemical-Argo Planning Group, 2016).
Satellite observations provide the broader synoptic backdrop against which we can evaluate local and regional variability and trends (e.g., O’Brien et al., 2017). Among other services, sustained in situtime series serve a critical and necessary role in the vicarious calibration of satellite sensors and validation of remote sensing products. As remote sensing platforms have grown from a small number of satellites in the early years of ocean color observations (Barale and Schlittenhardt., 1993; Hooker et al., 1993) to the current international fleet of geostationary and Earth-orbiting ocean observing satellites, climate-quality in situ time series have become increasingly indispensable for calibration and validation of land, ocean, and atmospheric remote sensing products. Because satellites measure emitted and reflected radiation from the ocean surface as proxies for physical and biogeochemical parameters,in situtime series are critical in the development, testing, and refinement of remote sensing algorithms (e.g., Zibordi et al., 2015; Silsbe et al., 2016). As the next generation of satellite missions, including NASA’s upcoming PACE mission and the Surface Biology and
Geology Designated Observable identified in the recent Decadal Survey for Earth Science (National Academies of Sciences, Engineering, and Medicine, 2018), push the boundaries of what is currently possible with remote sensing to support biological research from space, in situ time series will be even more critical for the development and validation of remote sensing algorithms and products.
Combining observations across platforms must become more routine and straightforward; this powerful multifocal approach for investigating the interplay between the different components of the ocean-atmosphere-climate system will yield improved understanding of the Earth system. Ocean measurements across scales are required to effectively identify large-scale marine ecosystem changes such as gyre expansion (Polovina et al., 2008) and changes in sea ice extent (Grebmeier et al., 2006), and evaluate their impacts on regional physics, biology, and biogeochemistry. Promoting and conducting multi-scale observations will also support improved forecasting and early warnings of public health threats such as HABs (Pitcher et al., 2010), changes in air quality, and evaluation of spatiotemporal distribution of pollutants, including aerosols and oil spills.
Time Series Network
Monitoring ocean change requires a sustained, globally distributed network of observatories that integrates shipboard, autonomous, and remote sensing platforms. There is tremendous value in community initiatives that combine data across sites, as they bring the ocean observing community together, working across individual time series programs, across nations, across disciplines, and across platforms to discuss and strategize effective solutions to challenges such as varied sampling intervals, data gaps, and developing common guidelines for data and metadata reporting. This also represents an important opportunity to build synergies among different observing networks and programs, and develop tools and numerical methods to facilitate more routine data integration.
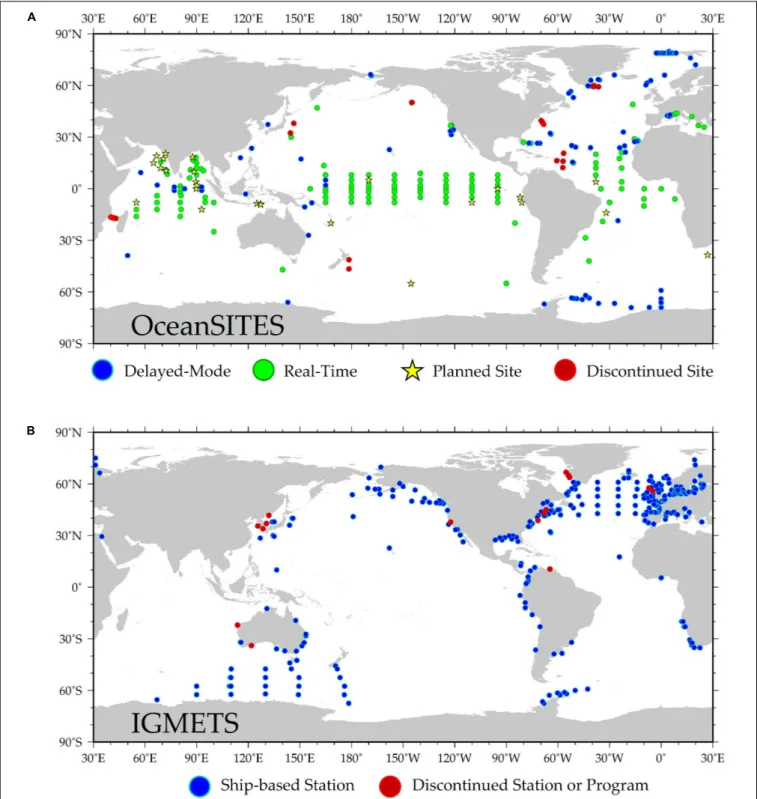
A robust network of sustained ocean time series with common core sets of observations and compatible methodologies is essential for monitoring and understanding ecosystem-related changes. For example, OceanSITES is a global network of long-term, predominantly autonomous deepwater (open-ocean) reference stations measuring dozens of variables and monitoring the full depth of the ocean, from air-sea interactions down to 5,000 m. The mission of OceanSITES is to collect, deliver, and promote the use of high-quality data from long-term, high frequency observations at fixed locations in the open ocean.
The global OceanSITES network (Figure 7A) is maintained by investigators from many countries that are collaborating to establish a global set of core oceanographic measurements being taken at OceanSITES stations. For historical reasons, this network has had a clear focus on physical parameters, but more recently, OceanSITES is starting to facilitate collection of biogeochemical measurements. Each of the moorings seeks its own support and schedules recovery and redeployment. If there was agreement among investigators on a common set of core observations and if a pool of instruments could be funded, provision of these instruments to site operators would
initiate a core measurement program. An important precedent for this was when as part of the Deep Ocean Observing Strategy1, OceanSITES took on the challenge of adding deep temperature (T)/salinity (S) time series to existing sites, raised funds to purchase a pool of deepT/Sinstruments, and now maintains a deepT/Sobserving array. Operators at many sites are willing to work with other investigators and programs to add sampling, as long as instruments meet mechanical and electrical requirements and do not compromise the existing mission of the mooring.
For example, O2 sensors have been added every other year to the Stratus surface mooring off northern Chile. Improved coordination between OceanSITES network sites and nearby or co-located shipboard time series programs (e.g., bottle samples to facilitate sensor calibration and testing) could greatly enhance the biogeochemical and biological measurement capacity of the OceanSITES network. An analogous global network does not formally exist for coastal ocean time series sites, where ecosystems typically experience a more dynamic range of variability and direct connections to, and impacts from, humans. In the United States, coordination through existing networks such as the National Association of Marine Laboratories (NAML) has been proposed as a means of developing a common scientific and logistical framework for monitoring and characterizing coastal marine ecosystems, informing management of marine resources, and providing ready access to engage and educate the public (Feller and Karl, 1996).
Fledgling efforts such as an international time series methods workshop in 2012 (Lorenzoni and Benway, 2013) provided the initial framework for a comparable global shipboard time series network that has since expanded via the work of IGMETS (O’Brien et al., 2017) to include >300 time series programs (Figure 7B). Despite their importance, several challenges have prevented shipboard time series from becoming a more formalized component of the GOOS. Shipboard data sets have primarily been used to support the goals of individual stations and ancillary projects, and apart from IGMETS, have thus far lacked a systematic effort aimed at regional to global data synthesis and development of continually updated products that are useful to the broader community, such as the Global Ocean Data Analysis Project (GLODAP) and the SOCAT. This represents an important opportunity and challenge for the ocean time series community in the coming decade. Developing a cohesive and vibrant international network of time series scientists will require high- level international coordination and leadership that is guided by a common set of objectives and a unifying framework for data collection, analysis, and reporting. This leadership body and the network that it supports will contribute to the cohesion of global time series platforms and the development of data products that address the needs of different end- users, and participate in regular activities that address key challenges such as standardizing methodological approaches to improve data intercomparability (e.g.,Lorenzoni and Benway, 2013); streamlining time series data access and developing mechanisms to incentivize data sharing (e.g., DOI assignments
1http://www.deepoceanobserving.org/
FIGURE 7 | (A)Map of predominantly autonomous ocean observing assets that make up the OceanSITES network (http://www.oceansites.org/). OceanSITES is a worldwide system of long-term, open-ocean reference stations measuring dozens of variables and monitoring the full depth of the ocean from air-sea interactions down to the seafloor.(B)Map of shipboard ocean time series programs that make up the IGMETS network (https://igmets.net/). IGMETS is an activity of
IOC-UNESCO that seeks to integrate in situ biogeochemical variables from time series stations, together with satellite-derived information, to look at holistic changes within different ocean regions.
and data reports to increase citation of data sets); building partnerships with regional stakeholders to broaden the use of time series data sets; and increasing visibility and applicability
of time series through advisory services, public outreach, and education (e.g., Milliman, 1996). Planning and investing in a regular (every 3–4 years) international time series community
science workshop or symposium, perhaps comparable to the LTER Network’s All Scientists’ Meeting, to bring together time series scientists to share new results would greatly improve scientific exchange, collaboration, and coordination across time series programs.
Broadening the Ocean Time Series End-User Community
Ocean time series data currently serve a wide range of scientists studying ocean ecology, biogeochemical cycles, as well as physical and atmospheric dynamics. To bolster continued investment in these programs, we must broaden the community of time series data end-users. These sustained observations are highly valuable assets that enable important and often transformative discoveries and directly support applied research, advisory services (e.g., ecosystem-based management and policy), education, and technology development. Facilitating an ongoing dialogue with a broader end-user community and documenting outcomes of these exchanges is necessary to optimize the regional and global knowledge gained from sustained time series measurements.
Strengthening ties to modelers, educators, and decision makers will form the basis for new networks and products to support capacity building, climate prediction, and policy, which will greatly increase the return on investment in these observing programs. To help refine and inform time series sampling efforts and identify opportunities for leveraging, add-ons, and product development, we need more effective mechanisms of collaborating and communicating with different time series data end-users. Ultimately, a robust network of sustained time series observations can be an effective avenue to facilitate collaborations between research and management communities.
Modelers and Time Series Data
Ecological processes are complex, and may involve time lags, environmental feedbacks, and complex interactions that are not easily discernible. Numerical models are important tools for synthesizing knowledge and generating and testing hypotheses, and, in particular, critical for disentangling complex dynamics and understanding large-scale processes such as energy budgets, carbon cycling, and ecosystem dynamics. Thus, it is important for time series data to be assimilated into modeling frameworks that may elucidate cause and effect scenarios not easily perceived through simple statistical analyses. Models can then be used to generate new hypotheses on underlying mechanisms, test the sensitivity of the system to perturbations, and make predictions of how a system might change in the future. In turn, time series measurements can become keystone observational datasets that enable modelers to assess the degree of confidence (or lack thereof) they have in their model’s predictions. Indeed, models are only as good as the understanding and assumptions used to build them, and they require robust datasets to calibrate and validate model dynamics. As such, many models have relied on time series observations for validating the predicted dynamics in the model. Long-term time series provide a constraint on seasonal to decadal variability in physical, biological, and chemical parameters.
Yet, despite the apparent natural symbiosis between time series and models, several hurdles prevent widespread assimilation and use of time series data in models. Foremost are the challenges of measurement consistency across time series and data discovery. Different time series were started and have evolved to address specific regional ecosystem questions.
Hence, there are discrepancies among core parameter sets being measured to study the forcings that drive regional ecosystem variability and long-term trends. Outside keystone time series such as HOT, CARIACO, and BATS, many modelers may be unaware of the range of observational programs producing time series data. Also, there is no standardization in the formatting of time series data such that post-processing (e.g., standardization and gridding) is required before models and data can be integrated. Often, formatting can change within a time series, making high-throughput post-processing challenging.
Furthermore, there are often discontinuities such that some variables are not available throughout the duration of a time series. In the case of autonomous platforms such as moorings, data sets can be complicated by successive, unmerged mooring deployments; subsurface moorings that incline in response to currents, resulting in variable observing depths; disparate sampling rates among moored instruments, etc. Finally, sampling and measurement protocols are often not standardized between time series sites (or even over the historical period of a single site), and so time-consuming (and expensive) cross-site comparisons and validation may be necessary. In response to request from modelers, moored time series should be, where possible, merged into continuous, gap-free data with common sampling intervals. Clear documentation and metadata reporting should accompany time series data to provide clarity about how variables were measured – e.g., a variable as seemingly straightforward as SST may have different meanings for different communities and disciplines (skin temperature, temperature at 1 m on the surface buoy, bulk mixed layer temperature, etc.).
Often, these challenges are tackled by individual research groups independently developing post-processing pipelines that may not be reproducible, robust or usable by others.
To facilitate increased use of time series data by the modeling community and improve communication and exchanges between observationalists and modelers, the use of shared repositories such as GitHub and services like CodeOcean can stimulate the development of community-driven, open source code for extracting, quality-controlling, and gridding time series data.
Simply creating shared post-processing scripts that can be tailored for each individual modelers’ needs will significantly decrease duplicative efforts, increase access to time series data, and ensure better validation of numerical models. Critically, experimentalists with expertise in observational methods, not numerical modelers, should be curating datasets prior to usage in models. Standardization across time series will also assist in the integration of time series data and models by creating intercomparable data products from many different regions of the globe. Finally, shared repositories will encourage the use of time series data for model validation, which will improve model quality. Targeted workshops that bring time series PIs and numerical modelers together would also be beneficial, in order to