Report No.
South Asia Human Development Sector
$Q,PSDFW(YDOXDWLRQRI6UL/DQND¶V3ROLFLHVWR,PSURYHWKH3HUIRUPDQFHRI 6FKRROVDQG3ULPDU\VFKRROVWXGHQWVWKURXJKLWV6FKRRO,PSURYHPHQWDQG 6FKRRO5HSRUW&DUG3URJUDPV
0D\2011
Discussion Paper Series
Public Disclosure AuthorizedPublic Disclosure AuthorizedPublic Disclosure AuthorizedPublic Disclosure Authorized
66069
Report No 35
South Asia: Human Development Unit
An Impact Evaluation of Sri Lanka’s Policies to Promote the Academic Performance of Primary School Students through School Improvement and Report Card Programs
May 2011
Discussion Paper Series
Discussion Papers are published to communicate the results of the World Bank’s work to the development community with the least possible delay. The typescript manuscript of this paper therefore has not been prepared in accordance with the procedures appropriate to the formally edited texts. Some sources cited in the paper may be informal documents that are not readily available.
The findings, interpretations, and conclusions expressed herein do not necessarily reflect the views of the International Bank for Reconstruction and Development / The World Bank and its affiliated organizations, or those of the Executive Directors of the World Bank or the government they represent.
The World Bank does not guarantee the accuracy of the data included in this work. The boundaries, colors, denominations, and other information shown on any map in this work do not imply any judgment on the part of the World Bank concerning the legal status of any territory or the endorsement or acceptance of such boundaries.
Table of Contents
Acknowledgements ... 1
List of Acronyms ... 2
Introduction ... 7
Section one: School-Based Management ... 7
Section Two: The Programme for School Improvement ... 10
Section Three: The Analytical Framework ... 13
Section Four: Findings and Results ... 17
Section Five: Conclusions ... 20
Section Six: Future Development of The Psi And The Srcp For School Improvement ... 21
List of Tables (in Text) Table 1: Pilot Zones of the PSI Program (2006-2007) ... 13
Table 2: Standardized Test Scores by Year and Treatment Group – Grade IV ... 15
Table 3: Grade IV Test Score and Household Education Expenditures (School-Level fixed effects estimation with clustered standard errors) ... 18
Table 4: Grade IV Teacher Variables (School level fixed effects estimation with clustered standard errors)... 19
Table 5: Grade IV Principals Management of School Needs Variables (Probit estimation with clustered standard errors) ... 19
List of Boxes Box 1: Focus Ground Discussions with Stake Holders ... 20
1
Acknowledgements
The team acknowledges with sincere gratitude the assistance of several World Bank colleagues and Sri Lankan counterparts in the preparation of this impact evaluation. In particular, Diaretou Gaye (Country Director for Sri Lanka and the Maldives), Naoko Ishii (former Country Director for Sri Lanka and the Maldives), Michal Rutkowski (Sector Director, Human Development), and Amit Dar (Education Sector Manager); a number of government officials, particularly Mr. H.M. Gunasekera (Secretary, Ministry of Education), Mr. S.U. Wijeratne (Additional Secretary, Planning and Performance Review), Mr. Hemantha Premkumara (Additional Secretary, Education Quality Development), Ms. Madura Wehella (Director, Planning), Dr. Jayantha Balasuriya (Deputy Director, Planning), Ms. Kamani Perera (Director of Social Sciences and Humanities, School Activities Branch), Mr.
Salahuddin (Deputy Director, School Activities Branch), Mr. Ariyaratane Hewage (Chairman, Finance Commission), Mr. Asoka Gunewardena (former Chairman, Finance Commission), Mr. W.H. Munasinghe, Secretary, Finance Commission, and several officials of the Finance Commission including Mr. Mahinda Gammampila, Mr. Sisira Liyanage, Mr. Phillip Senaratne and Mr. Wilfred Perera, and officials from the Provinces who were all helpful at various stages of the study. The National Education Research and Evaluation Centre of the University of Colombo undertook the surveys for the evaluation. The peer reviewers were Harry Patrinos, Lead Education Economist, HDNED, and Rajendra Joshi, Senior Education Specialist, AFTED.
The study was financed by the World Bank and the Education Program Development Fund (EPDF) of Education for All: Fast Track Initiative.
2
List of Acronyms
ESDFP Education Sector Development Framework and Programme ESDP Education Sector Development Project
GCE A/L General Certificate of Education Advanced Level GCE O/L General Certificate of Education Ordinary Level NEREC National Evaluation Research and Evaluation Centre
PSI Programme for School Improvement
SDC School Development Committee
SMT School Management Team
SRCP School Report Card Programme
UNESCO United Nations Educational, Scientific and Cultural Organization
3
Executive Summary
The Government of Sri Lanka’s Education Sector Development Framework and Programme (ESDFP) initiated a major development innovation for primary and secondary education for the period 2006-2010. Their strategy was organized around four key themes: improving equitable access to basic and secondary education; improving the quality of basic and secondary education; enhancing the economic efficiency and equity of resource allocation;
and strengthening service delivery (Ministry of Education, 2007). Under each theme there were a number of key development initiatives. Among these, the Programme for School Improvement, through which the government sought to introduce school-based management, constituted an important innovation. A smaller intervention, the School Report Card Programme, was also introduced to inform schools on their performance.
The Programme for School Improvement (PSI)
The PSI was designed to bring about radical change in the culture of schools through the establishment of management structures and the provision of training and support services in which: (a) the participation of parents and community in the work of the school was increased; and (b) the quality of student learning became a major focus. More specifically, the PSI was designed to achieve:
a) Active involvement of the school community (parents, teachers, and past pupils) in the running of the school.
b) Planned development of the school.
c) Effective utilization of resources.
d) Improved performance in curricular and co-curricular activities through cooperation between schools and communities.
e) Creation of congruence between staff training and school needs.
f) Strengthening of school-community relationships.
g) Entrusting responsibility for the school to the School Development Committee, thus ensuring accountability (Ministry of Education, 2005).
The School Report Card Programme (SRCP)
The SRCP was implemented on a relatively small scale at the same time that the PSI was introduced. The premise was that the school community—principals, teachers, parents, and students—should receive regular information on their school’s performance through a “report card” to enable schools to improve their performance, either by stimulating low-performance school communities to action, or by encouraging high-performance schools to strive even harder. The “report cards” were to be filled out by school personnel at the end of the school year and distributed to parents and School Development Committee (SDC) members. These progress reports contained basic institutional information, and some record of teacher and student performance such as average teacher/student attendance, failure and dropout rates, school pass percentages on Grades 5, General Certificate of Education Ordinary and Advanced Levels (GCE O-Level and GCE A-Level) examinations, and funds available to—
and activities of—the school’s SDC.
4
Evaluation Design
The PSI began implementation in 2006 in all schools in the eight1 selected ‘education zones’
in Sri Lanka. The SRCP was implemented on a pilot basis in selected schools in the eight zones, as well as in eight other education zones. The two initiatives were designed to allow researchers to estimate programmatic impact on students’ educational outcomes. To this end, our sample of 200 schools was divided into four sets of 50 schools each. One group consisted of schools in which the PSI was to be implemented. The second group comprised schools in which the SRCP was to be implemented, and the third group, in which both programs were to be implemented. The fourth cluster served as the “control” group of schools, in which neither program was implemented. The division of these 200 schools into the four groups was made in a purely randomized manner, which facilitates estimation of the impact of the two programs. Baseline data2 were collected in 2006 for all 200 schools before either program was implemented, and follow-up data were collected in 2008, two years after program implementation
The objective of this study was to gauge the impact of the Education Sector Development Framework and Programme’s (ESDFP) two significant interventions—the PSI and the SRCP—on the educational outcomes of Grade IV Sri Lankan students, with special emphasis on English language and Mathematics performance. It sought to further understand performance in comparison with the control group.
As per the evaluation design, our sample was divided into the above-mentioned four groupings of schools. At the commencement of the study, the students and schools in the four groups exhibited similar characteristics and learning outcome levels. It should be noted here that our research design incorporated controls for student, family background, and school characteristics in such a way that, if student learning outcomes in the different groups of schools were significantly at variance from that of the control group at the time of the final survey, this difference could be attributed to the impact of the relevant program.
Results and Findings
Overall, our findings illustrate that the schools in which the PSI was implemented performed well in terms of improving the cognitive abilities of their primary school students. This is an encouraging and positive finding. Discussions with stakeholders (education officials, school principals, teachers, parents and students) suggested that a range of processes—including better teacher and parental involvement with the children, both at school and in the home—
are likely to have contributed to this outcome.
In the local communities, stakeholders, including parents, past pupils and well-wishers, involved themselves closely with various aspects of school administration through school development committees (SDC). This presented the schools with the additional management
1 In 2006, there were only 8 provinces in Sri Lanka. Following a court decision, a 9th province came into being in 2007.
2Baseline data is basic information gathered on a program before its commencement. It is used later on to provide a comparison for assessing program impact.
5
support critical to improving the learning potential of their pupils. Additionally, the committees were proactive in resource mobilization for school development projects, over and above the funds received from provincial councils or the central government. To improve the English language skills of the children, the committees helped to build a stock of children’s books, and facilitated theater and musical events. For mathematical skills development, the committees implemented numeracy advancing games and activities with an especial focus on the fun element, important for enticing primary school children.
The formation of SDCs provided the schools with a sense of order and method. The committee’s regular meetings and continual interactions with the school management teams contributed to enhanced management of the schools, particularly with regard to the goal of promoting learning.
In poorer communities, it was observed that the parents of children also benefited from the school-community interactions. Parents imbibed the importance of facilitating activities at home to enable their children to study and learn better. For instance, they learned to set aside dedicated study time for their children. Further, it was noticed that parents whose children studied in schools that had school development committees, helped their children with learning activities more than in schools that did not have them.
The SRCP, however, was not as successful as the PSI. The results do not show a statistically significant effect of the SRCP on school performance. This may partly be due to the relatively low weight accorded to the SRCP in relation to the PSI by policy makers. The PSI was viewed as a flagship program, and was strongly supported by both the central government and provincial councils. In contrast, the SRCP was put into operation mainly for the purposes of the evaluation. Little effort was made to enable schools to use the SRCP’s mechanisms to obtain information about schools and to seek an improvement in institutional performance.
Future Development and Expansion of the PSI and the SRCP
Considerable effort and resources have been invested in recent years in the promotion of the decentralization of decision making, and in increasing parental and community involvement in the education system, through the PSI. The findings of this impact evaluation reveal that the PSI has had a positive and significant impact on increasing local community participation in school administration, the implementation of school development projects through resources raised from local communities, and the cognitive achievement levels of primary school students.
The following steps now seem appropriate to extend and consolidate the reforms supported by the PSI.
• Expand the PSI to all schools in the country.
• Consolidate PSI in schools where structures have been established, but activity is low.
This may require greater clarity in specification of roles, capacity building, and continuing personal and monetary support for schools.
• Support the development of capacity to exercise real devolution, not just decentralization or delegation. This may involve reforms to make teachers more accountable to local school communities, for such matters as school attendance.
Eventually, teacher recruitment, currently centralized, could be devolved to school level.
6
• Review regulations regarding School Development Committees and School Management Teams to establish their appropriateness for all types and sizes of school.
• Empower lower levels of governance with clearly defined functions that do not overlap with higher levels. This will involve strengthening zonal capacity through training for advisers and networking of principals.
• Particular attention should be paid to schools serving children in socioeconomically disadvantaged areas as effective governance is particularly important for the marginalized and disadvantaged. Additional funding may be required which takes account of school size, level of schooling, special education needs, location and type of school.
• Support schools in developing a parent involvement program which to date has been largely restricted to distal activities (attending meetings, involvement in school committees, engagement in voluntary work or making financial contributions to maintain or improve physical conditions, resources, and services) to one in which attention is paid to proximal activities. The program should focus on (a) developing parents’ understanding that the home environment has a profound impact on the school learning of children and that they have the power to change it; (b) developing parents’ self-confidence and sense of efficacy in establishing a home environment that will provide rich learning experiences for children; and (c) demonstrating specific behaviors that parents can use (e.g., how to interact with pupils re homework, having pupils read to them).
• Extend the involvement of communities to contribute to the development of
“competencies for life”, so-called “soft skills” or generic skills which are necessary for effective functioning in personal life, interpersonal relationships, and employment/economic activities (critical and divergent thinking, problem solving, creativity, initiative, leadership, responsibility, team work). Experience in community activities is often more relevant and appropriate in developing these skills than school- based experience which is often preoccupied with covering syllabuses and preparing students for examinations. Community activities also provide opportunities to develop social cohesion through learning to live with others in harmony, respecting the diversity of a multi-ethnic, multi-religious and multi-cultural society (see Ministry of Education, 2004b).
The School Report Card Programme
The SRCP in its present form has demonstrated little impact on school performance. This is not surprising, as it has received scant attention by policy makers. The SRCP could be revised so that the information contained in it is used by the SDCs and government authorities to improve schools. As a first step, the SDCs and local governments would need to be trained in the judicious use of school report cards. Once the SRCP is implemented as a full-fledged program, its impact could be carefully studied. It is entirely possible that mainstreaming the SRCP in the government reform program would result in positive effects at the school level.
7
Introduction
The Government of Sri Lanka’s Education Sector Development Framework and Programme (ESDFP) initiated a major development innovation for primary and secondary education for the period 2006-2010. Their strategy was organized around four key themes:
improving equitable access to basic and secondary education; improving the quality of basic and secondary education; enhancing the economic efficiency and equity of resource allocation; and strengthening service delivery (Ministry of Education, 2007). Under each theme there were a number of key development initiatives. Among these, the Programme for School Improvement, through which the government sought to introduce school-based management, constituted an important innovation. A smaller intervention, the School Report Card Programme, was also introduced to inform schools on their performance.
The World Bank supported the ESDFP through a programmatic sector-wide operation, the Education Sector Development Project (ESDP), and a range of analytical activities of key initiatives. The PSI was a central element of the World Bank’s support under the ESDP.
The World Bank undertook an impact evaluation of the PSI, as part of its analytical assistance to this program. This report presents the findings of this assessment, and comprises five sections. First, there is a concise description of school-based management.
Second, there is a discussion of the PSI and SRCP in Sri Lanka. Third, the analytical framework and results of the impact evaluation are discussed. Fourth, the findings and results of the analysis are discussed. Fifth and finally, a set of recommendations are presented for the future of the PSI and the SRCP.
Section One: School-Based Management
Rationale for School-Based Management
A variety of reasons have been posited by policy makers and practitioners in support of school-based management:
a) School-based management is democratic as it engenders power distribution between the various education partners when regulating institutional and individual behavior, and in funds allocation. When parents and community members are involved, it contributes to their empowerment
b) School-based management facilitates the recognition of, and responsiveness to, local needs. Large bureaucracies could tend to overlook peripheral needs and ignore ethnic, linguistic, and regional cultural variation, while school-based management allows local decision makers to adapt education policies to local realities and to determine the appropriate mix of inputs.
c) School-based management has the potential to lead to a more effective educational delivery and prudent use of school, local, and regional level resources. This view, in part, reflects the business concept of total quality management, according to which decisions made close to the actual product will produce better results.
Research suggests that local management is most appropriate in business organizations where the work is complex and is carried out in a continually changing environment, and where there is uncertainty in its day-to-day tasks, all of
8
which characterize the teaching-learning situation (Wohlstetter & Mohrman, 1993).
It should, for example, be possible for local actors to work more effectively than a central authority in mobilizing local resources (including from private parties) in improving inter-agency cooperation and in integrating services.
d) School-based management should lead to improved communication between stakeholders, and in facilitating principals’ awareness of teacher and parent concerns.
e) School-based management should result in greater accountability of schools and teachers to their pupils, parents, and local communities.
f) School-based management is more transparent, significantly reducing opportunities for corruption.
g) School-based management provides for group decision-making, which tends to be more considered than decisions made by individuals.
h) School-based management contributes to the development of high levels of professionalism in schools.
i) School-based management should ultimately lead to improved student retention and learning. This was not an issue in the early reforms period where school-based management was interpreted to mean political activities that transferred power and authority to individual schools over their budgets, personnel, and curriculum. This changed in the late 1990s, where overall school improvement became a major objective of school-based management initiatives.
j) Training (when provided) for parents and other stakeholders in shared decision- making, interpersonal skills, and management proficiency can benefit the community as a whole.
k) The development of school-based management is relatively inexpensive as it involves a change in locus of decision-making rather than a large increase in resources (Abu-Duhou, 1999; Caldwell, 2005; World Bank, 2006, 2007, 2008).
School-based management—and indeed, other forms of decentralization—have also been associated with a number of possible disadvantages. Notably, it can have adverse effects on equity. It may, for example, result in disparities between schools in economically advantaged and disadvantaged areas with regard to resource availability (including the capacity to manage). According to Bray (2001), “A major question for policy makers concerns ways to harness the resources and energies of prosperous communities while protecting and encouraging their less prosperous counterparts” (p.3). Within communities, better functioning families may take up opportunities to become involved in school activities, leaving the neediest even more excluded (Corter & Pelletier, 2005). Thus, it becomes imperative to monitor the impact of decentralized management on income and social groups, and to identify measures to mitigate possible adverse effects. This, in turn, points to the need for a central authority to retain its power to implement policies to discriminate in favor of areas most in want.
Secondly, there is the danger of unnecessary duplication in a decentralized system (e.g., in policy to address the special needs of students with disabilities, for instance). To get around this issue, it will be important to specify decision-making categories that are most appropriately dealt with at the national level.
Thirdly, it may take longer in a decentralized system to implement certain types of reforms and innovations. Forms of decentralization that involve intermediate tiers can create
9
problems for schools as sources of conflict multiply and bureaucracy increases (Perera, 2000).
Fourthly, school-based management is vulnerable to elite capture. For instance, aggressive and well-connected parents may make use of their influence on school boards or committees to further the interests of their own children at the expense of other children.
Characteristics of School-Based Management
School-based management systems vary on a variety of characteristics (Abu-Duhou, 1999;
Caldwell, 2002, 2005; Cheng, 1996; Hill, Smith, & Spinks, 1990; World Bank, 2006, 2007). Only the first two items outlined in the bullet points below apply to all systems.
• The school has the authority and responsibility to make decisions on one or more of the following:
a) Use, maintenance, and improvement of the school building.
b) Intended curriculum (range of subjects taught, syllabus content).
c) Implemented curriculum (methods of instruction; choice of textbooks).
d) Budget/expenditure.
e) Procurement of educational materials.
f) Management (deployment of teachers, assigning students to classes, school calendar, classroom hours).
g) Human resources (employment, remuneration, and conditions of employment of teachers and other staff); professional development.
h) Admission, suspension, and expulsion of students.
i) Monitoring and evaluation of student performance (judgment of student achievement/failure; certification of student achievement).
j) Quality assurance (supervision and evaluation of teacher performance).
k) Publication of information about a school’s performance.
• School decision-making is carried out within a centrally determined framework of goals and policies. School-level actors have to conform to, or operate within, a set of centrally determined policies and procedures.
• An internal school management group comprising the principal, teachers and, in some cases, students, is constituted either: (a) to advise the principal; or (b) to take decisions.
• Parents’ and other community members are provided with the opportunity of participating in school management, planning, and development, usually through the creation of a school council. Again, the council may: (a) advise the principal; or (b) take decisions.
• School principals and teachers are considered accountable to: (a) education authorities for adhering to policy and rules; (b) their peers for adhering to standards of instruction;
and (c) students, parents, and the general public for student achievement. There is great variation in accountability systems. In some, information on student achievement is published in league tables, and sanctions—including monetary rewards—are attached
10
to school performance. The use of monetary rewards, however, has proved controversial, and in most cases, has not lasted very long. Furthermore, rewarding successful schools at the expense of increasing resources to schools that are failing would not contribute to overall school improvement. Non-monetary rewards (working in an environment conducive to learning, seeing positive results in student learning, or responding to parent pressure) can be motivating.
• School-based management may be implemented in conjunction with other reforms. It is not unusual to regard such management as only one of several strategies designed to improve student learning.
Section Two: The Programme for School Improvement
In 2006, the Ministry of Education embarked on the Programme for School Improvement (Ministry of Education, 2007). The objective of the PSI was for schools to become increasingly empowered through strong community involvement in school management.
The PSI was designed to bring about a radical change in the culture of schools through the establishment of management structures and the provision of training and support services in which: (a) the participation of parents and community in the work of the school was increased; and (b) the quality of student learning became a major focus. More specifically, the PSI was designed to achieve:
i) Active involvement of the school community (parents, teachers, and past pupils) in the running of the school.
ii) Planned development of the school.
iii) Effective utilization of resources.
iv) Improved performance in curricular and co-curricular activities through cooperation between schools and communities.
v) Creation of congruence between staff training and school needs.
vi) Strengthening of school-community relationships.
vii) Entrusting responsibility for the school to the School Development Committee, thus ensuring accountability (Ministry of Education, 2005).
Each school was required to set up two bodies: a School Development Committee (SDC) and a School Management Team (SMT). The SDC consists of the principal (as Chair), a deputy principal, and representatives of teachers, parents, past pupils, and the Education Authority. The number of teachers, parents and past pupils varies from 3-5 members from each category, depending on the size of the school. Teachers, parents, and past pupil representatives are elected members. The SDC is expected to meet at least once a month during its three-year term of office. The committee is charged with preparing a five-year school development plan based on the Manual of Instruction for School Level Planning (Ministry of Education, 2004a) and an annual implementation plan. The school development and implementation plan should: (a) address student access and participation;
(b) focus on improving student achievement; and (c) attend to the school plant and physical resources (Ministry of Education, 2004b). Grants are provided to enable actioning on the plan activities.
11
The SDC has the power to undertake projects and make purchases (to a maximum value of Rs. 200,000). It is required to prepare an annual budget and monthly and annual financials;
operate a bank account; be responsible for the maintenance and development of the school plan; and be accountable to the relevant authorities and to the school community.
The SMT, which is established within the school, consists of all the school staff members of the SDC, the other Deputy Principals, Assistant Principals, and Sectional Heads. The SMT should work closely with the SDC and, following consultation, may appoint subcommittees. The consultation process between the SDC, which consists of selected school officials and elected stakeholders in the school, and the SMTs, which consists only of schools officials, is mediated through the principal, who chairs both the SDC and the SMT. The consultations vary by school type, and are flexible. For instance, in wealthy, educated urban communities SMTs may decide to approach the SDCs with an appeal for funds for educational activities. Or the SMTs may ask the SDCs to assist with the organization of activities such as literary festivals, theater productions, and musical and cultural events. In poorer, less educated rural communities the SMTs may approach the SDC to instruct parents on the importance of setting aside time for their children to study on a daily basis. Or, to provide labor to clean the school premises. The interactions between the SDCs and SMTs vary according to the school circumstances and the characteristics of the school stakeholders.
The PSI was launched in one zone in eight provinces in 2006. Additional zones were added in each succeeding year. By 2009, a total of 5,222 schools were participating in the scheme. Over the years, the program has evidenced a school-to-school variation in its interpretation and implementation. A high degree of program operationalizing, defined as application of the powers given by the PSI circulars, was associated with:
a) Strong commitment of the principal and other teachers to the values of the PSI.
b) Prepared school plans, and monitored implementation.
c) A wide range of extra-curricular activities provided for pupils (e.g., dance, music, sport, gardening).
d) Increased community involvement in the school.
e) Regular (monthly) meetings between teachers and parents to monitor and discuss the progress of individual pupils.
f) Regular visits to the schools by zonal and divisional officers to participate in committees, to advise on teaching methods, and to assist in development and implementation of the school plan.
g) A shift in teachers’ mindsets from inputs (e.g., resources) to the quality of student learning.
In schools in which implementation of the PSI was less successful, structures might have been established but it is highly likely these did not operate effectively to promote the initiative’s objectives. In such cases, observations in—and reports from—schools, together with limited evaluation findings (Dias, 2008; Gunasekara, et al., 2010; Kularatne, 2008) point to:
a) Inadequate commitment to, or interest in, meeting the challenges that the program had been designed to address.
b) Efforts to implement management changes are not sufficiently grounded in institutional political analysis.
12
c) Ambiguities in the responsibilities specified for different levels.
d) Inadequate funds.
e) Lack of support to schools in helping them understand the PSI messaging and how that might be translated into action in their schools. There is some evidence that this situation may arise from the inability of zonal officers, often because of lack of time, to engage in meaningful collaboration with schools.
f) Failure to connect the PSI with curriculum and instructional reforms and, in particular, with student learning outcomes.
g) Reluctance of some administrators and teachers to authorize others to take over decision-making.
h) Additional management roles and responsibilities are not always welcome in schools.
i) Lack of stakeholders’ knowledge of what school-based management is, and how it works.
j) A tradition of weak management, decision-making, and communication skills in a school.
k) Problems in getting full participation in meetings.
l) Lack of support from parents and the community.
m) Lack of a culture of accountability within a community (no one would question the actions of school teachers, for example) (see World Bank, 2007).
A variety of measures are in place to address the problems associated with low or marginal levels of implementation:
a) PSI committees have been established in all zones.
b) Technical Assistants have been appointed in all provinces to support schools.
c) Meetings have been held between Ministry officials, Zonal Officers, and Technical Assistants to review progress.
d) Training has been carried out of SDC personnel at the provincial level.
e) Schools serving pupils from disadvantaged areas that need additional support or assistance in implementing the PSI have been identified.
f) “Seed grants” have been given to “difficult” and “very difficult” schools (Ministry of Education, 2008).
The School Report Card Programme
The SRCP was implemented on a relatively small scale at the same time that the PSI was introduced. The premise was that the school community—principals, teachers, parents, and students—should receive regular information on their school’s performance through a
“report card” to enable schools to improve their performance, either by stimulating low- performance school communities to action, or by encouraging high-performance schools to strive even harder. The “report cards” were to be filled out by school personnel at the end of the school year and distributed to parents and School Development Committee (SDC) members. These progress reports contained basic institutional information, and some record of teacher and student performance such as average teacher/student attendance, failure and dropout rates, school pass percentages on Grades 5, General Certificate of Education Ordinary and Advanced Levels (GCE O-Level and GCE A-Level) examinations, and funds available to—and activities of—the school’s SDC.
13
Section Three: The Analytical Framework
The PSI began implementation in 2006 in all schools in the eight selected education zones in Sri Lanka. The SRCP was implemented on a pilot basis in selected schools in the eight zones, as well as in eight other education zones. The two initiatives were designed to allow researchers to estimate programmatic impact on students’ educational outcomes. To this end, our sample of 200 schools was divided into four sets of 50 schools each. One group consisted of schools in which the PSI was to be implemented. The second group comprised schools in which the SRCP was to be implemented, and the third group, in which both programs were to be implemented. The fourth cluster served as the “control”
group of schools, in which neither program was implemented. The division of these 200 schools into the four groups was made in a purely randomized manner, which facilitates estimation of the impact of the two programs. Baseline data were collected in 2006 for all 200 schools before either program was implemented, and follow-up data were collected in 2008, two years after program implementation. The purpose of our analysis was to estimate the impact of the PSI program and the SRCP on the educational outcomes of Sri Lankan students studying in Grade IV.
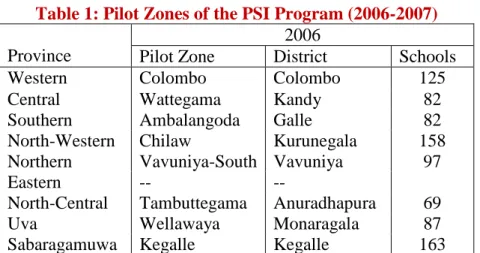
Table 1: Pilot Zones of the PSI Program (2006-2007) Province
2006
Pilot Zone District Schools
Western Colombo Colombo 125
Central Wattegama Kandy 82
Southern Ambalangoda Galle 82
North-Western Chilaw Kurunegala 158 Northern Vavuniya-South Vavuniya 97
Eastern -- --
North-Central Tambuttegama Anuradhapura 69
Uva Wellawaya Monaragala 87
Sabaragamuwa Kegalle Kegalle 163
Note: In 2006, the Northern and Eastern Provinces were merged, and the Vavuniya Zone was selected from the North-Eastern Province. In 2007, the Northern and Eastern Provinces were de-merged and set up as separate provinces. Hence, separate zones were selected from each of these provinces.
Selection of the Four Groups of Schools
This analysis is based on data from 200 schools: 50 schools in which the PSI was implemented in 2006; another 50 in which the SRCP was actioned; 50 schools in which both programs were implemented; and 50 “control” schools that were not selected for either program. This section elucidates on how all four sets of schools were chosen.
As explained above, Sri Lanka comprises nine provinces (although for a short time in 2006, two were merged, so that there were only eight provinces). Each province is further divided into districts, of which there are 25, and each district is sub-divided into education zones. There are a total of 93 education zones in the country. The research team selected one district in each of Sri Lanka’s nine provinces, and the 200 schools covered in this paper are from those districts. Within each selected district, one education zone was selected by the government in March/April 2006 to implement the PSI, and all schools in that zone implemented PSI later that year, starting around July. The baseline data, collected
14
in March 2006, were intended to reflect school outcomes at the end of the 2005 school year. Therefore, data collection was done when the Grade IV students were in the first semester of Grade V.3 Since all the schools in the selected education zones implemented the PSI in 2006, all the “control schools” had to be selected from other education zones, but always from the same district.4
In each province, the sole education zone to implement the PSI was chosen by Sri Lanka’s Ministry of Education in consultation with provincial authorities—in a somewhat ad hoc manner—perhaps due to political considerations, as opposed to random selection using standard sampling methods. After the government shortlisted the education zone in each province for implementing the PSI, between 11 to 12 schools were randomly selected for the purposes of this study from among all PSI-instituted schools in each selected zone.
This random selection of schools within education zones was done in a stratified manner;
in each zone schools were classified according to the four types of schools in Sri Lanka (see footnote 4) and in each of these four strata, schools were selected with an equal probability. The assessment team initially shortlisted 100 schools implementing the PSI from all nine provinces. This was then whittled down to 50 (see following paragraph for an explanation of how and why this was done).
100 control schools were shortlisted from the same districts, but from different education zones, as explained above. While these schools were not arrived at in a strictly random fashion, they were selected to match as closely as possible—given observable characteristics—the 100 PSI schools. More specifically, each PSI school was compared with all non-PSI schools in the same district (but in a different education zone), all with the same “level” and “race”5 characteristics. Of the non-PSI schools the one with an enrolment level closest to that of the PSI was selected as the “match.”6 Finally, 50 of the 100 PSI schools, and 50 of the 100 control schools, were randomly chosen to participate in the study.
Data Collection: 2006 and 2008
A range of information was collected in 2006 and 2008 from the 150 schools that implemented the PSI or the SRCP (or both), and from the 50 control schools. The data was derived from academic tests administered to students in grade IV of those schools, as well as to their teachers, and from a set of questionnaires that were administered to students, teachers, section heads, school principals, zone directors, and in-service advisors.7
3 Sri Lanka’s school year runs from January to December
Within each school, up to 20 students of Grade IV were randomly chosen to
4 The education zones chosen for implementing the PSI in 2007 were in different districts from the education zones chosen for the PSI in 2006, so none of the control zones chosen in 2006 were selected for the PSI in 2007. Similarly, 16 additional zones implemented the PSI in 2008, and another 8 did so in 2009, but none of these 24 zones are the control zones selected in 2006.
5 All Sri Lankan primary and secondary schools are divided into four types: 1AB, 1C, 2 and 3. Type 1AB schools teach Grades I- XIII and offer all three curriculum streams (arts, commerce, and science). Type 1C schools also teach Grades I-XIII but offer only two streams (arts and commerce). Type 2 schools offer only Grades I-XI, and small Type 3 schools offer only Grades I-V or I-VIII. There are five types of school “levels”: very congenial, congenial, uncongenial, difficult, and very difficult. Finally, there are three race
“categories” in Sri Lanka: Singhalese, Tamil, and Muslim.
6 All “national” and “Divisional Secretariat Division” (DSD) schools were excluded from the sample because the Ministry of Education decided to implement the PSI in all national and DSD schools. Therefore, there is no control group for those schools.
National schools, which make up about 3% of Sri Lanka’s schools, are run directly by the national government, while provincial governments run other schools. DSD schools comprise another 3% of schools that have recently been designated by the central government for a major improvement in their physical quality.
7 In Sri Lanka, about half of the schools are in effect combinations of primary and secondary schools, and so have Grades from I- XIII. These schools have one Principal, but are also divided into primary and secondary “sections”, each of which has a “section head.”
Education zones also have in-service advisors (school inspectors), who visit schools to supervise and provide support for teachers.
15
take the exams and complete the questionnaires; if a school had less than 20 students, all pupils were made to participate in the study.
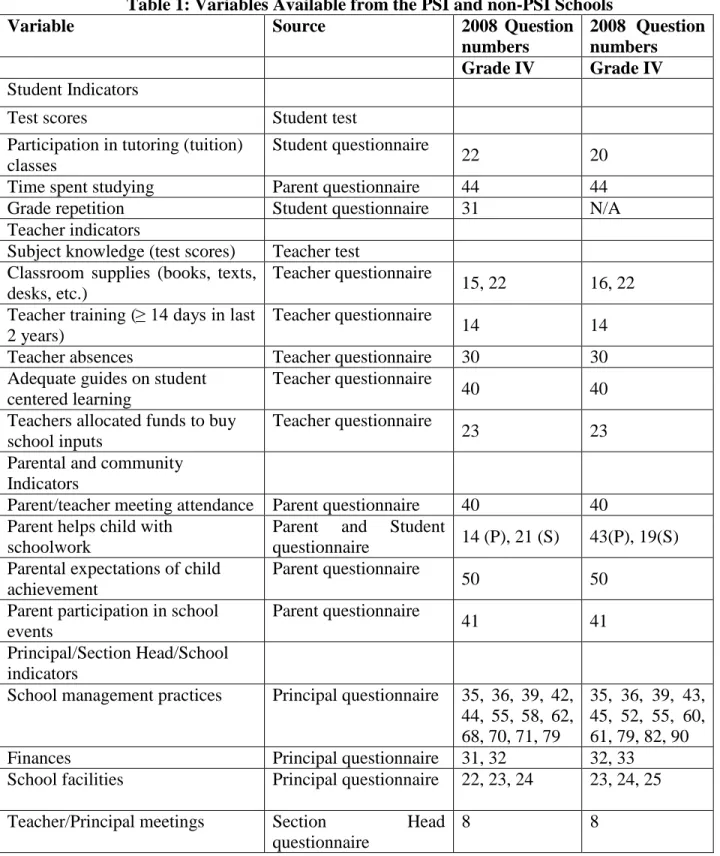
Table A1 in Annex One summarizes the type of information available from these 200 schools. The variables shown in that table are those that are most directly related to learning and academic performance. Table A2 in Annex One compares the descriptive statistics of the main explanatory variables among child and teacher characteristics.
According to the information in Table A2, the four samples were statistically insignificantly different from zero for these key variables at the time the study commenced.
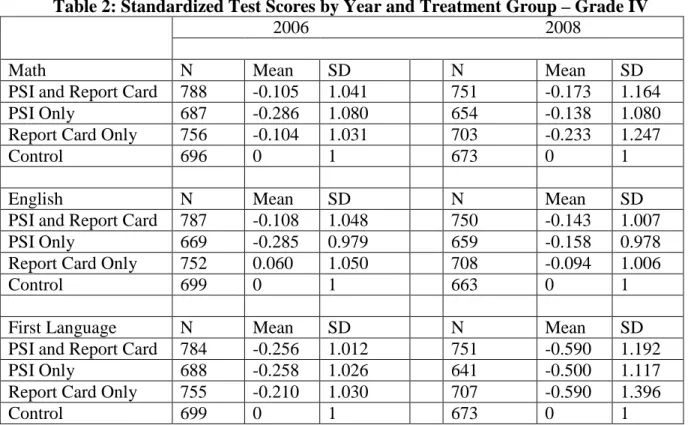
The students were administered two tests, and the study was able to gather a significant amount of data on student characteristics. In the first test, the fourth graders were administered academic tests of their skills in English and Mathematics. These were administered in March 2006 (when the Grade IV students were in the first semester of Grade V), and for a new set of Grade IV students in October 2008 (again, the students were tested after they had entered the next grade.) The tests were designed by the University of Colombo’s National Education Research and Evaluation Centre. For each grade and each year, the test scores for each student were standardized by subtracting the mean, and then dividing by the standard deviation of the control group. Thus, the control group test scores have a mean zero and standard deviation of one for each subject, grade, and year. Table 2 shows the average test scores, by year and treatment group.
Table 2: Standardized Test Scores by Year and Treatment Group – Grade IV
2006 2008
Math N Mean SD N Mean SD
PSI and Report Card 788 -0.105 1.041 751 -0.173 1.164
PSI Only 687 -0.286 1.080 654 -0.138 1.080
Report Card Only 756 -0.104 1.031 703 -0.233 1.247
Control 696 0 1 673 0 1
English N Mean SD N Mean SD
PSI and Report Card 787 -0.108 1.048 750 -0.143 1.007
PSI Only 669 -0.285 0.979 659 -0.158 0.978
Report Card Only 752 0.060 1.050 708 -0.094 1.006
Control 699 0 1 663 0 1
First Language N Mean SD N Mean SD
PSI and Report Card 784 -0.256 1.012 751 -0.590 1.192
PSI Only 688 -0.258 1.026 641 -0.500 1.117
Report Card Only 755 -0.210 1.030 707 -0.590 1.396
Control 699 0 1 673 0 1
Note: The sample is restricted to include only those schools that were in both rounds of data collection.
The teacher questionnaire collects information on each teacher’s personal characteristics (age; sex; living accommodation; distance from, and commuting time to, school;
education; and work experience), the teacher’s classroom (materials received; sufficiency of supplies; and number of students), support provided by education administrators,
16
teaching methods used, and teachers’ opinions on the official syllabus and curriculum. In 2006, two Grade IV teachers were surveyed from each school—the class teacher and the English teacher. The data was averaged across all surveyed teachers in each school. In 2008, only the class teacher was surveyed. The key teacher variables used in the analysis are summarized in Table A2 of Annex One.
Additional information on students is available from the student and parent questionnaires.
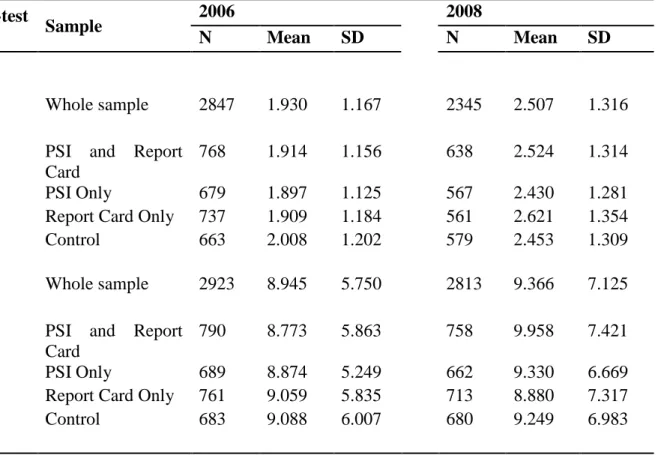
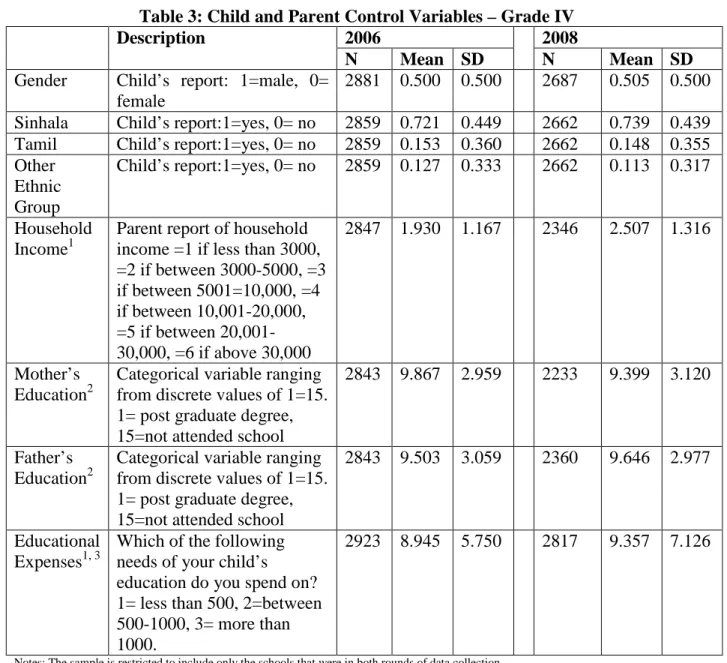
The student questionnaire collates basic demographic information (age, sex, ethnicity, religion, number of siblings), language(s) spoken at home, food availability at home, transportation mode and travel time to school, availability of a desk and chair at school, accessibility of textbooks, workbooks and exercise books at school (English, First Language, Math, and Science), attitudes about school, time spent doing various activities at home (watching TV, listening to the radio, reading), and whether any grades were repeated. The parent questionnaire collects basic demographic information on both parents, some description of the home (type of building, ownership, utilities, and ownership of durable goods), educational levels of parents and of the child’s siblings, parents’ occupation, household income, spending on educational items for the child, availability of reading materials in the home, time spent by the child in various activities, parent participation at school and helping child with schoolwork, student participation in tuition (tutoring) classes, and educational aspirations for their child. In 2006, one parent for each student was surveyed. In 2008, data was collected from both parents, although in many cases, only one parent responded. Table A3 in Annex One describes the key variables used in the regression analysis, including control variables for student gender and race, parent’s educational level, and household income and expenditures on the child’s education across the sample for the two years.
The principal’s questionnaire also begins by requesting personal information, followed by questions on the teaching staff, school facilities, financial resources, opinions on various education issues, management training and practices, the activities and composition of the SDC,8 and some information on student performance on recent national tests. Table A4 in Annex One describes several groups of variables used in the regression analysis below including the principal’s management of teachers, the principal’s plans and assessment of school needs, and the funding received by different sources for the school.
The questionnaire for section heads also gathers personal information, and inquires about facilities and teaching supplies, pedagogical practices, methods to evaluate teachers, satisfaction with the current teachers, and opinions on new educational policies, the current curriculum and other matters pertaining to schooling. Data were also collected from an in- service advisor and zonal education director. Finally, teacher tests were administered to teachers in 2006 and 2008. These were designed by NEREC. This data is not currently used in the regression analysis below, and a full description is omitted for the sake of brevity.
8 School Development Committees (SDCs) are headed by the principal and include members of the teaching staff and other stakeholders in the educational system, such as parents. SDCs are dominated by the principal, while school management committees spread power more evenly between the Principal, teachers and local communities.
17
Section Four: Findings and Results
The analysis framework is described in detail in Annex Two of this report. The sample was divided into four groups: a) the control group school, in which neither the PSI or the SRCP had been initiated by the government; b) PSI-implemented schools; c) schools running the SRCP; and d) schools in which both the PSI and the SRCP were actioned. The impact analysis sought to understand whether, over time, students benefited from the educational reform initiatives instituted by the two government programs (PSI and SRCP) in their schools. Specifically, the study aimed to assess whether the students exhibited improved Mathematics and English language performance, when compared to the control group.
The study also controls for student, family background and school characteristics in such a way that, if student learning outcomes in the various groups of schools are significantly different from that of the control group at the time of the final survey, this difference can be attributed to the impact of the relevant program(s).
At the commencement of the study, the students and schools in the four groups displayed similar characteristics and learning outcome levels.
Results
This section presents estimates for a variety of outcome variables of interest. The first subsection examines student and household-level variables, beginning with students’ test scores, while the second subsection examines the impact of the PSI and the SRCP on school-level variables.
The regression results reveal several interesting findings:
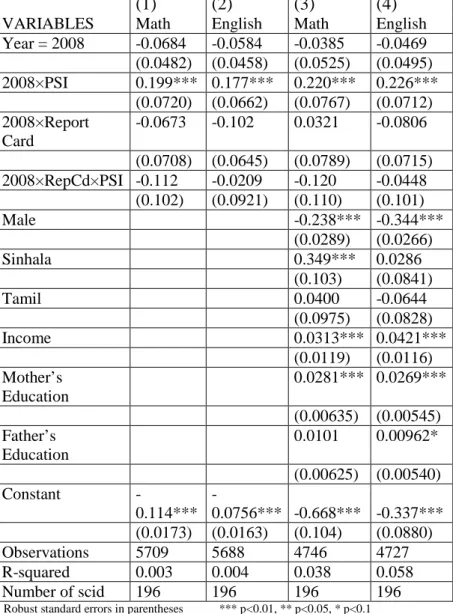
a) Student and Household Variables. Table 3 presents estimates of the impact of the PSI and the SRCP on student and household outcomes of interest for Grade IV students. Columns 1-2 examine the impact of those programs on Math and English test scores. The findings reveal that students from schools that implemented the PSI alone score significantly higher in both subjects. These scores increase by 0.20 and 0.18 standard deviations, respectively, among students from the PSI schools.
However, the schools that implemented the SRCP alone display impacts that are not statistically significant. Finally, schools that implemented both programs had impacts that were not statistically significant.
18
Table 3: Grade IV Test Score and Household Education Expenditures (School- Level fixed effects estimation with clustered standard errors)
(1) (2) (3) (4)
VARIABLES Math English Math English
Year = 2008 -0.0684 -0.0584 -0.0385 -0.0469 (0.0482) (0.0458) (0.0525) (0.0495) 2008×PSI 0.199*** 0.177*** 0.220*** 0.226***
(0.0720) (0.0662) (0.0767) (0.0712) 2008×Report
Card
-0.0673 -0.102 0.0321 -0.0806 (0.0708) (0.0645) (0.0789) (0.0715) 2008×RepCd×PSI -0.112 -0.0209 -0.120 -0.0448
(0.102) (0.0921) (0.110) (0.101)
Male -0.238*** -0.344***
(0.0289) (0.0266)
Sinhala 0.349*** 0.0286
(0.103) (0.0841)
Tamil 0.0400 -0.0644
(0.0975) (0.0828)
Income 0.0313*** 0.0421***
(0.0119) (0.0116) Mother’s
Education
0.0281*** 0.0269***
(0.00635) (0.00545) Father’s
Education
0.0101 0.00962*
(0.00625) (0.00540)
Constant -
0.114***
-
0.0756*** -0.668*** -0.337***
(0.0173) (0.0163) (0.104) (0.0880)
Observations 5709 5688 4746 4727
R-squared 0.003 0.004 0.038 0.058
Number of scid 196 196 196 196
Robust standard errors in parentheses *** p<0.01, ** p<0.05, * p<0.1
The regressions in columns 3-4 in Table 3 repeat those in columns 1-2, except that additional explanatory variables are added. To the extent that adoption of the program is correlated with these additional variables, this will reduce bias in the double difference results. In addition, adding variables with high explanatory power may reduce the standard errors of the estimated program effects, leading to further precise estimation. However, the sample size drops by almost 20% when these variables are added (due to missing data on these variables), and this reduction in sample size offsets any increased precision from adding these variables. In fact, the estimated impact of the programs is largely the same when these variables are added, viz: the PSI program increases Math and English language scores. Overall, the estimates in Table 10 suggest that the PSI has significantly increased Math and English test scores among Grade IV students.
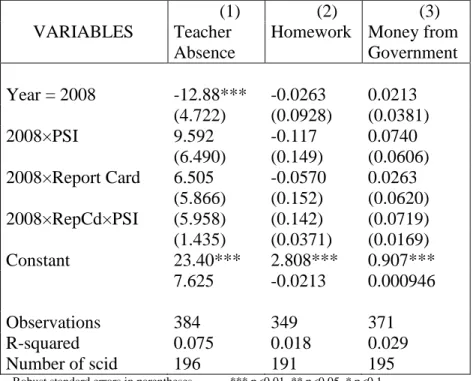
b) School Variables. Tables 4-5 examine the impact of the PSI and SRCP programs on school-level variables. Table 4 begins by examining Grade IV teacher behavior variables. Neither program, nor the combination of both programs, had any impact on teacher absences, homework assignments, or teachers’ perception of whether