Report No. 61
South Asia Human Development Sector
Transforming Primary Education in Sri Lanka:
From a 'Subject' of Education to a 'Stage' of Education
July 2013
Discussion Paper Series
Public Disclosure AuthorizedPublic Disclosure AuthorizedPublic Disclosure AuthorizedPublic Disclosure Authorized
80316
Report No. 61
South Asia: Human Development Unit
Transforming Primary Education in Sri Lanka:
From a ‘Subject’ of Education to a ‘Stage’ of Education
July 2013
Discussion Papers are published to communicate the results of the World Bank’s work to the development community with the least possible delay. The typescript manuscript of this paper therefore has not been prepared in accordance with the procedures appropriate to the formally edited texts. Some sources cited in the paper may be informal documents that are not readily available.
The findings, interpretations, and conclusions expressed herein do not necessarily reflect the views of the International Bank for Reconstruction and Development/ The World Bank and its affiliated organizations, or those of the Executive Directors of the World Bank or the governments they represent.
The World Bank does not guarantee the accuracy of the data included in this work. The boundaries, colors, denominations, and other information shown on any map in this work do not imply any judgment on the part of The World Bank concerning the legal status of any territory or the endorsement or acceptance of such boundaries.
i
Table of Contents
Authors ... iii
Acknowledgements ... iv
1. Current Context ... 1
1.1 Current Structure of Primary Education ... 1
2. The Legacy of Overgrown Elementary Schools ... 3
3. Characteristics of Schools that Offer Primary Education ... 4
4. The Primary Education Curriculum ... 7
5. Student Achievement in the Primary Stage of Education ... 9
6. Primary Education Teachers ... 11
6.1 Initial Training for Serving Teachers ... 11
6.2 Pre-Service Initial Training ... 14
6.3 Continuous Professional Development ... 15
7. Professional Support for Curriculum, Pedagogy and Assessment... 16
8. Primary Education as a ‘Subject’ of Education ... 17
9. Challenges in Primary Education ... 19
9.1 Pedagogy and Curriculum ... 19
9.2 Teacher Training ... 20
9.3 Principals ... 20
9.4 School Infrastructure ... 20
9.5 Planning, Management, Finance and Administration ... 20
10. The Benefits of Treating Primary Education as a Separate Stage of Education ... 22
11. How Do Other Countries Organize Primary Education? ... 24
12. Implications ... 28
12.1 The Current National Plan for Primary Education ... 28
12.2 Teacher Education ... 28
12.3 Separate Primary Schools ... 30
12.4 Resource Allocation and Accountability Systems ... 31
12.5 Reviews and Research ... 32
13. Conclusion ... 35
Appendix ... 36
References ... 39
ii
List of Tables
Table 1 Student Enrolment by Stage of Education 2010 ... 2
Table 2 Government Schools by Grade Span, 1997, 2007, 2010 ... 2
Table 3 Distribution of Schools by Type, Control, Province, Students and Teachers ... 5
Table 4 Distribution of Schools by Type and by Size of Student Population ... 6
Table 5 National Assessments of Learning Outcomes, Grade 4, by Province ... 9
Table 6 Teachers in Government Schools by Stage of Teaching and Highest Level of Educational Qualification ... 13
Table 7 Teachers in Government Schools by Stage of Teaching and Highest Level of Professional Qualification ... 13
List of Figures Figure 1 Primary Curriculum Framework ... 8
Figure 2 Primary Education Systems Compared ... 26
Figure 3 The National Strategic Plan for Education, 2012-2016 ... 29
List of Boxes Box 1 The Historical Legacy of Overgrown Elementary Schools ... 3
iii Authors
This paper was prepared by Angela W Little Emeritus Professor
Institute of Education, University of London, UK
The co-Team Leaders for the task were
Harsha Aturupane,
Lead Education Specialist, the World Bank and
Mari Shojo,
Education Specialist, the World Bank
iv
Acknowledgements
The suggestions and contributions of the following are acknowledged with gratitude: Manel Gunasinghe Assistant Director of Primary Education, Ministry of Education; James Jennings, Regional Education Adviser for South Asia, AusAID; Ulf Metzger, former GIZ Senior Adviser to the Ministry of Education; Asoka Pandithasekere, Director of Primary Education, Ministry of Education; the late Wilfred Perera, former Deputy Director of the National Institute of Education; K.Sarathchandra, Director Primary Education, National Institute of Education;
Muthu Sivagnanam, former Director of Primary Education, Ministry of Education; Manjula Vithanapathirana, Associate Professor, University of Colombo; and Madura Wehella, Director of Planning, Ministry of Education. We are also grateful for feedback from a number of colleagues from the Ministry of Education, the National Institute of Education and Development Partners who participated in seminars given at the Ministry of Education in 2012 and 2013.
The study was financed by the World Bank and AusAID.
1
1. Current Context
Sri Lanka is a lower-middle income country with a per capita income of approximately US$
2,400, and a population of around 20 million people. Basic human development levels are high, with a literacy rate of 93 percent, and life expectancy of 75 years. The country has approximately 4 million children of school age, about 215,000 teachers, and around 10,000 schools. Policy makers are seeking to accelerate economic growth and enable Sri Lanka to become a high-middle income country. In principle the education system is also expected to make a significant contribution to social cohesion and peace on the one hand and social equity on the other.
Sri Lanka’s high rate of literacy is due to its sustained growth through the twentieth century. In the early twentieth century the adult literacy rate in Sri Lanka (then Ceylon) was 26 percent. By 1950 this had more doubled to 65 percent, had reached 87 percent by 1981 and was 93 percent by the early twenty first century1 (Little, 2000, 2010, Aturupane, 2009). Between 1970 and 1990 Sri Lanka’s achievements in education, especially its universalisation of primary education, were celebrated in development circles, as were her achievements on other human development indicators such life expectancy, infant mortality and fertility which in turn are correlated with increases in literacy (World Bank, 2011).
1.1 Current Structure of Primary Education
The current structure of general education is divided into five stages 5 + 4 + 2 + 2. Primary education spans the first five grades of schooling, Grades 1-5. Students progress automatically to lower secondary education for four years of education in Grades 6 - 9 and then on to upper secondary education in Grades 10-11 for a two year course that culminates in the General Certificate of Education Ordinary level examination (GCE O-L). Subject to performance in the GCE O level exam they proceed to Advanced secondary education in Grades 12-13 and the GCE Advanced Level examination. At the end of Grade 5 there is an examination sat by the majority of children. This is used by the high status National schools to allocate places and modest financial bursaries for poor children.
The vast majority of all school children, some 3.9 million, or 93 percent, attend government schools. Private schools registered with the Ministry of Education account for 117, 362 children in 2010, Pirivenas (religious schools) a further 62, 091 students and an estimated 100,000 attend
‘International’ schools not registered with the Ministry (MOE 2010, MOE 2011). The vast majority follow their primary education in one of the vernacular languages, either Sinhala or Tamil, and boys and girls are schooled together.
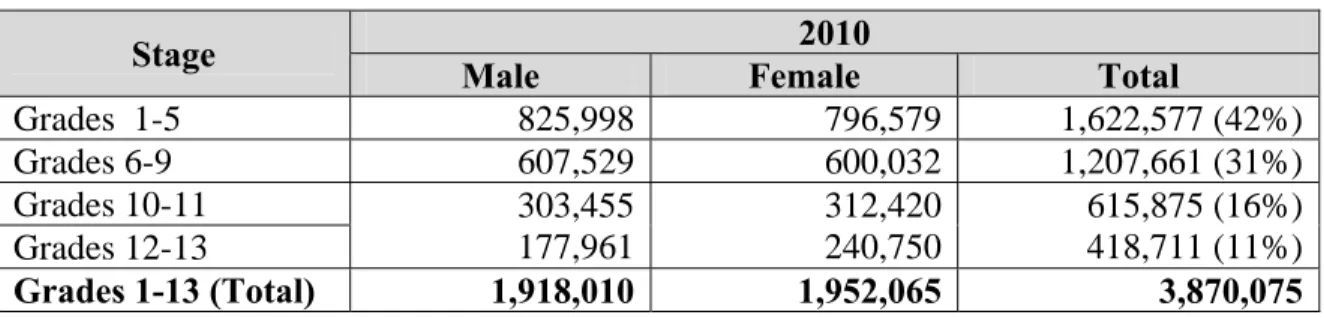
Table 1 shows the numbers of students enrolled in government schools in 2010. Of the total enrolled across Grades 1-13, 42 percent are enrolled in the primary stage.
1 Adult literacy 93 percent in 2006.
2
Table 1 Student Enrolment by Stage of Education 2010
Stage 2010
Male Female Total
Grades 1-5 825,998 796,579 1,622,577 (42%)
Grades 6-9 607,529 600,032 1,207,661 (31%)
Grades 10-11 303,455
177,961
312,420 240,750
615,875 (16%) 418,711 (11%) Grades 12-13
Grades 1-13 (Total) 1,918,010 1,952,065 3,870,075
Source: MOE, 2010.
The 5 + 4 + 2 + 2 stage structure of schooling belies its institutional organisation. Unusually, by international standards, the stage of primary education is offered by almost every school in the country. Table 2 shows the number of government schools by grade span for 1997, 2007 and 2010.
About a quarter of schools in 1997, 2007 and 2011 offered only primary education. In 2010, 70 percent of schools offering secondary education also offered primary education. Less than 4 percent of schools offered only secondary education. In other words primary education is offered in over 96 percent of all schools and the majority of primary education is provided in ‘all
through’ schools from Grades 1-11 or 1-13.
Table 2 Government Schools by Grade Span, 1997, 2007, 2010
Grade span Total
1997 2007 2010
Grade 1-5 2809 (28%) 2449 (25%) 2508 (26%)
Grade 1-8 1191 461 362
Grade 1-11 3799 4178 4069
Grade 1-13 1954 2268 2375
Grade 6-11 31 26 22
Grade 6-13 336 296 349
Total 10120 9678 9685
% schools offering Grade
1-5 96.3% 96.7% 96.1%
Sources: MOE School Census 1997, 2007, 2010.
3
2. The Legacy of Overgrown Elementary Schools
The reasons for this unusual way of organising primary education are historical. Box 1 presents a brief historical overview of the structure of primary and secondary and the emergence of what the Macleod Committee, reporting a hundred years ago in 1912, termed ‘overgrown’ elementary schools.
Box 1 The Historical Legacy of Overgrown Elementary Schools
In the early nineteenth century the British rehabilitated the Dutch network of parish primary schools offering Sinhala or Tamil medium education to Grade 5 or 6. They also established a high status network of schools offering schooling in the English medium to high caste Sinhala, Tamil and Dutch Burgher boys. The network comprised preparatory feeder schools and one post primary institution, the Academy. By the mid nineteenth century the religious missions and private bodies entered the education arena, encouraged by the colonial government to establish schools with a ‘grant-in-aid’..The level of grant was determined by student performance and by the type of school. By 1870 there were three types of primary school -
‘English’ schools teaching through the medium of English, ‘Anglo-Vernacular’ schools, teaching most subjects through the vernacular with English reading and writing, and
‘Vernacular’ schools, teaching all subjects in either Sinhala or Tamil. The grant-in-aid contributed to the expansion of education in the last quarter of the nineteenth century, and in particular to the expansion of vernacular primary schools.
By the early twentieth century a number of the English-medium schools were extending their grades to enable promising students to sit the prestigious Cambridge examinations. In the words of the Macleod Committee, reporting in 1912, they had become ‘overgrown’ elementary schools. The committee recommended a division of schools into four types (i) the purely elementary (or primary) school; (ii) the elementary school with a secondary department to junior standard (iii) the elementary school with a secondary department to senior standard; and (iv) the fully organised secondary school. In 1929 there was a recommendation that schools be divided into primary, junior secondary and senior secondary schools. Curiously the definition of each reflected the exit rather than the entry grade. Primary terminated at Standard 5, junior secondary at Standard 8 and senior secondary at a Standard higher than 8. Then as now, many senior secondary schools contained Standards 1-5. By the 1940s the Central Schools, offering high quality English-medium fully organised secondary education, were established with selection to them based on performance in the Grade 5 examination. With their establishment it was hoped that the expense of running small secondary classes in nearly every school would be eliminated. This did not happen since access to the Central schools was selective and the social demand for post primary education was strong (Jayasuriya. 1979, 256-7, 439)
Throughout the 1940s and 1950s attempts to separate the primary and post primary grades failed.
In 1962 the National Education Commission recommended that primary schools be replaced by elementary schools spanning 5 -14 years. But still the upgrading did not stop. Elementary schools sought to upgrade themselves to schools offering 10, 11, 12 and 13 years of education. In the mid 1970s the primary school curriculum was revised and a small number of ‘model’
4
primary schools were established in Colombo. For a few years these offered primary education of high quality. But as children approached the end of the primary stage, parents exerted pressure to have these schools upgraded, obviating the necessity for their children to sit the competitive Grade 5 scholarship examination for entry to other schools. By the 1990s all these model primary schools had become large and flourishing schools offering education from Grades 1 to 13. Today the primary stage of education is offered by almost every school on the island.
The tradition of describing schools in terms of the student exit point rather than student entry and exit points continues to the present day. Currently, schools are classified into four types as follows:
1AB: Senior Secondary Schools with classes to Grade 13 offering GCE (OL) and (AL) subjects in the Arts, Commerce and Science streams
1C: Senior Secondary Schools with Grades 13 offering GCE (OL) and GCE (AL) subjects in the Arts and Commerce streams
Type 2: Secondary schools with classes from Grade 11 offering GCE (OL) Type 3: Primary schools to Grade 5 (and sometimes to Grade 8)
Type 1AB and 1C schools offer education to Grade 13, in all streams and arts and commerce streams respectively. Type 2 schools offer education to Grade11 while Type 3 schools offer education to Grade 5. However, Grade 1-5 primary education if offered in all four types. Schools are further classified in terms of their controlling authority. National schools fall under the purview of the National Ministry of Education. Provincial schools fall under the purview of the Provincial Ministries and the Provincial Departments of Education. National schools are generally of higher status than provincial schools. In principle entry to Grade 1 is determined by place of residence. Students can enter at Grade 6 based on place of residence or on performance in the Grade 5 scholarship examination.
3. Characteristics of Schools that Offer Primary Education
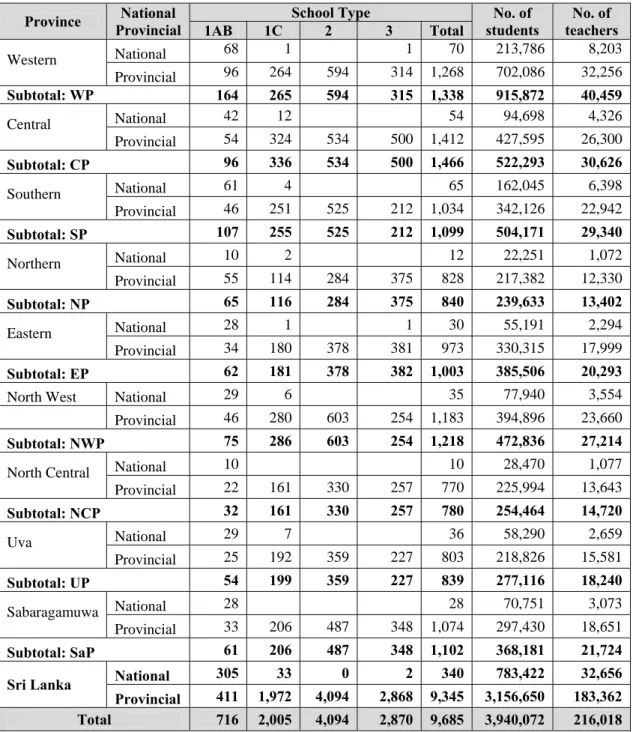
Table 3 shows the distribution of schools by national and provincial control in each province and their types. The majority of schools, 96.4 percent, fall under the purview of the nine provinces and 3.6 percent fall under the National Ministry of Education. The Western, Southern and Uva provinces have the highest proportion of national schools and those of the North and North- Central the lowest.
Type 3 schools are self-contained primary schools. To progress to Grade 6 students must transfer to another school. The greatest concentration of Type 3 schools is found in the rural provinces of Central, Northern, Eastern, North Central and Sabaragamuwa.
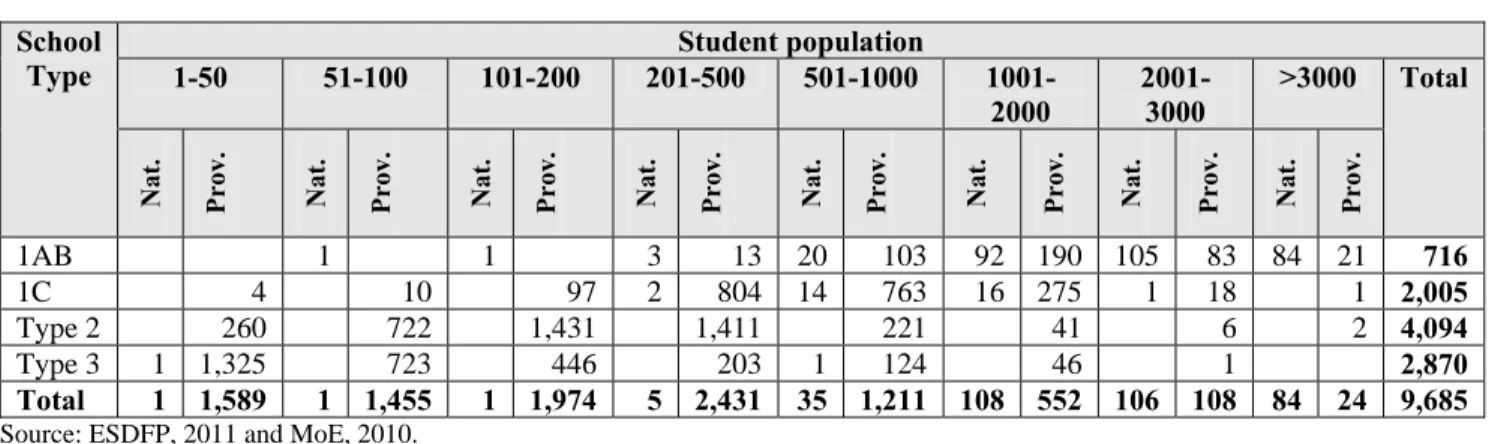
Because they offer only Grades 1-5 Type 3 schools are also small. However some Type 2 schools also have very small enrolments. Table 4 shows the distribution across the country of student populations by school type. Almost one third (31.4%) of all schools have enrolments of less than 100 students, of which more than half (52.2%) enrol less than 50 students. The majority of schools with enrolments of less than 50, some 83.4 percent, are Type 3 schools. About equal numbers of Type 2 and Type 3 schools have enrolments of 51-100.
5
Table 3 Distribution of Schools by Type, Control, Province, Students and Teachers
Province National
Provincial School Type No. of
students No. of teachers
1AB 1C 2 3 Total
Western
National 68 1 1 70 213,786 8,203
Provincial 96 264 594 314 1,268 702,086 32,256
Subtotal: WP 164 265 594 315 1,338 915,872 40,459
Central
National 42 12 54 94,698 4,326
Provincial 54 324 534 500 1,412 427,595 26,300
Subtotal: CP 96 336 534 500 1,466 522,293 30,626
Southern
National 61 4 65 162,045 6,398
Provincial 46 251 525 212 1,034 342,126 22,942
Subtotal: SP 107 255 525 212 1,099 504,171 29,340
Northern
National 10 2 12 22,251 1,072
Provincial 55 114 284 375 828 217,382 12,330
Subtotal: NP 65 116 284 375 840 239,633 13,402
Eastern
National 28 1 1 30 55,191 2,294
Provincial 34 180 378 381 973 330,315 17,999
Subtotal: EP 62 181 378 382 1,003 385,506 20,293
North West National 29 6 35 77,940 3,554
Provincial 46 280 603 254 1,183 394,896 23,660
Subtotal: NWP 75 286 603 254 1,218 472,836 27,214
North Central
National 10 10 28,470 1,077
Provincial 22 161 330 257 770 225,994 13,643
Subtotal: NCP 32 161 330 257 780 254,464 14,720
Uva
National 29 7 36 58,290 2,659
Provincial 25 192 359 227 803 218,826 15,581
Subtotal: UP 54 199 359 227 839 277,116 18,240
Sabaragamuwa
National 28 28 70,751 3,073
Provincial 33 206 487 348 1,074 297,430 18,651
Subtotal: SaP 61 206 487 348 1,102 368,181 21,724
Sri Lanka National 305 33 0 2 340 783,422 32,656
Provincial 411 1,972 4,094 2,868 9,345 3,156,650 183,362 Total 716 2,005 4,094 2,870 9,685 3,940,072 216,018 Source: ESDFP, 2011 based on MoE, 2010 school census.
At the opposite extreme of size of student population, 322 schools (3.3%) enrol more than 2000 students. Eight of these are Type 2 and Type 3 schools, while the majority, 313, are of Type 1AB.
6
Nationally, the cohort of children aged 5+ is declining and in many of the smallest schools, the numbers admitted annually to Grade 1 are few. The total number of children entering government schools in 2010 was 331,992. There were no new admissions to Grade 1 in 2010 in 306 schools. In a further 1,054 schools the number of new admissions was between one and five.
Given that the average student-teacher ratio (STR) at primary is 25:1 it is of note that just over half of all schools (53%) with provision for Grade 1 admitted fewer than 20 students (MOE, 2010). This means that there is a wide variation in the class STRs in the earliest years of primary students. There are self-contained Grade 1 classes of varying sizes, some very small and some large.
Table 4 Distribution of Schools by Type and by Size of Student Population
School
Type Student population
1-50 51-100 101-200 201-500 501-1000 1001-
2000 2001-
3000 >3000 Total
Nat. Prov. Nat. Prov. Nat. Prov. Nat. Prov. Nat. Prov. Nat. Prov. Nat. Prov. Nat. Prov.
1AB 1 1 3 13 20 103 92 190 105 83 84 21 716
1C 4 10 97 2 804 14 763 16 275 1 18 1 2,005
Type 2 260 722 1,431 1,411 221 41 6 2 4,094
Type 3 1 1,325 723 446 203 1 124 46 1 2,870
Total 1 1,589 1 1,455 1 1,974 5 2,431 35 1,211 108 552 106 108 84 24 9,685 Source: ESDFP, 2011 and MoE, 2010.
7
4. The Primary Education Curriculum
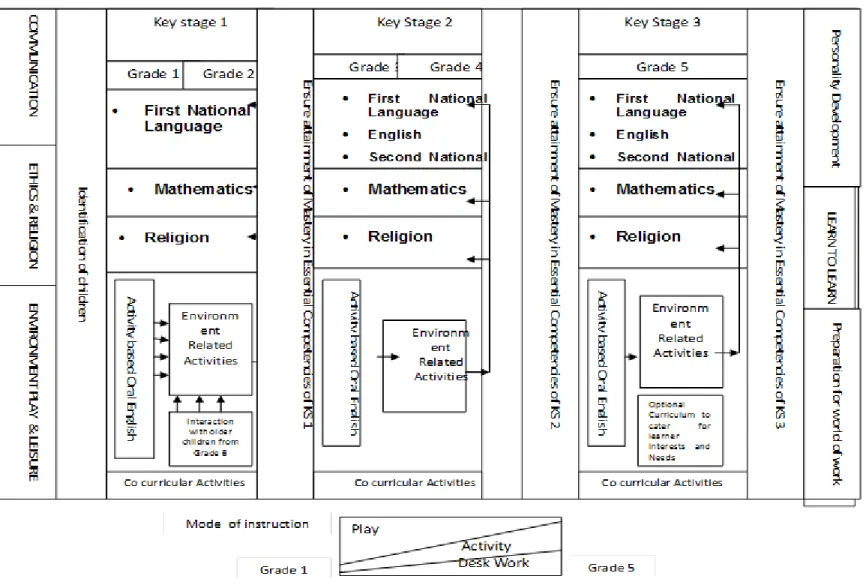
The curriculum for primary education is designed separately from those for subsequent stages of education. The primary education curriculum stage is encapsulated in a primary curriculum framework that derives from extensive debate during the 1990s in connection with the recommendations in 1997 of the National Education Commission, the work of the technical committee on primary education appointed by the Presidential Task Force and detailed implementation work by the Primary Education Unit of the National Institute of Education. The current primary education framework substantially follows that developed in 1997 (Figure 1).
In 1997 the framework was based on five basic sets of competencies - of communication, ethics and religion, environment, play and the use of leisure, and learning to learn. In 2007 two more competencies were added - preparation for the world of work and personality development. All are derived from the National Goals for education set out in the 1992 report of the National Education Commission - which included national cohesion, social justice, sustainable living, dignified work, learning to learn and adapting to change. The competencies are broken down further. For example, communication includes literacy, numeracy and graphics, while Environment embraces the social, biological and physical environment (Peiris and Nanayakkara, 2000). Competencies are linked with and cross cut the ‘subjects’ of primary education. The number of subjects in the curriculum is six - first language, second language, English (from Grade 3), mathematics, religion and environment-related activities. As we shall later, although the primary curriculum comprises six subjects, the primary ‘stage’ of education is frequently treated, administratively, as though it were a single subject. The curriculum is divided into three Key Stages - Key Stage 1 (Grades 1 and 2), Key Stage 2 (Grades 3 and 4) and Key Stage 3 (Grade 5). English is introduced orally and based on activity from Grade 1 and as a subject from Grade 3. The second national language (Sinhala for Tamil medium students and Tamil for Sinhala medium students) is introduced from Grade 3. Oral Tamil & oral Sinhala, in Sinhala- medium and Tamil-medium schools respectively, are introduced from Grade 1 onwards and as a subject from Grade 3. The recommended teaching method in the primary stage is a blend of play, activities and desk work, with the proportion of play decreasing and of activities and desk work increasing from Grade 1 to 5. Students are provided with free textbooks and workbooks while their families provide exercise books, pens and pencils. At the end of each key stage students are expected to have ‘mastered’ a set of key stage specific competencies. Competencies are classified into two groups: ‘essential’ and ‘desirable’.
8
Figure 1 Primary Curriculum Framework
9
5. Student Achievement in the Primary Stage of Education
The assessment of key stage competencies is undertaken by class teachers, working under the supervision of in service advisors (ISA). Additionally teachers administer tests after each curriculum unit and end of term tests. At the end of the primary cycle students sit the Grade 5 scholarship exam which is used by some students to seek admission to a national school or to the high status provincial school offering GCE O and A level classes. A financial bursary is available for those who perform well and whose families are poor. For many years the Grade 5 test was optional and many students in low achieving schools did not sit the test. Nowadays, most children sit the test. In 2008 10.9 percent of all children who sat the exam scored higher than the ‘cut-off’ mark required for the award of the scholarship.
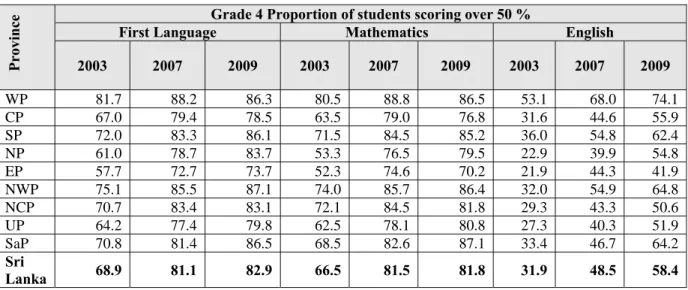
Since 2003 the National Educational Research Centre (NEREC) based at the University of Colombo has administered tests in First language, Mathematics and English to Grade 4 children in a sample of schools country-wide. Table 5 presents the results of national assessments of achievement in Grade 4 in 2003, 2007 and 2009 and indicates the increasing proportions over time of students achieving at least 50 percent in first language (Sinhala or Tamil), mathematics and English assessments.
Table 5 National Assessments of Learning Outcomes, Grade 4, by Province
Province
Grade 4 Proportion of students scoring over 50 %
First Language Mathematics English
2003 2007 2009 2003 2007 2009 2003 2007 2009
WP 81.7 88.2 86.3 80.5 88.8 86.5 53.1 68.0 74.1
CP 67.0 79.4 78.5 63.5 79.0 76.8 31.6 44.6 55.9
SP 72.0 83.3 86.1 71.5 84.5 85.2 36.0 54.8 62.4
NP 61.0 78.7 83.7 53.3 76.5 79.5 22.9 39.9 54.8
EP 57.7 72.7 73.7 52.3 74.6 70.2 21.9 44.3 41.9
NWP 75.1 85.5 87.1 74.0 85.7 86.4 32.0 54.9 64.8
NCP 70.7 83.4 83.1 72.1 84.5 81.8 29.3 43.3 50.6
UP 64.2 77.4 79.8 62.5 78.1 80.8 27.3 40.3 51.9
SaP 70.8 81.4 86.5 68.5 82.6 87.1 33.4 46.7 64.2
Sri Lanka 68.9 81.1 82.9 66.5 81.5 81.8 31.9 48.5 58.4
Source: NEREC, 2009.
Note: WP Western Province; CP Central Province; SP Southern Province; NP Northern province; EP Eastern province; NWP North Western province; NCP North Central province; UP Uva province; SaP Sabaragamuwa province.
The learning competencies on which these tests are based are viewed as necessary achievements on the part of every child as preparation for progression to subsequent grades and stages of the curriculum. However, competency ‘mastery’ is defined by the National Institute of Education as successful performance in 80 percent of the competencies, not 50 percent. The proportions of students achieving mastery by this definition are much lower. In the 2009 assessments a cut-off percentage of 80 percent rather than 50 percent were 48 percent in First Language, 53 percent in
10
Mathematics and just 19 percent in English. Compared with the expectations of the national curriculum authority, the National Institute of Education, performance among large proportions of the Grade 4 student population therefore remains low (NEREC, 2009) and provides a shaky foundation for future schooling. Competencies not mastered in the primary stage of education compromise teaching and learning in the secondary stages.
As Table 5 shows, there are wide disparities in student performance in the national assessments in maths, first language and English. More developed provinces, such as the Western province, perform better than the Northern, Eastern and Uva provinces. Within provinces, there are disparities in performance between zones and divisions. Students in urban schools perform better in achievement tests than students in rural and estate schools. Students in Tamil medium schools perform worse than students studying in the Sinhala medium. Indeed, in contrast with increasing performance of Sinhala medium students over time, performance of Tamil medium students stagnated or declined between 2007 and 2009. Girls perform better than boys on average.
Students in urban areas typically perform better than students in rural areas. It should also be noted that the distributions of scores vary by subject. In first language and mathematics scores are negatively skewed: more children are achieving high scores than low scores. In English the distribution is bi-modal, indicating distinct groups of high and low performers. Children in Type 1AB schools perform better than children in other types of schools. Primary school-age children in Type 2 schools perform worse than those in Type 1AB, 1C and 3 (NEREC, 2009).
The lower performance of Grade 4 students studying in Type 2 schools compared with Type 3 schools is curious. On average both Type 2 and Type 3 comprise the more disadvantaged schools. Type 2 schools embed the five primary grades within Grades 1-11. Type 3 schools are
‘self contained’ primary schools offering only Grades 1-5.
The low performance by primary students in Type 2 schools is not a new finding. In the 1980s and 1990s, Kariyawasam (1985), Ekanayake and Sedere (1989) and Navaratne (1995) reported similar findings. Despite its longstanding nature the ‘finding’ has attracted little or no policy discussion over the years. One hypothesis points to the self-contained nature of the Type 3 schools. We might hypothesise that, other things being equal, including the background characteristics of students and teachers, the attention of the principals and the teachers and all resource utilisation is focused entirely on the children in the primary grades. In Type 2 schools, by contrast there is competition for resources within the school from the upper grades, especially Grades 10 and 11, where students prepare for the high stakes GCE O level grades which provide a measure of the school’s esteem. We may speculate that in these schools students in the primary grades may benefit from fewer resources per capita than students in the primary grades of Type 3 schools. In other words, in schools in which there are primary and secondary grades there may be a ‘resource creep’ to the post primary grades.
11
6. Primary Education Teachers
In 2010 there a total of 214,562 teachers were employed by government, of whom 31,675 were teaching in the National schools. At the primary stage of education there were 68,310 teachers of whom 5,474 were teaching in the National schools. STRs in Sri Lanka are favourable by international standards. Nationally, the STR across Grades 1-13 is 18:1. At primary it is 25:1 and in the primary grades in the National Schools 36:1. The higher ratio in national schools reflects the intense social demand for school places in these popular schools and the preparedness of school principals to admit students to Grade 1.
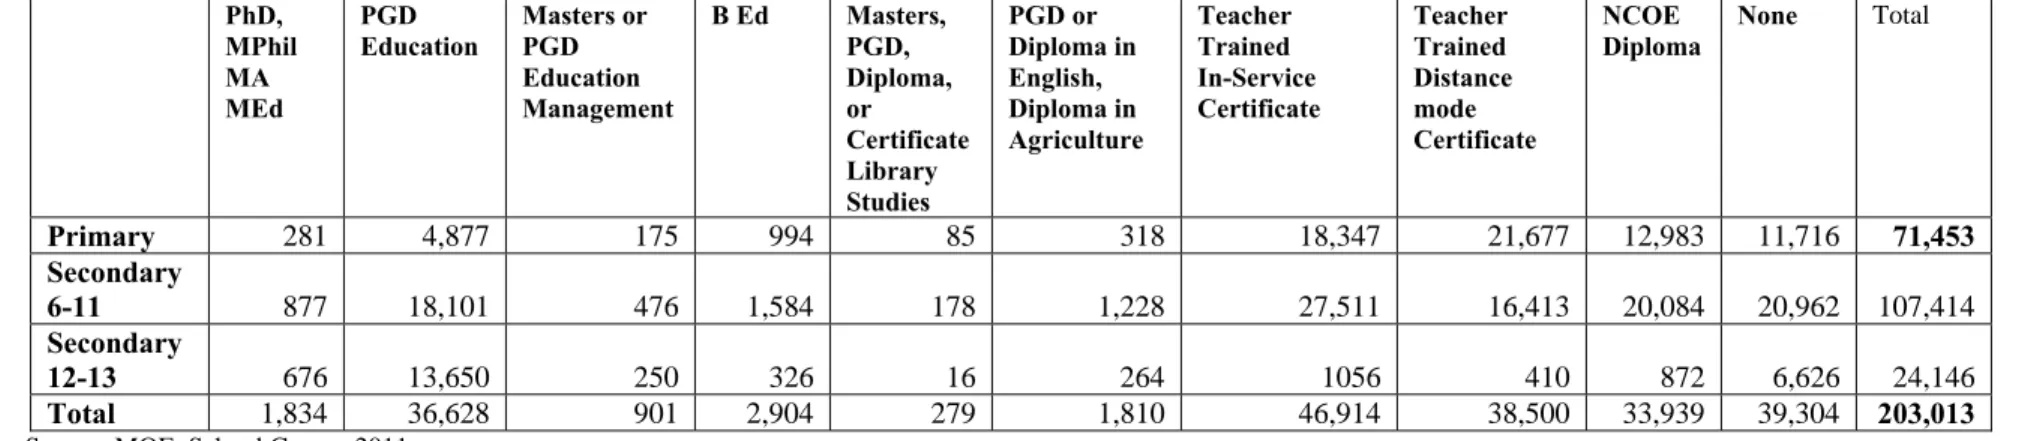
Teachers at the primary stage generally have lower educational qualifications and lower status professional qualifications than teachers in the secondary grades (Table 6). In 2011 219,886 persons employed by government were classified as teachers. Of these, 16,873 worked as in- service advisors, or in administration or were seconded to an education office for various duties.
Of the 203,013 who worked as teachers in Grades 1-13, 71,453 (35.2%) taught in Grades 1-5, 107,414 (52.9%) in Grades 6-11 and 24,146 (11.9%) in Grades 12-13. Nearly 77 percent of teachers in Grades 1-5 have GCE O or A Level general education qualifications, and 23 percent are graduates or post graduates. Among those who teach in Grades 6-11 60 percent are GCE O or A level qualified. The proportions who have reached only GCE O level qualification are relatively small but larger in the primary grades - 8.8 percent vs. 5.7 percent.
Table 7 indicates that the majority of teachers are professionally qualified in education. Among all teachers in Grades 1-13 just over 80 percent are professionally qualified, while just under twenty percent (19.3%) hold no professional qualification in education. The percentage of those with no professional qualification in education is 16.4 percent in primary education, 19.5 percent in Grades 6-11 and 27.4 percent in Grades 12-13. The level of professional qualification among primary teachers is more likely to be at certificate or diploma level (74%) than degree or post graduate degree level (9.4%). Among teachers teaching in Grades 6-11 the comparable percentages are 59.5 percent and 20.9 percent.
Despite the fact that the majority of teachers in primary of professionally qualified large numbers are not qualified to teach at the primary level. The primary education branch of the Ministry has calculated that in 2010 35 percent of teachers teaching at the primary stage of education did not hold qualifications in primary education. The majority of these were Arts or Commerce graduates who had no training in primary education or had been trained to teach in secondary and were awaiting transfers from primary to secondary classes (personal communication with the Director of Primary Education).
There are four main routes of professional training, two of which are pre-service and two of which are for teachers already serving in the system.
6.1 Initial Training for Serving Teachers
At the time of independence in 1948 there were 22 teacher training institutions, eleven run by government and eleven assisted training schools run by the various denominational bodies that
12
controlled denominational schools. A total of 1,236 students were enrolled in pre-service courses offered in three media (English, Sinhala, and Tamil). These training schools were linked with a primary school, a practical school and a senior or secondary school in close proximity (Jayasuriya, 1979). The denominational schools and teacher training colleges were taken over by government in 1961 and the system of training changed. The practice of training teachers prior to appointment gradually disappeared and most teachers were recruited with G.C.E. O L qualifications to teach for a minimum period of two years before enrolling on a certificate course at a teacher training college. It was about this time that the education sector was becoming more politicised with ‘chits and recommendations from politicians being considered to be an important criterion for teacher recruitment’ (Sivagnanam, 2011).
Currently, six teacher training colleges (TTCs)2, out of a total of eight, offer certificated courses in primary education to serving non graduate teachers who are not professionally qualified. The teacher training colleges remain an important route to training and certification. In 2010, 524 out of a total number of 2,326 serving teachers obtained their trained teacher certificates in primary education, of whom 172 were Sinhala medium and 352 Tamil medium (Sivagnanam, 2011).
Among the current teaching force serving in primary education 26 percent have been trained through this route and no higher3.
A second route for serving teachers is part time study through training ‘at a distance’, supplemented by face to face contact sessions. The distance training mode became a dominant route to professional training during the 1980s. The National Institute of Education (NIE), supported by the Swedish International Development Authority (SIDA) enrolled 19,052 trainees between 1984 and 1990. A massive recruitment of GCE O/L qualified teachers in 1989 and 1990 led to a rapid expansion of this programme and the enrolment of 46,203 serving teachers between 1991 and 1993, of whom 24,642 were enrolled on primary education courses (Sivagnanam, 2011). Table 7 indicates that among the current teaching force around 30 percent of teachers serving in primary education have been trained through this route and no higher.
Although the programme stopped in 1999 the NIE continues to run a variation of the programme through weekend contact courses as the need arises.
2 Balapitya TTC (Sinhala Medium), Unawattuna TTC (Sinhala Medium), Kopay TTC (Tamil Medium), Batticaloa TTC (Tamil Medium), Addalaichenai TTC (Tamil Medium) and Kotagala TTC (Tamil Medium)
3 A teacher trained through this route may have upgraded their professional qualifications subsequently. Table 7 classifies teachers by their current highest level of professional education achieved.
13
Table 6 Teachers in Government Schools by Stage of Teaching and Highest Level of Educational Qualification
O/L A/L BA, BSc, BEd MA, MSc, MEd MPhil Administration Total
Primary 5,734 49,033 16,355 301 4 24 6 71,453
Secondary
6-11 6,093 58,241 41,769 12,471 52 12 107,414
Secondary
12-13 33 1,487 21,573 999 48 6 24,146
Total 11,860 108,761 79,697 2,547 124 24 203,013
Source: MOE, School Census 2011.
Table 7 Teachers in Government Schools by Stage of Teaching and Highest Level of Professional Qualification
PhD, MPhil MA MEd
PGD Education Masters or PGD Education Management
B Ed Masters,
PGD, Diploma, or Certificate Library Studies
PGD or Diploma in English, Diploma in Agriculture
Teacher Trained In-Service Certificate
Teacher Trained Distance mode Certificate
NCOE
Diploma None Total
Primary 281 4,877 175 994 85 318 18,347 21,677 12,983 11,716 71,453
Secondary
6-11 877 18,101 476 1,584 178 1,228 27,511 16,413 20,084 20,962 107,414
Secondary
12-13 676 13,650 250 326 16 264 1056 410 872 6,626 24,146
Total 1,834 36,628 901 2,904 279 1,810 46,914 38,500 33,939 39,304 203,013
Source: MOE, School Census 2011.
14 6.2 Pre‐Service Initial Training
The main pre-service training route for primary education teachers is a three year National Diploma in Teaching. Students are recruited from among those with three GCE A level qualifications, including Sinhala or Tamil, and enrol full time at a National College of Education (NCOE). Two years are spent in College and one year is spent as a teaching intern. Currently there are 18 NCOEs, of which 114 offer courses in primary education. The numbers expected to pass out with a Diploma in teaching specialised in primary education colleges in 2012 is 795, of whom 495 are qualified to teach in the Sinhala medium and 300 in the Tamil medium (MOE, 2012).
Academic standards among NCOE students are high. The top ranked students in the GCE A level list are selected for the Universities. The next batch is offered places in the NCOEs.
Because competition for university entrance is so stiff (only 22,000 out of 160,000 who qualified for university entrance, were offered places) the NCOEs are able to recruit from among well qualified GCE A level students. In the current teacher force about 18 percent have qualified through the NCOE route.
While these students are well qualified in Arts stream subjects, they are not, generally, well qualified in Maths and English. Currently students are required to have achieved only a simple pass at the GCE O level examination in Maths and English when a credit pass might be more appropriate. Moreover, students who follow the Science stream at GCE A level are precluded from becoming teachers through the NCOE route because they do not follow an A level course in Sinhala or Tamil. This denies the students in primary and junior secondary education the services of young people who have achieved well in maths and the sciences and who might wish to teach at this level. Given the current emphasis in ESDFP 2012-2016 on Maths as one of the foundation subjects the restriction on GCE A level Science stream students needs to be lifted.
Many young teachers continue their studies while serving as teachers. Those who have gained valuable experience in the primary classes are unable to follow degree and post degree courses specialised in primary education. If they do upgrade their qualifications they gain qualifications which then enable them to seek transfers to the secondary classes. This represents a huge potential loss of talent from the primary stage of education.
Pre-service training is also offered via Bachelor of Education degree courses at the NIE, the Open University and the University of Colombo. A very small proportion, 1.4 percent of teachers who currently work in primary education are classified as BEd graduates (Table 7). At the University of Colombo the BEd is offered as a fulltime four year degree jointly between the Faculty of Arts and Faculty of Education with an optional module in primary teaching methods.
However the demand for this module is reducing since, for reasons of status, students do not wish to be restricted to teaching in the primary grades.
4 Sariputta (Sinhala Medium, for Buddhist monks), Pulathisipura (Sinhala Medium), Wayamba (Sinhala Medium), Ruhuna (Sinhala Medium), Hapitigama (Sinhala Medium), Sri Pada (Sinhala and Tamil Medium), Vavuniya (Tamil Medium), Batticaloa (Tamil Medium), Addalaichenai (Tamil Medium), Jaffna (Tamil Medium), Darganagar (Tamil Medium).
15 6.3 Continuous Professional Development
In addition to these forms of initial training there are various forms of continuous professional development (CPD). There is an extensive network of short term in-service training programmes organised by the provinces and by the NIE. Many teachers also upgrade their qualifications through part time study on degree or postgraduate courses. A network of around 100 teacher centres across the country offers continuous professional development opportunities. A new programme of School-based Teacher Development (SBTD) is currently being developed to supplement the above.
A general issue that pervades all forms of teacher education for primary education outlined above is the relative absence among the teacher educators of direct experience of teaching at this stage of education. And although some courses are designed separately for primary and secondary education teachers, pedagogy and psychology courses differentiate insufficiently between the psychology of and relevant pedagogies for younger and older students.
16
7. Professional Support for Curriculum, Pedagogy and Assessment Support for the work of primary education teachers derives in principle from several sources - from the school principal, from the primary section head in ‘all through’ schools, from in-service advisors at the Divisional level, from the primary education assistant director at the zonal level and from the primary education leadership at Provincial level as well as from a range of in- service training courses and further professional development of the kind outlined above. In- service advisors (ISAs) in primary education are generally selected from among primary teachers, but in many cases it is asserted that recruitment to these positions is not always made on the grounds of merit. At higher levels officers who support primary education compete through the examinations and procedures of the Sri Lanka Education Administrative Service.
Those selected may or may not have direct experience of teaching at the primary level. ‘Many education officers coordinating primary education programmes lack awareness of the curricula and teaching methodology at primary level and often have to depend on ISAs’ (Peiris and Nanayakkara, 2000: 40). Moreover, many of those officers who take on responsibilities for primary education within, say, a zonal office may not stay in post for long. One year they may work as an assistant director of primary education, next year as assistant director of planning and the following year assistant director of non formal education. The current career structure for teachers and officers does not encourage the conservation, development and sustainability of expertise in primary education.
17
8. Primary Education as a ‘Subject’ of Education
As we have seen already primary education is regarded as a distinct stage of the school curriculum, comprising six subjects of study. However it is not treated as a separate stage in education management and planning.
When teachers are allocated to schools, those without any training and those trained in primary education are generally appointed to the primary stage. However, teachers trained in secondary are also sometimes allocated to the primary grades. Many teachers trained in primary gain further qualifications to enable them to ‘upgrade’ and teach in the secondary grades. When principals are allocated to schools it is the exit rather than the entry grade of the school that will determine the grade of principal appointed. In principle the school principal is appointed to provide leadership for the teaching, learning and achievement of all students within the school.
But in the vast majority of schools offering primary education the principal is the head of an
‘all–through’ school offering Grades 1-11 or 1-13. He/she is unlikely to have professional qualifications in primary education or to have taught at this level. In principle, all through schools above a certain size should have a primary ‘head of section’. The MOE Sri Lanka Education Information 2010 data base classifies a number of teachers as supervisors of Grades 1-5, 6-11 and 12-13. It is not clear whether these include some principals or not. In any case only 1,212 teachers are listed as having supervisory responsibility for Grades 1-5 as against the 9,307 schools that offer primary education.
Beyond the school, in-service advisors are allocated to work with teachers in schools. The allocation of these staff is determined by a formula that treats primary as a subject of education akin to other school curriculum subjects such as mathematics, First language and science. Maths, language and science subject advisors tend to focus their energies on the subjects of the secondary school curriculum. The treatment of primary for this purpose as a ‘subject’ of the school curriculum rather than a ‘stage of education’ leads to a gross anomaly. Primary ‘subject’
advisors are expected to support primary education teachers in the teaching of all six subjects in the primary school curriculum in almost every school in the division or zone. Typically an in- service advisor will support all teachers in all six subjects in 25 schools, while other ‘subject’
advisors support the teaching of one or two subjects. An education division may employ just one subject advisor for primary and 18 for all other (secondary) subjects. The scale of work expected of those who support primary is far greater than that expected of the other ‘subject’
advisors. This pattern of resource allocation is repeated in the National Ministry of Education and the Provincial Departments of Education. In the Ministry of Education a small primary education ‘branch’ responsible for the implementation, monitoring and evaluation of all six subjects of primary education enjoys the same organisational status and size as a secondary school subject.
Financial allocations are made by the provincial administration to schools rather than the different sections within a school. School principals are responsible for spending and accounting for their spending in the school as a whole. Unless they are a principal of a Type 3 primary school they are not accountable for what has been spent on students in the primary grades - nor for that matter in the other stages, 6-11 and 12-13. Anecdotal evidence suggests that resources
18
are disproportionately allocated by principals to the secondary grades and the Advanced level, and in particular the GCE O and A level classes, even after taking into account the greater resource requirements of subjects such as science in the secondary grades. The budget of the National Ministry of Education includes a separate budget line for primary education but this money is allocated only to the primary sections of National schools. Province, zone, division and school budget do not separate allocations and expenditure for primary and secondary. There is no reason in principle why separate budget lines could not be created for most types of expenditure.
19
9. Challenges in Primary Education
Over ten years ago an assessment was made of the challenges facing primary education, based on the views of teachers, teacher educators and documentary and first hand evidence (Peiris and Nanayakkara, 2000, 38-42, Mallawarachchi and Sivagnanam, 2000, Aturupane and Abeygunawardene, 2000). Most recently, in its National Strategic Plan for Education, the MOE has identified many of the same and some new issues in primary education (MOE, 2011). Some of the most persistent challenges identified are highlighted below.
9.1 Pedagogy and Curriculum
Curriculum content in some subjects is too demanding, not linked to the developmental stage of the child and insufficiently trialled prior to country wide implementation.
Some sections and illustrations of teacher guides are of poor quality and the number of guides distributed does not reflect the number of primary school teachers and classes.
The recommended pedagogy of active learning is often not followed, especially in the upper grades of primary where teachers believe that teachers ‘provide’ information and learners’ receive’ it.
The examination backwash effect of the Grade 5 scholarship examination is marked and leads to a devaluation of the overall objectives of primary education. The original purpose of the exam - to provide financial support for able but poor students - has been displaced by the use of the exam by parents to gain entry for their children to popular national schools.
Formative assessments of pupil learning are not carried out seriously by many teachers and proper records are rarely maintained. Assessments through observation, oral questioning and listening to pupil discussions are rarely employed.
Summative assessments are limited to paper and pencil, many designed by external bodies, are rarely subjected to analysis and rarely used to remedy the learning difficulties of children or to improve teaching methods. Teachers rarely employ criterion-referenced assessments.
Teachers lack confidence in the teaching of maths and beginning science and some lack the skills for activity-based teaching.
Teachers in schools where grades are combined are unfamiliar with a multigrade pedagogy; teachers of single grades are unfamiliar with multilevel pedagogies within grades.
Untrained teachers are often assigned to the foundational lower grades.
Teachers receive conflicting messages from various sources of support (principals, teacher guides, ISAs, education officers).
Free and open access to primary education of good quality is compromised by the competition to gain entry to grade 1 in popular and national schools.
20 9.2 Teacher Training
30 percent of teachers in primary education are not trained to teach at this level.
Most teacher educators lack primary education experience or experience gained through class-based research. There are few opportunities for teacher educators to update their knowledge, professional skills and their knowledge of changes in the primary school curriculum.
Course content emphasises classroom organisation and child development at the expense of classroom applications and types of teacher assessment. Little attention paid to basic concepts in science or maths.
A pass at GCE A level in first language is required for admission to Colleges of Education, restricting applications from the A level science stream.
Linkages between colleges and the primary grades are weak.
Training for teachers offered through in-service training suffers from one way cascade transmission and ‘consequent distortion and dilution’ of message and in-service advisors often do not have competence in all the subjects of the primary curriculum.
9.3 Principals
Many principals lack awareness of primary education curricula and pedagogy and are unable to support primary teachers in good teaching, sometimes leading to a focus on the secondary grades at the expense of primary.
9.4 School Infrastructure
Physical conditions in some primary schools and sections of schools are not conducive to effective teaching and learning. Conditions vary but include non partitioned and noisy spaces in a single large hall, half walls, in urban areas overcrowded classrooms, shortages of furniture and equipment, poor water and sanitation facilities. National standards are not published (but some norms are being developed under the Mahindodaya 1000 secondary - 3000 ‘feeder’ primary school scheme).
9.5 Planning, Management, Finance and Administration
As noted already the existing budgetary system allocates funds on a whole school basis with no ring fenced allocation for the primary stage (or other stages). At both the provincial and zonal level primary is allocated funds as if it were a single subject rather than a series of subjects.
Financial planning and management at the school, zone, province and national level are weak.