R E S E A R C H A R T I C L E Open Access
Parapatric genetic divergence among deep evolutionary lineages in the Mediterranean green crab, Carcinus aestuarii (Brachyura, Portunoidea, Carcinidae), accounts for a
sharp phylogeographic break in the Eastern Mediterranean
Temim Deli1, Evrim Kalkan2, Selahattin Ünsal Karhan3, Sonya Uzunova4, Alireza Keikhosravi5, Raşit Bilgin6 and Christoph D. Schubart7*
Abstract
Background:Recently, population genetic studies of Mediterranean marine species highlighted patterns of genetic divergence and phylogeographic breaks, due to the interplay between impacts of Pleistocene climate shifts and contemporary hydrographical barriers. These factors markedly shaped the distribution of marine organisms and their genetic makeup. The present study is part of an ongoing effort to understand the phylogeography and evolutionary history of the highly dispersive Mediterranean green crab,Carcinus aestuarii(Nardo, 1847), across the Mediterranean Sea. Recently, marked divergence between two highly separated haplogroups (genetic types I and II) ofC. aestuariiwas discerned across the Siculo-Tunisian Strait, suggesting an Early Pleistocene vicariant event. In order to better identify phylogeographic patterns in this species, a total of 263 individuals from 22 Mediterranean locations were analysed by comparing a 587 basepair region of the mitochondrial gene Cox1 (cytochrome oxidase subunit 1). The examined dataset is composed of both newly generated sequences (76) and previously investigated ones (187).
Results:Our results unveiled the occurrence of a highly divergent haplogroup (genetic type III) in the most north-eastern part of the Mediterranean Sea. Divergence between the most distinct type III and the common ancestor of both types I and II corresponds to the Early Pleistocene and coincides with the historical episode of separation between types I and II.
Our results also revealed strong genetic divergence among adjacent regions (separating the Aegean and Marmara seas from the remaining distribution zone) and confirmed a sharp phylogeographic break across the Eastern Mediterranean.
The recorded parapatric genetic divergence, with the potential existence of a contact zone between both groups in the Ionian Sea and notable differences in the demographic history, suggest the likely impact of paleoclimatic events, as well as past and contemporary oceanographic processes, in shaping genetic variability of this species.
(Continued on next page)
* Correspondence:Christoph.Schubart@ur.de
7Zoology & Evolutionary Biology, Universität Regensburg, D-93040 Regensburg, Germany
Full list of author information is available at the end of the article
© The Author(s). 2018Open AccessThis article is distributed under the terms of the Creative Commons Attribution 4.0 International License (http://creativecommons.org/licenses/by/4.0/), which permits unrestricted use, distribution, and reproduction in any medium, provided you give appropriate credit to the original author(s) and the source, provide a link to the Creative Commons license, and indicate if changes were made. The Creative Commons Public Domain Dedication waiver (http://creativecommons.org/publicdomain/zero/1.0/) applies to the data made available in this article, unless otherwise stated.
(Continued from previous page)
Conclusions:Our findings not only provide further evidence for the complex evolutionary history of the green crab in the Mediterranean Sea, but also stress the importance of investigating peripheral areas in the species’distribution zone in order to fully understand the distribution of genetic diversity and unravel hidden genetic units and local patterns of endemism.
Keywords: Crustacea, Population genetics, Biogeographic boundaries, Evolutionary history, Mitochondrial DNA, Mediterranean Sea
Background
In the marine environment, genetic variability and popu- lation genetic structure of a species are shaped by both contemporary and historical marine barriers, such as narrow and shallow water passages between landmasses [1], salinity gradients [2], different types of currents [3], as well as palaeoecological history [4, 5]. In particular, historical processes have left marked imprints on the genetic structure of extant marine populations. For ex- ample, the extent of genetic divergence between ge- nomes varies among marine species and can be used to estimate the time of their separation. Marine popula- tions inhabiting specific regions (i.e., those confined to historical refugial zones) might have harboured persist- ing genetic lineages through time and therefore accumu- lated genetic differences, leading to their possible speciation through several climatic cycles (i.e., the Qua- ternary glaciations periods) [6].
Palaeoclimatic and palaeogeographical evolution of the Mediterranean, primed by sea-level low stands during glacial periods of the Pleistocene and the consequent shift in abiotic (i.e., temperature and salinity) and biotic factors (i.e., productivity), prompted population isolation and divergence, following local events of extinction and recolonization. This in turn enhanced the formation of intraspecific genetic units within various marine taxa, due to historical or contemporary hydrographic barriers to gene flow [4, 5]. The best known oceanographic dis- continuities in the Mediterranean are: (1) the Almería- Oran Front as the main genetic breakpoint between the Atlantic Ocean and the Mediterranean Sea [4,7], (2) the transition between the Western and the Eastern Medi- terranean, due to unidirectional water flow at the Siculo- Tunisian Strait [5], and (3) the hydrographic isolation of the Aegean, Ionian and Adriatic seas [5]. In addition to these oceanographic barriers, the geological history of the Eastern Atlantic and Mediterranean Sea, including the breaking up of the Tethys Sea, the Messinian Salinity Crisis [8], and the Pleistocene glaciations [9], might have left marked footprints on the genetic structure of species and made the Mediterranean region a notably dynamic hotspot of diversity [10–12]. For example, intensified modifications to the coastline (sea level regressions) dur- ing repeated Pleistocene glaciations could have limited
the biotic exchange across physical barriers, such as the Gibraltar Strait [13] and the Siculo-Tunisian Strait [14], and strongly influenced the formation of distinct phylo- genetic lineages within Mediterranean marine species.
In this context, the phylogeography of Mediterranean species underwent a common set of processes resulting from fragmentation within glacial refugia, range expan- sions via postglacial colonisation, and secondary contact zones among historically divergent lineages [4,12,15–18].
The Mediterranean green crab, Carcinus aestuarii (Nardo, 1847) (Brachyura, Portunoidea, Carcinidae), rep- resents a good model to test the impact of current and historical marine barriers on population subdivision and genetic structuring across various marine biogeographic boundaries in the Mediterranean Sea. This species is a very common inhabitant of estuaries and lagoons of the Mediterranean Sea and has also been reported from the southern Black Sea [19, 20]. It inhabits various types of environments, ranging from sheltered and often brackish habitats (including subtidal and intertidal mud, as well as sand flats at open coastal sites or lagoons and estuar- ies) to saltmarshes, and seagrass beds (authors’personal observations). It is a voracious omnivore and aggressive competitor. Furthermore, it has a wide tolerance toward variations of salinity, temperature, and dissolved oxygen.
Hence, it has a high ability to adapt to a wide variety of habitats [19,21]. The Mediterranean green crab also ex- hibits high fecundity and a relatively long dispersal stages, with a larval planktonic phase of approximately six weeks [22,23].
Owing to maritime commerce and ballast transport, several reports have pointed out to the accidental intro- duction of C. aestuarii specimens into several regions outside their native range, such as to the Canary Islands [24], Tokyo Bay, Japan [25] and South Africa [22,26].
Among the above mentioned eco-biological characteris- tics ofC. aestuarii, the particular ecological specialization of this species to estuarine and brackish-water habitats in the Mediterranean could be considered as important fac- tor susceptible of generating significant phylogeographic patterns, owing to limited connectivity among estuarine populations. Restricted gene flow is highly expected in estuarine and brackish-water taxa owing to larvae reten- tion within their natal estuary (e.g. [27–29]). In addition
to this mechanism, geographically extended distances sep- arating estuaries (e.g. [29]), the differential in physical characteristics of estuarine and their adjacent coastal envi- ronments [30], as well as the potential different physio- logical challenges between estuarine and coastal waters [31], could also impede inter-estuarine larval dispersal.
Numerous investigations have shown that genetic con- nectivity among populations of estuarine taxa is more restricted than that occurring in taxa inhabiting the open coast [27,32,33].
Recent population genetic surveys on C. aestuarii, across native and invaded regions [22,23,34,35], unveiled extensive genetic variability and marked population differ- entiation associated with the main oceanographic discon- tinuities that characterize these areas. In particular, Marino et al. [23] and Ragionieri and Schubart [35] found significant genetic differentiation among populations from western and eastern Mediterranean coastlines in Europe.
This noticeable pattern of genetic structure has been later confirmed across the central African Mediterranean coast, when Deli et al. [36] revealed a sharp haplotypic discon- tinuity among eastern and western sites in Tunisia. Both retrieved genetic groups were found to be genetically and morphologically differentiated across the Siculo-Tunisian Strait [36, 37]. A more recent investigation by Deli et al.
[12], detailing phylogeography and population genetic structure of the Mediterranean green crab across the Siculo-Tunisian Strait, showed concordant patterns of mitochondrial and nuclear divergence among western and eastern Mediterranean populations from northern Africa.
The study also revealed a marked divergence between two highly separated haplogroups, suggesting an Early Pleisto- cene vicariant event in the genetic differentiation of this highly dispersive decapod species [12].
These insights, inferred so far from population genetic surveys of C. aestuariithroughout the western and cen- tral Mediterranean coasts [12, 23, 34–36], trigger the necessity of detailed phylogeographic and population genetic analyses of this species across the poorly investi- gated Eastern Mediterranean Basin. Sea-level Pleistocene oscillations potentially caused the isolation or partial iso- lation of the Black Sea, Aegean Sea and Eastern Mediter- ranean Basin [38]. These historical isolation processes have been maintained by the impact of the contempor- ary hydrographic isolation of the Adriatic, Ionian and Aegean seas [4, 5]. In addition to these historical and contemporary hydrographic isolation patterns, different selective forces related to the environmental conditions of the Ionian and Aegean seas could account for the phylogeographical break observed in the Eastern Medi- terranean. Previous population genetic studies on many vertebrate and invertebrate species confirmed this ten- dency and identified a major genetic break related to the hydrographic isolation of the Aegean Sea [5,16,39–45].
In light of these considerations, it will be interesting to re-examine population genetic structure in a highly dis- persive decapod species, like Carcinus aestuarii, across these potential barriers to gene flow. This may contribute to a better identification of the phylogeographic patterns in this species and unveil other potential evolutionary lineages withinC. aestuariiacross the poorly investigated easternmost part of its distribution range. It may also allow depicting the historical events that might have shaped the genetic structure of the Mediterranean green crab. In order to achieve these goals, new mitochondrial Cox1 (cytochrome oxidase subunit 1) sequences were obtained from 76 specimens collected from seven sites across the Eastern Mediterranean Basin, stretching across the Greek and Turkish coasts. This newly generated data- set of sequences was merged with previously examined data by Ragionieri and Schubart [35] and Deli et al. [12]
for phylogeographic re-analyses.
Methods
Sampling strategy and genomic DNA extraction
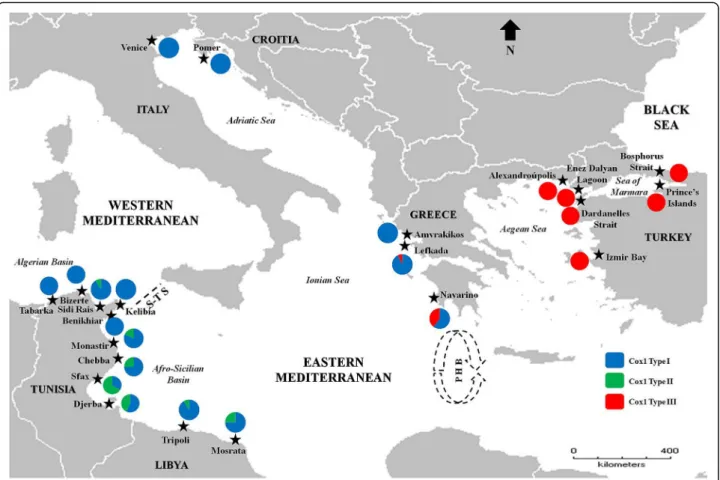
A total of 263 samples ofCarcinus aestuariiwere included in the present phylogeographic study, of which 76 were newly analyzed, and the remaining 187 had been previ- ously investigated [12, 35] (Table 1 and Fig. 1). Newly examined specimens of C. aestuarii were collected from seven locations stretching across the Greek (Lefkada and Alexandroupolis) and Turkish coasts (Izmir Bay and Enez Dalyan Lagoon in the Aegean Sea; Dardanelles Strait, Prince’s Islands and Bosphorus Strait in the Sea of Mar- mara) (Fig.1). Previously examined data by Ragionieri and Schubart [35] include the populations of Pomer (Croatia), Amvrakikos, and Navarino (both Greece) corresponding to the Adriatic and Ionian seas respectively; while those retrieved from Deli et al. [12] comprise all surveyed popu- lations from North Africa and Venice Lagoon. In the present study, we included all previously investigated east- ern Mediterranean populations in order to optimize the population genetic structure analysis across the poorly surveyed Eastern Mediterranean Basin, whereas from the available western Mediterranean locations we only in- cluded those from Deli et al. [12]. This strategy was adopted, as the primary aim of this study is the examin- ation of the phylogeography and evolutionary history of eastern Mediterranean populations ofC. aestuarii. West- ern Mediterranean locations are included as reference populations to re-analyze population genetic structure and test for genetic subdivision across the Siculo-Tunisian Strait. Those from the North-African coast were included in this study, because they allowed Deli et al. [12] to confirm and delineate the geographic break across the Siculo-Tunisan Strait based on the concordant patterns of mitochondrial and nuclear phylogeographic structure.
This choice has been validated after confirming that
Table1SamplinginformationonthegreencrabCarcinusaestuariiincludingcollectionsites,countries,Mediterraneanbasins,regions,geographiccoordinates,andnumberof examinedspecimens(N)pereachlocation.Geneticdiversitymeasures(includingnumberofhaplotype(Nh),numberofpolymorphicsites(Nps),haplotype(h)andnucleotide(π) diversities,andmeannumberofnucleotidedifferences(K))andhistoricaldemographicresults(inferredfrom:Tajima’sDtest(D),Fu’sFStest(FS),Ramos-OnsinsandRozas’sR2test (R2),andmismatchdistributionraggednessindex(rg))werealsoprovidedforeachinvestigatedlocationandthetotaldataset CollectionsiteCountryMediterraneanBasinRegionGeographiccoordinatesNNhNpshπKDFSR2rg Tabarkab TunisiaWesternMediterraneanAlgerianBasin36°57′N08°45′E10560.756±0.1300.0023±0.00061.355−1.492−1.5070.1370.042 Bizerteb TunisiaWesternMediterraneanAlgerianBasin37°16′N09°52′E158100.867±0.0670.0030±0.00051.771−1.613−3.5410.0830.064 SidiRaisb TunisiaWesternMediterraneanAlgerianBasin36°46′N10°32′E115210.709±0.1370.0072±0.00454.236−1.8591.4350.2580.094 Kelibiab TunisiaWesternMediterraneanAfro-SicilianBasin36°51′N11°05′E10560.667±0.1630.0023±0.00081.355−1.492−1.5070.1370.037 Benikhiarb TunisiaWesternMediterraneanAfro-SicilianBasin36°28′N10°46′E12210.167±0.1340.0002±0.00020.166−1.140−0.4750.2760.472 Monastirb TunisiaEasternMediterraneanAfro-SicilianBasin36°10′N10°49′E119280.945±0.0660.0138±0.00518.127−0.692−1.3910.1200.054 Chebbab TunisiaEasternMediterraneanAfro-SicilianBasin35°14′N11°07′E1211310.985±0.0400.0160±0.00399.424−0.369−3.0520.1180.051 Sfaxb TunisiaEasternMediterraneanAfro-SicilianBasin34°44′N10°45′E1512270.943±0.0540.0166±0.00259.7520.729−2.0770.1600.026 Djerbab TunisiaEasternMediterraneanAfro-SicilianBasin33°52′N10°51′E149290.912±0.0590.0186±0.002210.9670.8670.8130.1660.044 Tripolib LibyaEasternMediterraneanAfro-SicilianBasin32°54′N13°11′E116230.891±0.0630.0089±0.00435.254−1.5120.8480.2270.095 Mosratab LibyaEasternMediterraneanAfro-SicilianBasin32°22′N15°05′E128280.894±0.0780.0150±0.00448.833−0.2120.4200.1400.094 VeniceLagoonb ItalyEasternMediterraneanAdriaticSea45°27′N12°16′E117100.909±0.0660.0060±0.00093.5630.186−1.2050.1490.064 Pomera CroatiaEasternMediterraneanAdriaticSea44°49′N13°53′E2015190.953±0.0350.0047±0.00082.810−1.797−11.0550.0520.046 Amvrakikosa GreeceEasternMediterraneanIonianSea39°1.2’N20°45.3′E137110.731±0.1330.0028±0.00081.692−2.112−2.8330.0930.044 LefkadaGreeceEasternMediterraneanIonianSea38°49.6’N20°43′E148270.824±0.0980.0088±0.00455.208−1.648−0.3150.1840.042 Navarinoa GreeceEasternMediterraneanIonianSea36°57’N21°39.7′E107260.867±0.1070.0220±0.004012.9111.9301.4810.2300.241 AlexandroupolisGreeceEasternMediterraneanAegeanSea40°51′N25°52′E127200.773±0.1280.0083±0.00244.893−1.146−0.0740.0970.053 IzmirBayTurkeyEasternMediterraneanAegeanSea38°27′N27°05′E6340.600±0.2150.0022±0.00091.333−1.2950.2960.2350.737 EnezDalyanLagoonTurkeyEasternMediterraneanAegeanSea40°42′N26°03′E2013230.853±0.0800.0050±0.00142.973−2.081−6.8040.0620.055 DardanellesStraitTurkeyEasternMediterraneanSeaofMarmara40°13′N26°32′E53120.700±0.2180.0081±0.00364.800−1.2052.2250.2910.470 Prince’sIslandsTurkeyEasternMediterraneanSeaofMarmara40°52′N29°05′E126160.758±0.1220.0065±0.00223.833−1.1930.3230.1420.084 BosphorusStraitTurkeyEasternMediterraneanSeaofMarmara41°12′N29°06′E7670.952±0.0960.0050±0.00072.9520.172−2.2750.1650.065 Total263106970.912±0.0120.0211±0.000912.389−0.650−23.8850.0620.023 Significantvaluesareinbold.Non-significantvaluesfortheraggednessindex(rg)acceptthenullhypothesisofexpectationunderasuddendemographicexpansionmodel.a:DataexaminedbyRagionieriand Schubart[35].b:DataexaminedbyDelietal.[12].ExaminedspecimensofthepopulationofNavarino(labelledasPeloponnesusinRagionieriandSchubart[35])werethoseassignedtoCox1typeI
incorporation of additional western Mediterranean se- quences from Ragionieri and Schubart [35] did not affect the outcome of phylogeographic analyses and population structure. From each crab, muscle tissue was dissected from a removed pereiopod (after releasing the animal back into its original environment) and stored in absolute etha- nol at−20 °C until genetic analysis. Total genomic DNA was isolated from muscle tissue using the Wizard® gen- omic DNA purification kit (Promega), the Puregene kit (Gentra Systems: Minneapolis, MN55447, USA) or the Roche High Pure PCR Template Preparation Kit (Indian- apolis, USA) following the instructions of the suppliers.
Cox1 gene amplification and sequencing
The decapod primers COL6a and COH6 (specifically designed for decapod crustaceans; see [46]) or the uni- versal primers LCO1490 and HCO2198 [47] were used to amplify parts of the mitochondrial Cox1 gene. The adopted PCR mixture and thermocycling conditions were detailed in Deli et al. [12]. After being loaded on a 1.5% agarose gel and visualized under UV light, strong products were outsourced for sequencing with primer
COL6a or HCO2198 to LGC Genomics (Berlin) or Macrogen Europe (Netherlands). The obtained sequences were visually inspected with Chromas Lite 2.1.1 [48], aligned with Clustal W as implemented in BioEdit [49], and trimmed to a 587 bp fragment for subsequent ana- lyses. Sequences of Cox1 haplotypes, corresponding to the retrieved three haplogroups, were submitted to GenBank (accession numbers: MG798798-MG798903).
Statistical analyses
Intra-population genetic diversity and detection of selection signatures
We assessed the nucleotide composition of the analysed Cox1 fragment with MEGA version 7.0.18 [50]. In order to assess genetic diversity for each population as well as for the total dataset, we computed the number of haplo- types (Nh), number of polymorphic sites (Nps), haplo- type diversity (h; [51]), nucleotide diversity (π; [51,52]), and mean number of nucleotide differences (K) using DnaSP version 5.10 [53].
To test in how far natural selection is operating on the C. aestuariiCox1 gene, we used the codon-based Z-test
Fig. 1Sampling locations of the green crabCarcinus aestuariiacross the Mediterranean Sea. Distribution patterns and proportions of Cox1 types (I, II, and III) along the examined locations are shown in couloured circles. S-T S: Siculo-Tunisian Strait; PHB: Peloponnese Hydrographic Break (represented by the quasi-circular anti-cyclonic feature southwest of Peloponnese). The base map was constructed with the software DIVA-GIS 7.5.0 (http://www.diva-gis.org)
of selection for analysis, averaging over all sequence pairs, as implemented in MEGA version 7.0.18 [50].
Codon-based models of molecular evolution are able to infer signatures of selection from alignments of homolo- gous sequences by estimating the relative rates of syn- onymous (dS) and nonsynonymous substitutions (dN) [54]. The relative abundance of synonymous and nonsy- nonymous substitutions within the examined gene se- quences were computed, averaged, and compared for each population as well as for the total dataset. The re- jection of the null hypothesis of strict neutrality (H0: dN
=dS) depends on the tested alternative hypothesis (HA):
(a) lack of neutral evolution (dN is different from dS:
dN≠dS), (b) positive selection (dN>dS) or (c) purifying selection (dN<dS). A two-tailed test was implemented to reject neutral evolution, while one-tailed tests were used to check for positive and purifying selection, respect- ively. The variance of the difference between synonym- ous and nonsynonymous substitutions was computed using the bootstrap method (1000 pseudoreplicates).
Analyses were conducted using the Nei and Gojobori [55] procedure.
Intraspecific evolutionary relationships among Cox1 haplotypes A statistical parsimony network, constructed with the software TCS version 1.21 [56] under the 95% probability criterion for a parsimonious connection [57,58], allowed inferring intraspecific evolutionary relationships among the Cox1 haplotypes of C. aestuarii. Based on the out- come of the TCS analysis, we also examined the distribu- tion pattern of the discerned divergent haplotypes (or Cox1 haplogroups) across the surveyed geographic region.
Relationship between phylogeny and the geographical distribution of haplotypes
Based on the particular pattern of evolutionary relation- ships among Cox1 haplotypes (yielding various differenti- ated haplogroups that were restricted to specific geographic regions), we assessed the relationship between phylogeny and the geographical distribution of the recorded haplo- types by measuring levels of population subdivision, using both unordered (GST) and ordered haplotypes (NST). Esti- mation and comparison of these parameters was based on the methods described by Pons and Petit [59, 60] using PERMUT & CPSRR version 2.0 [60]. IfNSTis significantly higher thanGST, it usually indicates the presence of phylo- geographic structure [60,61].
Divergence estimation among resulting mitochondrial Cox1 haplogroups
In order to elucidate the evolutionary history ofC. aestuarii across the surveyed geographic region, we estimated diver- gence time between the discerned mitochondrial hap- logroups. For this purpose, we applied different models and
calibration strategies in order to obtain a comprehensive estimate, minimizing uncertainties due to different model assumptions. First, we applied a known biogeographical event calibration using interspecific sequences (considering the speciation event between Mediterranean and Atlantic green crab species). Subsequently, the entire intraspecific dataset (all examined sequences of C. aestuarii in this study) was used for the divergence estimate, applying a spe- cifically determined clock rate of the examined genetic marker for the genusCarcinus[23].
In a first analysis, we considered the closure of the Strait of Gibraltar at the beginning of the Messinian Salinity Crisis (5.59 million years ago; [8]) as calibration point for divergence estimation. Indeed, the completely interrupted contact between the Mediterranean Sea and the Atlantic Ocean, during the Messinian Salinity Crisis, is thought to provide the responsible geographic barrier for the speciation of the Mediterranean green crab C.
aestuarii and its Atlantic sister species C. maenas (see [26, 62]). Divergence estimations were carried out in BEAST version 1.7.5 [63]. Prior to the analysis, the most appropriate model of sequence evolution for the dataset was selected using MODELTEST version 3.7 [64] based on Akaike Information Criterion scores. We included only unique haplotype sequences, corresponding to the encountered C. aestuarii haplogroups and the Atlantic sister species C. maenas respectively. Notably, for such kind of analysis, the simplest tree priors are the one par- ameter Yule model [65] and the two-parameter Birth- Death model [66,67]. We used the latter model, since it has been suggested as an appropriate null model for spe- cies diversification [66]. In order to test for the right clock model, analyses were carried out first with a strict clock and repeated with an uncorrelated lognormal relaxed clock [68]. Since the parameter of the standard deviation of the uncorrelated lognormal relaxed clock was significantly different from zero (ucld.stdev = 0.28, 95% HPD: 1.13 10−4 -0.54), highlighting variation in rates among branches, final analyses were run enforcing a relaxed molecular clock model. Uncertainty on the divergence time was modelled using a normal prior with a standard deviation of 55,000 years [23]. The normal distribution is considered a useful calibration prior when applying a biogeographical date.
In order to check the consistency of dating results, add- itional analyses were performed involving only the exam- ined intraspecific data ofC. aestuariifrom this study and implementing the coalescent tree prior that is typically used when all the samples are from the same species [69].
Both strict molecular clock and lognormal relaxed mo- lecular clock models were compared using Bayes factors (BF) to test which of these two clock models best fitted our intraspecific data. We used TRACER version 1.5 [70]
to compare twice the difference in the marginal model
posterior likelihoods (MMPLs) as estimated from the harmonic mean of the sample of posterior trees for each scenario. Values of 2ln (BF) > 10 were considered as very strong evidence for a given model to be more likely than another [71]. As the Bayes factors indicated a much better fit for the strict clock model (MMPL =−9484.4) than for a relaxed clock model (MMPL =−9984.3) (2 ln(BF) =12.
428), the final analyses were carried out with a strict mo- lecular clock, and assuming the generalised time reversible (GTR) model of sequence evolution [72], as calculated by MODELTEST version 3.7 [64]. The specifically estimated mutation rate for Carcinus of 3.86% per Myr (see [23]) was used to calibrate the genealogy and date tMRCA of Cox1 lineages. This complementary strategy was imple- mented to minimise errors of divergence times estimation inferred from the use of deep calibration points [73].
For all kinds of Bayesian analyses, the Markov chain Monte Carlo (MCMC) simulations were run for 100 mil- lion steps and sampled every 1000 steps. The correspond- ing outputs were reviewed in TRACER version 1.5 [70]
for robustness, and the resultant trees were summarized in TreeAnnotator (implemented in BEAST). The final results are presented with FigTree version 1.4.0 [74].
Population genetic structure and phylogeographic examination
Overall population genetic differentiation (assessed by one-level Analysis of molecular variance [75]) as well as detailed pairwise comparison of genetic differentiation were estimated in ARLEQUIN version 3.1 [76], using the two fixation indices:ΦST(implementing the Tajima- Nei model, appropriate for unequal nucleotide frequen- cies [77]) and FST (based on haplotypic frequency). For both kinds of analyses, the resulting significant values were calculated from 10,000 permutations. B-Y FDR cor- rection [78] was then applied to yield the exact level of significance (critical value = 0.00830 with 231 hypothesis tests and alpha = 0.05). In order to characterize patterns of genetic structure, i.e., identify differentiated genetic groups of populations, we performed a non-metric Multidimensional Scaling (MDS), through PAST version 2.17 [79], based on Tajima-Nei genetic distances. In order to test the hypothesis that patterns of genetic dif- ferentiation are caused by isolation by distance (IBD), we ran the Mantel test [80] for pairwise matrices between geographical and genetic distances. The Mantel test was performed with the software AIS (Alleles in Space) ver- sion 1.0 [81]. The statistical significance of the test was assessed by running 10,000 random permutations. Popu- lation genetic structure of C. aestuarii was also exam- ined (by means of two-level AMOVAs) under various biogeographic hypotheses, testing the significance of population structure among Mediterranean basins (Western Mediterranean vs. Eastern Mediterranean), or
among defined regions within basins (Algerian Basin vs.
Afro-Sicilian Basin vs. Adriatic Sea vs. Ionian Sea vs.
Aegean Sea vs. Sea of Marmara). Partitioning of C. aes- tuarii genetic variation was also assessed based on the outcome of haplotype network (among the main groups of populations defining each haplogroup) and pairwise comparisons of genetic differentiation, as well as the MDS plot.
The spatial analysis of molecular variance (SAMOVA) approach, implemented in SAMOVA version 1.0 [82], without a prior population structure definition, was also used to infer the likely number of hierarchical groups explaining most of the retrieved genetic structure within C. aestuarii. The software was run with 100 random ini- tial conditions for 10,000 iterations, with number of tested groups (K) ranging from 2 to 8.
Demographic history
Three neutrality tests (Tajima’sD [83], Fu’sFs [84], and Ramos-Onsins and Rozas’sR2[85]) were used to assess deviation from neutrality, and examine the demographic history of the Mediterranean green crab. Both Dand Fs indices were estimated in ARLEQUIN, while R2statistic was calculated in DnaSP. The examination of deviation from neutrality by all three indices was based on 1000 coalescent simulations. A scenario of population expan- sion is likely supported by significantly negative D and Fs values as well as significant R2 (in small population sizes). The Harpending’s raggedness index rg [86] was also used to examine demographic changes in C. aes- tuarii according to the population expansion model implemented in ARLEQUIN. A total of 10,000 replicates allowed testing the significance of thergindex. The four above mentioned parameters (D, Fs, R2, and rg) were applied to each examined population, the overall dataset, as well as the genetically differentiated geographic groups (as inferred mainly by SAMOVA).
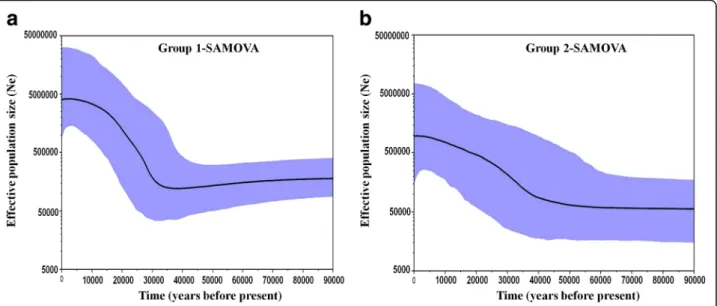
Since deviations from neutrality are usually caused by changes in effective population size, we also applied Bayesian Skyline plots (BSP) [87] to explore the magni- tude of historical demographic events. Notably, this Bayesian approach could allow the inference of detailed and realistic population size function [88], and also yield accurate estimation of expansion events [89]. BSP plots were generated for the geographic groups retrieved by SAMOVA. Analyses were carried out in BEAST version 1.7.5 considering a GTR model (as already calculated by MODELTEST version 3.7) and a strict molecular clock (confirmed as the best model fitting the examined intra- specific data when compared with lognormal relaxed molecular clock using Bayes factors (BF) method). The specific mutation rate of 3.86% per Myr, as estimated for Carcinus by Marino et al. [23], was implemented in the analysis in order to date expansion event. Pattern of
effective population size evolution through time was assessed taking into account a generation time of approxi- mately two years in the green crab [90]. Two independent MCMC (each with 50,000,000 iterations) were carried out.
Following the removal of the first 10% iterations (5,000,000) as burn-in, the remaining replicates were combined in LogCombiner [63] and summarized as BSPs after checking their convergence (Effective Sample Sizes (ESS) of all pa- rameters > 200 for each group) in TRACER version 1.5.
Results
Genetic diversity and detection of selection signatures Sequences corresponding to the mtDNA Cox1 gene from 263 individuals and 22 locations of C. aestuarii were included in the analyses. Of these, 76 were newly obtained, proofread and aligned. The resulting alignment had to be trimmed to a length of 587 basepairs. A total of 97
nucleotide sites were variable, of which 58 were parsimony- informative. Nearly 40% of the examined sequences were unique and allowed the identification of 106 haplotypes (Fig. 2 and Table 1). The nucleotide composition of the analyzed fragment showed an A-T bias (C = 18.81%;
T = 36.12%; A = 26.62%; G = 18.45%), which is typical for invertebrate mitochondrial DNA [91].
Genetic diversity analyses of this mitochondrial dataset revealed high total haplotype (h= 0.912 ± 0.012) and nu- cleotide (π= 0.0211 ± 0.0009) diversities (Table 1). A high level of the mean number of nucleotide differences (K) was also inferred (K = 12.389). The values of this par- ameter ranged from 0.166 in the population of Benikhiar to 12.911 in Navarino (Table1).
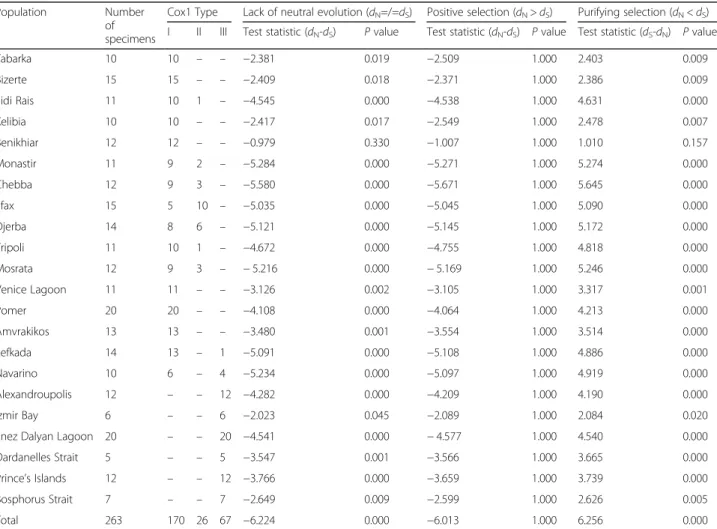
The codon-based Z-test of selection allowed the rejec- tion of the null hypothesis of strict-neutrality (dN=dS) for all examined populations (except Benikhiar), as well
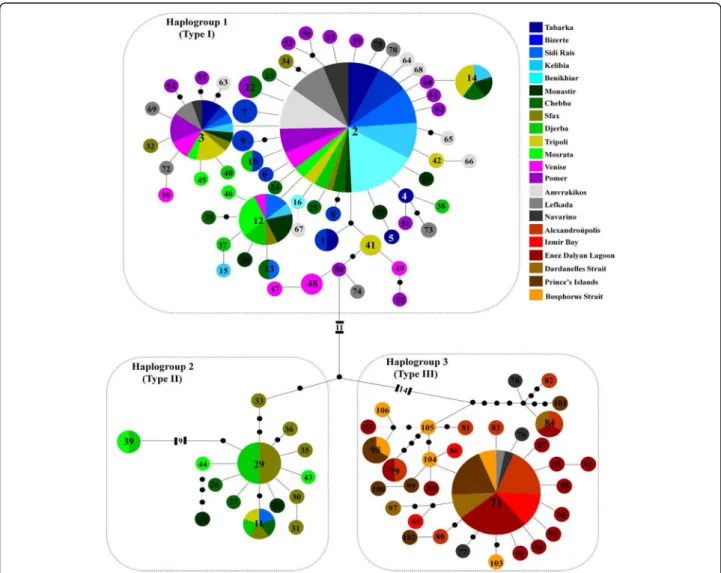
Fig. 2TCS haplotype network ofCarcinus aestuarii, based on the alignment of 587 bp of the mitochondrial gene Cox1, showing the relationships among the recorded haplotypes. Haplotype 2 corresponds to the ancestral haplotype. Small black circles correspond to missing (or hypothetical) haplotypes. Each line between two points represents one mutational step. Circle sizes depict proportions of haplotypes; the smallest corresponds to 1 and the largest to 67 individuals
as for the total dataset (Table2). Notably, the null hypoth- esis of strict-neutrality was rejected because of purifying selection (dS-dN= 6.256, P= 0.000), as no significant positive selection was detected for all investigated populations ofC. aestuariias well as for the whole dataset (dN-dS=−6.013,P= 1.000) (Table2).
Intraspecific evolutionary relationships among Cox1 haplotypes
The phylogeographic relationships among the 106 recorded haplotypes, as inferred by the TCS statistical parsimony procedure, revealed a remarkable divergence among three haplogroups. These haplogroups will from now on be re- ferred to as types I, II (see also Deli et al. [12]), and III. They are all characterized by a star-like shape centred around three main haplotypes: 2, 29 and 71 respectively (Fig. 2).
Type III was found to be the most divergent, separated by at least 28 mutations from type I, and 17 mutations from
type II. The most frequent haplotype 2 was found in 67 in- dividuals and in all populations except those from northern Greece (Alexandroupolis) and Turkey (Izmir Bay, Enez Dalyan Lagoon, Dardanelles Strait, Prince’s Islands and Bosphorus Strait) (Additional file: Table S1). Haplotype 2 was distinguished from haplotypes 29 and 71 by 21 and 35 mutational steps, corresponding to sequence divergence rates of 3.40% and 5.96%, respectively. The main haplotypes 29 and 71, representative of types II and III respectively, were separated by 24 mutational steps, corresponding to a rate of sequence divergence of 4.08%.
Relationship between phylogeny and the geographical distribution of haplotypes
While type I sequences proved to be present in almost all examined populations, the genetic distinctiveness of the other two haplogroups hints at the existence of a remarkable regional geographic structure within C.
Table 2Codon-based Z-test of selection for analysis averaging over all sequence pairs. Alternative hypotheses of neutrality, positive selection and purifying selection were tested for each population as well as for the total dataset ofCarcinus aestuarii. For each popu- lation, examined specimens were assigned to the corresponding Cox1 type
Population Number
of specimens
Cox1 Type Lack of neutral evolution (dN=/=dS) Positive selection (dN>dS) Purifying selection (dN<dS) I II III Test statistic (dN-dS) Pvalue Test statistic (dN-dS) Pvalue Test statistic (dS-dN) Pvalue
Tabarka 10 10 – – −2.381 0.019 −2.509 1.000 2.403 0.009
Bizerte 15 15 – – −2.409 0.018 −2.371 1.000 2.386 0.009
Sidi Rais 11 10 1 – −4.545 0.000 −4.538 1.000 4.631 0.000
Kelibia 10 10 – – −2.417 0.017 −2.549 1.000 2.478 0.007
Benikhiar 12 12 – – −0.979 0.330 −1.007 1.000 1.010 0.157
Monastir 11 9 2 – −5.284 0.000 −5.271 1.000 5.274 0.000
Chebba 12 9 3 – −5.580 0.000 −5.671 1.000 5.645 0.000
Sfax 15 5 10 – −5.035 0.000 −5.045 1.000 5.090 0.000
Djerba 14 8 6 – −5.121 0.000 −5.145 1.000 5.172 0.000
Tripoli 11 10 1 – −4.672 0.000 −4.755 1.000 4.818 0.000
Mosrata 12 9 3 – −5.216 0.000 −5.169 1.000 5.246 0.000
Venice Lagoon 11 11 – – −3.126 0.002 −3.105 1.000 3.317 0.001
Pomer 20 20 – – −4.108 0.000 −4.064 1.000 4.213 0.000
Amvrakikos 13 13 – – −3.480 0.001 −3.554 1.000 3.514 0.000
Lefkada 14 13 – 1 −5.091 0.000 −5.108 1.000 4.886 0.000
Navarino 10 6 – 4 −5.234 0.000 −5.097 1.000 4.919 0.000
Alexandroupolis 12 – – 12 −4.282 0.000 −4.209 1.000 4.190 0.000
Izmir Bay 6 – – 6 −2.023 0.045 −2.089 1.000 2.084 0.020
Enez Dalyan Lagoon 20 – – 20 −4.541 0.000 −4.577 1.000 4.540 0.000
Dardanelles Strait 5 – – 5 −3.547 0.001 −3.566 1.000 3.665 0.000
Prince’s Islands 12 – – 12 −3.766 0.000 −3.659 1.000 3.739 0.000
Bosphorus Strait 7 – – 7 −2.649 0.009 −2.599 1.000 2.626 0.005
Total 263 170 26 67 −6.224 0.000 −6.013 1.000 6.256 0.000
For each test hypothesis, the probability of rejecting the null hypothesis of strict-neutrality (dN=dS) as well as the probability of rejecting the null hypothesis of strict-neutrality (dN=dS) in favor of the alternative hypothesis of positive selection (dN>dS) or purifying selection (dN<dS) were expressed asPvalues. Values ofP less than 0.05 are considered significant.dSanddNare the numbers of synonymous and nonsynonymous substitutions per site, respectively
aestuarii across the Eastern Mediterranean Basin. In- deed, type II sequences were only found in Tunisian (Monastir, Chebba, Sfax and Djerba) and Libyan (Tripoli and Mosrata) populations. On the other hand, type III sequences were mostly found in specimens from Greece (with increasing frequency in Lefkada, Navarino, and Alexandroupolis) and Turkey (Figs. 2 and 3a) to the extent that Alexandroupolis and the Turkish populations do not contain Cox1 type I, present in all other examined populations (Fig. 3a).
Hence, the exclusive pattern of distribution of Cox1 type III in the Aegean Sea and the Sea of Marmara (Figs.2and3b) and its lacking in the remaining investi- gated distribution range supports the existence of a phylogeographic break across the Eastern Mediterra- nean. The likely existence of geographic separation was supported and confirmed by the outcome of PERMUT analyses. Calculations of NST (0.211) and GST (0.121) revealed that the NSTvalue is significantly higher than the GSTvalue (P< 0.05), inferring significant relationship between phylogeny and the geographical distribution of haplotypes, and indicating the existence of marked phylo- geographic structure within the examined material.
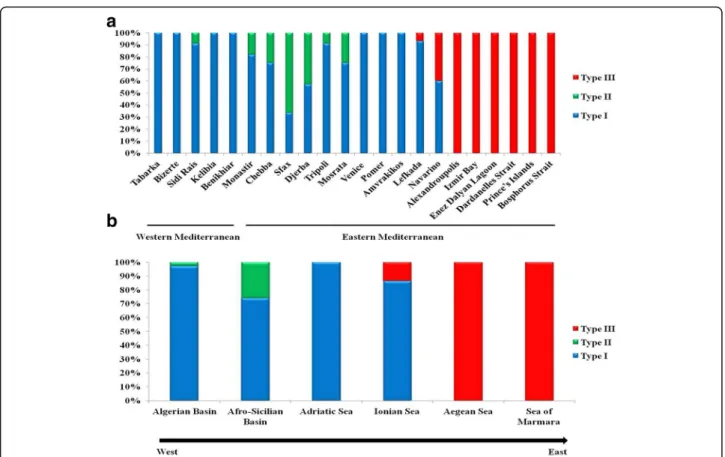
Distribution patterns of the divergent Cox1 types across the surveyed geographic region and clinal variation analysis All three recorded Cox1 types occur in the Eastern Medi- terranean (Fig.3a). This clearly contrasts with distribution patterns in the Western Mediterranean, where almost ex- clusively one genetic type (type I) prevails (as evidenced by the present study (Fig. 3a) and the former study by Ragionieri et al. [35]). It should be noted that no popula- tion harbours all three types. Both genetic types I and II have been shown to co-exist only in the Tunisian and Lib- yan populations; while types I and III are recorded to- gether in the two Greek populations of Lefkada and Navarino (Fig. 3a). Of particular interest to this study is the pattern of geographic distribution and transition of Cox1 types I and III along the Greek coastline, which might reflect a marked longitudinal cline. The proportion of type I, for example, decreased notably from the west- ernmost population of Amvrakikos (exclusively present) to the easternmost location of Alexandroupolis (where it was lacking) (Fig.3a). This can also be clearly observed at the regional level. Indeed, a gradual decrease in propor- tion of type I was shown from the Adriatic Sea to the Aegean Sea (Fig.3b).
Fig. 3Distribution patterns of types I, II and III ofCarcinus aestuariiCox1 gene across western and eastern Mediterranean basins (a) as well as geographic regions (b) (as defined in Table1)
Divergence estimation among Cox1 haplogroups
The outcome of Bayesian phylogenetic analysis, as imple- mented in BEAST, confirmed the results inferred from the TCS parsimony procedure, yielding a noticeable separ- ation between the highly differentiated type III and the monophyletic group composed of both types I and II. As- suming i) a 5.59 Myr split (see [8]) betweenC. aestuarii and C. maenasas calibration point and ii) a Birth-Death prior and uncorrelated lognormal relaxed clock, diver- gence among type III and the monophyletic group com- posed of types I and II was estimated to occur approximately around 1.54 Mya (95% HPD - high poster- ior density interval: 0.88–2.67 Mya). Using a strict mo- lecular clock with a species-specific mutation rate of 3.
86% per Myr (calculated and used by Marino et al. [23]
for Carcinus), and assuming a GTR model of sequence evolution and a coalescent tree prior, involving all the intraspecific data ofC. aestuarii, the estimated time of the split between Cox1 type III and both types I and II was relatively younger (0.8 Mya; 95% HPD: 0.54–1.05 Mya).
Population genetic structure and phylogeographic examination
The one-level AMOVA gives evidence for strong and highly significant genetic differentiation among the ex- amined populations of C. aestuariibased on Tajima-Nei distances (ΦST= 0.615,P< 0.001) and haplotype frequen- cies (FST= 0.109, P< 0.001). This differentiation was more pronounced based on nucleotide divergence (more than 61% of the variation among populations). Pairwise comparisons of genetic differentiation, estimated from nucleotide divergence and haplotype frequencies, also yielded significant differences for most comparisons and revealed, in particular, a clear genetic distinctiveness of the populations of Alexandroupolis, Izmir Bay, Enez Dalyan Lagoon, Dardanelles Strait, Prince’s Islands and Bosphorus Strait, after B-Y FDR correction (Table 3).
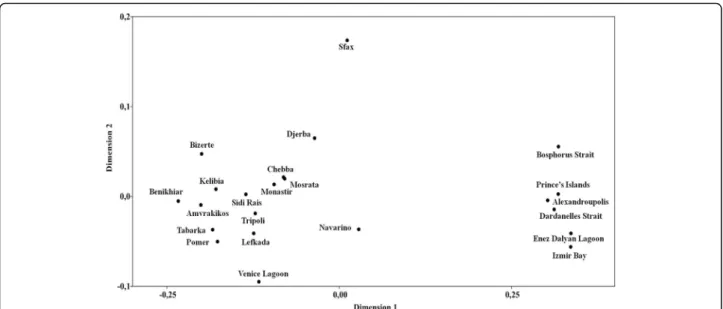
The outcome of pairwise comparisons between these latter populations did not reveal significant differences, highlighting the existence of pronounced genetic diver- gence between populations from the Aegean Sea and the Sea of Marmara, and those assigned to the remaining distribution area. This trend of separation was also con- firmed by the outcome of a Multidimensional Scaling (MDS) analysis, based on Tajima-Nei distances (Fig. 4), suggesting a kind of parapatric genetic divergence among two adjacent geographic groups of C. aestuarii.
A significant relationship was found between genetic and geographic distances (r= 0.189, P= 0.002) by means of a Mantel Test, supporting an isolation by distance hy- pothesis to better explain the population separation.
Population genetic structure was examined by means of two-level AMOVA, testing for partitioning of genetic variation under alternative biogeographic hypotheses
(based on the geographic origin of examined popula- tions, the outcome of haplotype network and the out- come of pairwise comparisons of genetic differentiation).
Our results showed significant genetic structure under these various grouping schemes (Table 4). Indeed, be- sides the significant genetic subdivision across the Siculo-Tunisian Strait (ΦCT= 0.164, P< 0.05;FCT= 0.082, P< 0.01), a significant and more pronounced genetic separation within C. aestuarii (ΦCT= 0.598, P< 0.001;
FCT= 0.079, P< 0.001) was also revealed when testing differentiation among Mediterranean sub-basins (biogeo- graphic hypothesis 2; Table 4), defined according to Spalding’s marine ecoregions [92]. Notably, even if all AMOVA results for most of the tested alternative biogeo- graphic hypotheses highlighted significant but relatively similar results, partitioning of the genetic variance among the two adjacent genetic groups (separating the Aegean and Marmara Seas from the remaining distribution area) yielded the highest ΦCT and FCT levels (ΦCT= 0.754, P< 0.001; FCT= 0.159, P< 0.001). It also explained most of the population genetic structure of C. aestuarii (more than 75% of genetic variance explained between groups, based on nucleotide divergence; and nearly 16% of inter-group variance discerned according to haplotype frequencies; Table 4). The outcome of spatial analysis of molecular variance (SAMOVA), proposing the number of population groups based on geographical and genetic distances without a prior assumption of group compos- ition, showed that partitioning of variance among groups (ΦCT) was highest with two hierarchical groups (K= 2:
ΦCT= 0.750,P< 0.001; Table 5). It should be highlighted that even if slight differences exist between the generated ΦCTvalues (inferred from the different predefined num- bers of group (K)), the selected significant grouping of K= 2 (corresponding to the highest partitioning of variance among groups) matches perfectly the results inferred from the outcomes of pairwise comparisons of genetic differentiation and MDS plots. Besides, the concordance in the outcome of the two different ap- proaches defining the population structure pattern (with (AMOVA) or without (SAMOVA) a prior structure par- ameter) consolidate the hypothesis that most of popula- tion genetic structure within C. aestuarii is explained assuming two hierarchical groups. Accordingly, this perfect agreement between results of different analyses assures the correct delineation of population structure and verifies and confirms the choice of the SAMOVA grouping of K= 2. Such pattern of genetic differenti- ation highlights the existence of a barrier to gene flow between two delineated (and adjacent) geographic groups within C. aestuarii in the Eastern Mediterranean Basin. The first group, harbouring mainly types I and II, covered mostly the North African coast as well as the Adriatic and Ionian seas; while the second group,