Research Collection
Master Thesis
Personality Trait Prediction Based on Smartphone Usage in the Wild
Author(s):
Kovacevic, Nikola Publication Date:
2021
Permanent Link:
https://doi.org/10.3929/ethz-b-000477330
Rights / License:
In Copyright - Non-Commercial Use Permitted
This page was generated automatically upon download from the ETH Zurich Research Collection. For more
information please consult the Terms of use.
Personality Trait Prediction Based on Smartphone Usage in the Wild
Nikola Kovaˇcevi´c
Master Thesis March 2021
Prof. Dr. Markus Gross
Supervisors:
Rafael Wampfler
Prof. Dr. Christian Holz
Prof. Dr. Tobias Günther
Abstract
Imbuing computers with the ability to perceive and interpret a user’s affective traits and char-
acteristics has been a key objective in interactive technologies, as it allows devices to adapt
their behaviour according to the user’s particular needs. For example, personality-aware recom-
mender systems could provide better suited product offerings and employers’ interview systems
could find tailored roles for applicants based on their traits. To become personality-aware, de-
vices need to infer the user’s traits through the available modalities for sensing input from the
user, ideally unobtrusively and integrated with the user’s regular interaction. Additionally, they
also need to produce such predictions in real-time. In this work, we present a learning-based
method for predicting the Big Five personality traits and depression level of a person from the
time-stamped touch coordinates captured while using a mobile phone. Our implementation is
built around a support vector machine and achieves a classification accuracy of up to 84%, pre-
dicting whether each trait and depression is expressed at a low or high level. Our findings show
that the most predictive features vary greatly across personality traits, indicating that each trait
should be considered separately. While typing speed alone is most relevant to predict extraver-
sion, we found that spatial properties of typing behavior are more significant for depression
levels. This suggests that to predict depression, the typed content matters more than higher-
level features such as typing speed or touch frequency. We compare our model to previous
approaches and show that it outperforms the accuracy of previous approaches as well as the
speed of prediction. We believe that our unobtrusive approach to estimating affective traits is
an important step towards personality-aware devices and user-centered computing.
Zusammenfassung
Computer mit der Fähigkeit auszustatten, affektive Eigenschaften und Charakteristika eines Benutzers wahrzunehmen und zu deuten, ist ein zentrales Ziel von interaktiven Technologien, weil es den Geräten dadurch ermöglicht wird, ihr Verhalten den Bedürfnissen des Benutzers anzupassen. Beispielsweise können Empfehlungssysteme besser passende Produktangebote anzeigen, und Befragungssysteme von Arbeitgebern können massgeschneiderte Rollen für ihre Bewerber finden. Um sich der Persönlichkeitsmerkmale eines Benutzers bewusst zu werden, müssen die Geräte die Merkmale durch die zur Verfügung stehenden Modalitäten erschliessen können. Idealerweise würde dies auf unaufdringliche Art und Weise und integriert in die nor- male Benutzerinteraktion passieren. Zusätzlich sollten die Vorhersagen in Echtzeit geschehen.
In dieser Arbeit präsentieren wir eine lernbasierte Methode zur Vorhersage der Big Fiver Per- sönlichkeitsmerkmale und des Depressionsgrads einer Person anhand von zeitgestempelten Touch-Koordinaten, welche während der Benutzung eines Mobiltelefons gesammelt werden.
Unsere Implementation baut auf einer Support Vector Machine und erreicht eine Klassifizierungs-
genauigkeit von bis zu 84%, wobei vorhergesagt wird, ob ein Merkmal sich auf einem hohen
oder niedrigen Level zeigt. Unsere Ergebnisse zeigen, dass sich die am meist prädiktiven Fea-
tures von Merkmal zu Merkmal stark unterscheiden, was darauf hindeutet, dass jedes Merk-
mal separat betrachtet werden soll. Während die Tippgeschwindigkeit für die Vorhersage von
Extraversion am relevantesten war, zeigte sich, dass räumliche Tippcharakteristika für den De-
pressionsgrad relevanter waren. Dies deutet darauf hin, dass für die Vorhersage vom Depres-
sionsgrad der getippte Inhalt von grösserer Bedeutung ist, als Features hörerer Ordnung wie
zum Beispiel die Tippgeschwindigkeit oder die Tippfrequenz. Wir vergleichen unser Modell
mit vorherigen Ansätzen und zeigen, dass unser Modell nicht nur eine höhere Vorhersagege-
nauigkeit erzielt, sondern auch eine kürzere Vorhersagezeit beansprucht. Wir sind der Überzeu-
gung, dass unser Ansatz zur Bestimmung von affektiven Merkmalen ein wichtiger Schritt in
Richtung kontextbewusste und benutzerzentrierte Geräte darstellt.
Master Thesis
Personality Trait Prediction Based on Smartphone Usage in the Wild
Project Description
Personality traits and mental health (i.e., depression level) influence our thinking, mood, and behavior, and they have an impact on everyday life. We have conducted an extensive user study where we have collected smartphone data (i.e., sensor, touch and context data) in the wild. In addition, each user filled in a survey capturing the personality traits and mental health. In this thesis, we want to build a predictive model of the personality and mental health of the users based on the smartphone data and provide unobtrusive visual feedback to the users on Android devices (e.g., as part of a calendar). Such a model together with an appropriate visualization can help to detect and treat mental health problems early, adapt applications according to the personality trait of a user and it can be used as a supporting tool in a therapeutic setting.
Tasks
The main task of the thesis is the development of a data-driven model for predicting the personality trait of a user based on smartphone data gathered in the wild. The model should be able to predict the big five personality traits (i.e., openness, conscientiousness, extraversion, agreeableness, and neuroticism) including the different facets and mental health (i.e., depression level). Furthermore, a visualization of the personality traits and mental health should provide meaningful feedback to the user. The four main tasks of this thesis are
• Validation and statistical analysis of the smartphone and survey data.
• Creating a predictive model for the personality traits based on features extracted from the recorded smartphone data (i.e., sensor data, touch data, and context data).
• Analyzing the best performing model and adapting the model to predict mental health based on the smartphone data.
• Designing a visualization for the different personality traits and mental health and implementing the visualization in an Android application and connecting the visualization with the prediction from the best performing model (e.g., by incorporating the model into the Android application).
Remarks
The thesis is conducted by Nikola Kovacevic. A written report and an oral presentation conclude the
Acknowledgment
I thank my supervisor Rafael Wampfler for his enormous support and guidance throughout the
different stages of this thesis. Furthermore, I thank the co-supervisors Tobias Günther and
Christian Holz for their valuable input and very helpful advice during this project.
Contents
List of Figures xi
List of Tables xiii
1. Introduction 1
1.1. Focus of This Work . . . . 2
1.2. Thesis Organization . . . . 4
2. Related Work 5 2.1. Personality Traits . . . . 5
2.2. Personality Tests . . . . 6
2.2.1. Big Five Inventory (BFI) . . . . 6
2.2.2. Big Five Inventory 2 (BFI-2) . . . . 6
2.2.3. Patient Health Questionnaire (PHQ-8) . . . . 7
2.2.4. Limitations of Personality Tests . . . . 8
2.3. Personality Trait Classification . . . . 8
2.3.1. Touch-based Trait Classification . . . . 9
2.3.2. Context-based Trait Classification . . . . 9
2.3.3. Sensing-based Trait Classification . . . . 10
2.3.4. NLP-based Trait Classification . . . . 10
2.3.5. Summary and Limitations . . . . 11
2.4. Depression Level Classification . . . . 12
3. Dataset 13 3.1. User Study . . . . 13
3.1.1. Data Collection . . . . 14
3.1.2. Data Labeling . . . . 15
Contents
3.2. Data Validation . . . . 16
3.2.1. Personality Traits and Depression Level . . . . 17
3.2.2. Smartphone Usage . . . . 18
4. Methods 23 4.1. Overview . . . . 23
4.2. Data Pre-processing . . . . 24
4.3. Feature Extraction . . . . 25
4.4. Feature Selection . . . . 26
4.5. Model Selection . . . . 29
5. Results 31 5.1. Model Performance . . . . 31
5.1.1. Feature Selection Pipeline . . . . 31
5.1.2. Window Averaging . . . . 33
5.2. Feature Importance . . . . 34
5.3. Timing Experiments . . . . 35
6. Conclusion 39 7. Future Work 43 A. Appendix 45 A.1. Big-Five Inventory 2 . . . . 45
A.2. Patient Health Questionnaire PHQ-8 . . . . 48
A.3. List of Collected Data . . . . 49
A.4. List of Best Parameters . . . . 51
Bibliography 52
List of Figures
1.1. Process Overview . . . . 3
3.1. Custom Keyboard . . . . 14
3.2. Demographics . . . . 16
3.3. Distribution of Personality Characteristics . . . . 18
3.4. Radial Personality Plots . . . . 19
3.5. Absoule Changes of Traits . . . . 20
3.6. Heat Map Example . . . . 21
4.1. Feature Selection Thresholding Example . . . . 30
5.1. Average Typing Duration . . . . 32
5.2. Window Averaging for SVM . . . . 33
5.3. Feature Importance . . . . 36
List of Tables
2.1. The Big Five Traits and some Adjectives . . . . 6
2.2. Traits and Facets . . . . 7
2.3. Mean Personality Traits . . . . 7
2.4. Performance Overview from Related Work . . . . 11
3.1. Overview of Collected Data . . . . 15
3.2. Mean Personality Traits . . . . 17
4.1. Overview of Available Features . . . . 27
4.2. Overview of Time Series . . . . 28
5.1. Influence of Feature Selection . . . . 32
5.2. Performance Overview . . . . 34
A.1. BFI-2 Questionnaire . . . . 45
A.2. PHQ-8 Questionnaire . . . . 48
A.3. Exhaustive List of Collected Data . . . . 49
A.4. Best Parameters . . . . 51
1
Introduction
Personality traits reflect an individual’s tendencies to think, feel and behave in a certain way.
They have a direct influence on our behavior and often remain stable over decades [HBJD16].
Having knowledge about a person’s personality traits can be of use in various scenarios such as in personnel recruitment where an employer could tailor the personality of interest beforehand according to the company’s needs and then screen out candidates based on their personality test scores or find tailored roles for the applicants based on their traits [Bla95]. Furthermore, personality traits are of interest for context-aware recommender systems because, based on the intensity of the traits, recommendations can be made more accurately for single users or even for a group of users [BER15, RGJDSRDA09]. Knowing the personality traits can also be help- ful in a therapeutic setting where the goal is to improve a trait that is considered negative or hinders persons in their everyday life. Using a personality test, progress over time can then be tracked [MOC14]. Apart from personality traits, interest has also been shown in assessing a per- son’s depression level. Being one of the most common mental disorders worldwide, depression can have a big impact on a person’s social and physical well-being, especially for adolescents.
And yet, depression often remains undetected [YMK10]. Hence, early detection of an elevated depression level would be beneficial in such cases.
Personality traits and depression level can be assessed using pen-and-paper personality tests. A
broadly used model for assessing the traits is the Five Factor Model [MJ92] which describes the
personality as a combination of five traits, namely openness to experience, conscientiousness,
extraversion, agreeableness and neuroticism, often abbreviated in the acronym OCEAN. The
intensity of each trait is assessed by posing a number of questions to the examinee. The test
answers are then, depending on the test in use, aggregated to yield a final intensity score per
trait. However, the problem with common pen-and-paper personality tests is that people can
still be dishonest and distort their scores in high-stake situations like job interviews by figuring
out which trait is being assessed by which question and then answering according to the result
they want to obtain [Fah18]. Furthermore, people might subconsciously distort their scores
by answering according to an ideal they have and not according to their actual personality
1. Introduction
due to self-deception phenomena [MCD + 07, ZMR11]. This demands for a way that hides the obviousness of the questions and makes the testing procedure more reliable.
One way to achieve this is to use data from an input modality that is influenced by a person’s personality but where the causal relationship is non-trivial, and then infer the traits based on information extracted from this data. Smartphones and other smart devices have become an integral part of our everyday life and produce a vast amount of data on a daily basis. Using such data to infer a person’s personality has been the goal of several studies [KTVA18, BTK + 19, CBGP11, KBFH08, MWKG20]. It has been shown that based on smartphone usage patterns it is possible to assess whether the intensity of a certain personality trait lies below or above a global median with an accuracy ranging from 68% (conscientiousness) up to 76% (extraver- sion) [CBGP11]. This indicates that there is a causal relationship between a person’s personality traits and the way people use their smartphones.
1.1. Focus of This Work
Although there are several studies that found a relationship between personality traits and col- lected user data from smartphones and other smart devices, some yet have to be validated in an in-the-wild setting. Furthermore, well-performing approaches such as the work by Chittaranjan et al. [CBGP11] rely on data that has been aggregated on a monthly level, which might not be feasible for most of the applications mentioned at the beginning, and it is not clear how shorter data collection periods influence the performance of the suggested model. Other approaches such as the work by Mesot et al. [MWKG20] rely on analyzing the semantics of chat conver- sations, which could be considered as privacy-invasive and may not be tolerated in a real-world application. Furthermore, manual feature engineering and feature selection play an important role in all of the mentioned approaches, which implies some domain expertise and knowledge about the types of features that might be predictive for the task. However, we believe that an automated feature engineering and feature selection approach might be beneficial since it could capture predictive features where the causal link between the feature and the trait may seem counter-intuitive.
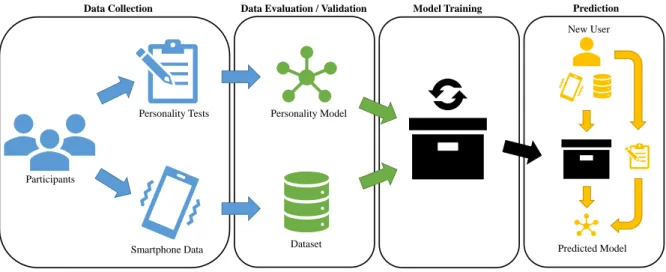
Figure 1.1 visualizes the pipeline of this work divided into four stages. The first stage consists
of collecting the training data and the corresponding labels. In a user study, various types
of smartphone data were collected over a period of 10 weeks, and two personality tests were
used to obtain ground truth labels for the personality traits and depression level. The second
stage consist of validating and pre-processing the data, which includes feature extraction and
selection. In a third phase, a machine learning model is trained on the cleaned and validated
dataset. In a final stage, a personality model based on unseen data from a new user is generated
from the predictions, whereby the resulting personality model should be as close as possible to
the outcome of a personality test if this new user had taken the test beforehand. This is why
the rightmost yellow path in Figure 1.1 is not a direct link from the user to the personality, but
signalizes that the personality test constitutes an intermediate step and that the prediction is not
directly connected to the person, but to the outcome of a potential personality test.
1.1. Focus of This Work
Participants
Personality Tests
Smartphone Data
Personality Model
Dataset
New User
Predicted Model
Data Collection Data Evaluation / Validation Model Training Prediction
Figure 1.1.: Process Overview. The first stage consists of collecting the smartphone data and the corre- sponding ground truth labels using personality tests. In the next stage, the tests are evaluated and the collected data is pre-processed and structured. Then, a machine learning model is trained on the collected dataset to classify the traits of the participants into two classes (high and low) from usage patterns in the smartphone data. Based on unseen data of a new user, the model should be able to output a prediction that is as close as possible to the personality model that would have been obtained if the new user had taken the personality tests.
In this work we show how an SVM classifier can be used to infer personality traits from typing patterns while eradicating the limitations from related work. Concretely, our contributions are as follows: We present a way to classify the OCEAN personality traits and depression level into two classes obtained by using the population median as the separation margin by
1. automating the feature engineering and feature selection process, 2. using less privacy-invasive data collected in an in-the-wild setting, and 3. requiring only a few days of data collection.
We show that short time windows of only one day can already be predictive with a mean accu-
racy of up to 69%. Furthermore, we explain how the predictions of multiple 1-day windows can
be combined to increase the accuracy substantially, reaching a peak accuracy of 84%. Addition-
ally, we conclude that the most predictive features vary greatly across the traits, indicating that
one separate model should be considered for each trait. High-level features such as typing speed
or typing frequency are of big relevance for extraversion, agreeableness and conscientiousness
while the raw x and y coordinates and their sum are most relevant for neuroticism, openness
and depression level.
1. Introduction
1.2. Thesis Organization
In Chapter 2, we examine different methods for measuring personality traits and explain how in-
formation about a person’s personality traits can be useful in practice. Furthermore, an overview
of existing trait prediction methods is given. In Chapter 3, we explain our data collection pro-
cess and how the user study was conducted. We also give a detailed analysis and validation of
the collected data. In Chapter 4, we present our full feature selection and extraction pipeline
and explain the design choices step by step. The chapter is concluded by introducing our best
performing model. In Chapter 5, we present quantitative results by comparing our model to
other approaches from related work and discuss alternatives to our approach. Chapters 6 and 7
conclude previous discussions and focus on future work, respectively.
2
Related Work
This chapter covers the theory behind personality traits and gives an overview of the results from previous work. First of all, the notion of personality traits is discussed in general, be- fore concrete models for assessing the traits are presented. Afterwards, various approaches for predicting a user’s personality traits and depression level based on different input modalities are discussed. The chapter is concluded with a quantitative overview that puts the individual achievements of previous work into context.
2.1. Personality Traits
In the 1920s, psychological trait theory emerged in the field of psychology [All27]. It tried to explain differences in personality by introducing so called personality traits that were believed to be indicative for a person’s behaviour and can explain individual differences in how a person experiences and copes with different situations. Personality traits have a direct influence on our thoughts, feelings and behaviour, and they often remain stable over decades [HBJD16]. Hence, personality is considered to be a linear combination of personality traits. In order to reduce the number of traits and unify trait theory into an integral personality model, a factor analysis seeking a minimal set of traits that covers best the variability in all personalities was performed.
This factor analysis resulted in the so-called Five Factor Model [MJ92] and consists of five
traits, openness to experience, conscientiousness, extraversion, agreeableness and neuroticism,
which are often abbreviated in the acronym OCEAN. Each trait influences different aspects of
our personality but they are not pairwise exclusive, i.e., some behavioral characteristics can be
part of two traits at once. This is due to the fact that the factor analysis does not result in a
perfectly orthogonal space. A set of adjectives that describe each trait in more detail can be
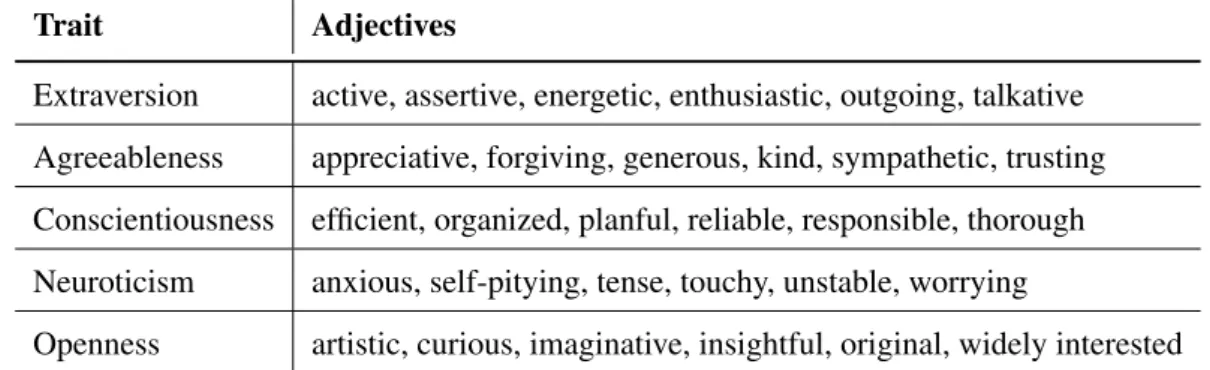
found in Table 2.1.
2. Related Work
Trait Adjectives
Extraversion active, assertive, energetic, enthusiastic, outgoing, talkative Agreeableness appreciative, forgiving, generous, kind, sympathetic, trusting Conscientiousness efficient, organized, planful, reliable, responsible, thorough Neuroticism anxious, self-pitying, tense, touchy, unstable, worrying
Openness artistic, curious, imaginative, insightful, original, widely interested
Table 2.1.: The Big Five personality traits and some describing adjectives introduced by McCrae et al. [MJ92].
2.2. Personality Tests
The use of tests for evaluating a person’s skills and abilities dates back to the Han dynasty in China (202 BC to 220 AD) [KS08]. In Europe, however, such tests did not become relevant until World War I. The Woodworth Personal Data Sheet (WPDS) was one of the first personality tests used on a large scale [Woo32]. It should assess a military recruit’s emotional stability without the need of a time-consuming psychiatric interview, but rather using an easy and fast pen-and-paper test. This sudden demand for large scale testing gave rise to various approaches for creating, evaluating and interpreting such tests. As a consequence, many different testing schemes emerged in various fields [KS08].
2.2.1. Big Five Inventory (BFI)
One of the personality tests that assesses the OCEAN traits is the Big Five Inventory (BFI) [Gol92].
It quantifies the intensity of the OCEAN traits by assigning each trait a score denoting the in- tensity of the trait in a person’s personality. It consists of 44 statements that are rated on a 5-point Likert scale, indicating how strongly a person agrees or disagrees with the statement.
Each statement belongs to one trait whereby there are 8 to 10 statements per trait. Some of the statements were semantically inverted, meaning that for these statements a high rating would yield a low intensity in the respective trait. This was necessary because having only equally po- larized statements has shown to be a disruptive element in questionnaires [DAR15]. The ratings of all statements belonging to a trait are aggregated (either summed up, averaged or normalized to [0, 1]) to obtain the final test score whereby the ratings of semantically inverted statements are inverted as well in order to compensate for the change in polarization. The personality is eventually represented as a 5-tuple consisting of one intensity score per trait.
2.2.2. Big Five Inventory 2 (BFI-2)
The original BFI did not include a hierarchical structure that would allow for subdividing the
traits into sub-traits, so called facets. However, this subdivision became more relevant in recent
years because facets would enable a more detailed and comprehensive analysis of a personality.
2.2. Personality Tests Furthermore, the number of semantically inverted and not inverted statements was unequal, par- tially due to the fact that the number of statements was odd for some traits. In order to eradicate these limitations, the Big Five Inventory 2 (BFI-2) was introduced [SJ17]. The statements were revised and adapted in order to make them more understandable and easier to interpret. The number of statements was increased to 60 (12 statements per trait) and half of the statements were semantically inverted to balance the polarity of the statements. In a study with two sam- ple groups (heterogeneous population with N = 1000, and college students with N = 470) the validity and reliability of the revised questionnaire was confirmed [SJ17]. Apart from the five OCEAN traits, the BFI-2 includes fifteen facets (see Table 2.2) and thereby constitutes a hierarchical construct. The statements have been translated into numerous languages such as German, Chinese or Spanish, which allowed to investigate cultural differences around the world. Table 2.3 shows the mean for the OCEAN traits globally and with respect to western Europe [SAM + 07], indicating that there are slight differences.
Extraversion Agreeableness Conscientiousness Neuroticism Openness Sociability Compassion Organization Anxiety Intellectual Curiosity Assertiveness Respectfulness Productiveness Depression Aesthetic Sensitivity Energy Level Trust Responsibility Emotional Volatility Creative Imagination
Table 2.2.: Personality traits and their facets according to the Big Five Inventory 2 [SJ17].
2.2.3. Patient Health Questionnaire (PHQ-8)
Depression is one of the facets of neuroticism as shown in Table 2.2. Nevertheless, it is not meant to assess clinical depression levels because it merely is an indicator for a general incli- nation inside a personality and is no valid diagnostic for depressive disorders. This is why a questionnaire especially for assessing a patient’s mental health called the Patient Health Ques- tionnaire (PHQ-8) [KSS + 09] was developed. It is an 8-item inventory with a structure com- parable to the BFI. The eight statements are rated on a 4-point scale from zero (this statement never applies) to three (this statement applies daily). The ratings are then summed up to yield the final depression level on the range [0, 24]. A study with almost 200,000 participants revealed that the PHQ-8 is a valid diagnostic tool for assessing depression. The authors suggest that a depression level of 10 or higher indicates major depressive disorder or similar depressive disor- ders [KSS + 09]. In total, 8.57% of the participants showed signs of depressive disorder (i.e., a PHQ-8 level ≥ 10). In the rest of this report, depression level always refers to the PHQ-8 and should not be confused with the eponymous facet of neuroticism.
Extraversion Agreeableness Conscientiousness Neuroticism Openness
Mean World 3.34 3.69 3.52 3.01 3.64
Mean Western Europe 3.38 3.56 3.39 2.99 3.71
Table 2.3.: Mean personality traits globally and in western Europe on the range [1, 5] [SAM + 07].
2. Related Work
2.2.4. Limitations of Personality Tests
Although pen-and-paper personality tests are cost- and time-effective compared to psychiatric evaluations, there is a number of limitations. First of all, most tests like the BFI-2 are designed to be easily interpretable and understandable, which makes it easy for the person being tested to distort the score in any desired way. Especially in high-stake situations like job interviews this is a problem since the employer does not get an accurate picture of the applicant [Fah18].
Also, people might unconsciously distort their answers because they lack objectivity when as- sessing their own personality due to self-deception phenomena [MCD + 07, ZMR11]. Taking the test repeatedly (e.g., in a therapeutic setting where the test is retaken multiple times to track progress) may introduce an additional bias because people might remember their answers and be influenced by them when retaking the test. These limitations call into question the test’s validity and reliability, and ask for an alternative to the traditional pen-and-paper tests.
2.3. Personality Trait Classification
Eradicating the obviousness of the test’s structure would mean to find a more complex way to infer a person’s personality by impeding the person from directly and easily manipulat- ing the result. In other words, the goal is to find an input modality that provides data con- taining a causal link to a person’s personality traits. Smartphones and other smart devices produce a big amount of unstructured data obtained from active touch interactions with the user, context information like applications and their usage statistics, but also through vari- ous sensors such as accelerometers, proximity sensors and gyroscopes. Several studies sug- gest that there is a relationship between personality traits and smartphone/computer usage pat- terns [KTVA18, BTK + 19, CBGP11, MWKG20, KBFH08]. All of them used the Five Factor Model [MJ92] or similar as the underlying personality model. The ground truth for the pre- diction task was collected by using a pen-and-paper personality test like the aforementioned BFI-2 or alike. Using these personality tests as ground truth is problematic because they suffer from the limitations described in Section 2.2.4. Thus, the suggested causal link between traits and usage patterns is actually a link between usage patterns and the outcome of a personality test if the respective person would have taken such a test. However, under the assumption that there is no motivation for the participants to consciously distort their scores, the result of the personality test can still be considered as a good approximation to the actual ground truth. The problem of unconsciously distorting the result still remains and cannot be circumvented unless a psychiatric evaluation is performed, which is usually infeasible.
In the following, we present four works based on four different approaches and analyze their
benefits and limitations. Küster et al. [KTVA18] focused on data related to touch events, Chit-
taranjan et al. [CBGP11] addressed data extracted from usage statistics, application informa-
tion, different types of logs such as call logs and messages, Berkovsky et al. [BTK + 19] focused
on inferring personality traits based on eye-tracking data, and Mesot et al. [MWKG20] built
a language model based on text messages in order to infer the traits. Both classification and
regression are viable options for the given task and have been explored in the past (e.g., Khan et
al. [KBFH08] performed a regression analysis). However, classification has been favoured by
all four mentioned works. On one hand, this is because using the population median as a sepa-
2.3. Personality Trait Classification ration margin results in a balanced split while splitting at other values may result in significant class-imbalance due to the personality traits not being neither equally distributed nor centered on the underlying scale. Furthermore, none of the works achieved a classification accuracy higher than 76% for any trait, which is significantly below perfect separation of the two classes and suggests, that classifying the personality traits into two classes is already a hard problem.
2.3.1. Touch-based Trait Classification
In a controlled lab experiment, Küster et al. [KTVA18] investigated the touchscreen usage of 75 participants. The participants were asked to play a spelling game on a tablet for several sessions of two to four minutes while all their touch interactions with the screen were recorded.
Additionally, all participants filled out the NEO-FFI questionnaire [CM89], a personality test similar to the BFI-2 which also uses the Five Factor Model as the underlying personality model.
The scores of the questionnaire were used as ground truth for the classification task whereby all scores were split into two classes using the population median. From the collected data, two classes of features were extracted. On one hand, features related to the touch interaction such as swipe speed, time between touches, touch accuracy, touch duration and their statistical deriva- tives were extracted. On the other hand, features related to the participant’s performance in the spelling game were calculated. In total, 110 features related to touch-behaviour and perfor- mance were extracted and fed into different classifiers. Among the 10 classification algorithms, Support Vector Machines (SVMs), Random Forests (RFs) and Logistic Regression (LR) per- formed best with a mean accuracy between 0.62 (agreeableness) and 0.67 (extraversion). This suggests that touch characteristics are to some extent predictive for a person’s personality.
2.3.2. Context-based Trait Classification
In an in-the-wild experiment, Chittaranjan et al. [CBGP11] recorded different types of anonymi-
zed logs via a software installed on the phones of 83 participants. Four types of logs (calls, SMS,
Bluetooth and application usage) were recorded over a period of eight months and aggregated
on a monthly level. The personality was assessed using the TIPI questionnaire [GRS03], which
is a very brief 10-item inventory that assesses the Big Five personality traits similarly to the
BFI-2. Depending on the type of log, different features were extracted. For the application
logs, the number of uses of a specific app was counted. From the call logs, different statistics
like the number of outgoing calls or the average duration of the calls were calculated. The
Bluetooth logs consisted of statistics about the number of unique Bluetooth IDs and how often
these IDs were seen in a specific time slot. From the SMS logs, average and median word
lengths and the number of sent messages were recorded. In a first step, the features were
de-correlated and normalized. Then, an SVM was used to classify the data points using two
target classes based on the population median. Leave-one-out cross-validation was performed to
obtain the average classification accuracy. An average accuracy between 0.693 (openness) and
0.759 (extraversion) was achieved. To the best of our knowledge, this is the best performance
achieved so far on this particular task of classifying the Big Five personality traits into two
classes by using smartphone usage data.
2. Related Work
2.3.3. Sensing-based Trait Classification
In the two previous sections, the focus was on inferring traits based on usage patterns, i.e., how the user interacts with the device. However, smartphones and other smart devices are also able to collect data unrelated to the actual usage, but rather about how the user is responding physio- logically to surrounding stimuli. Various sensors such as accelerometers, gyroscopes, cameras and proximity sensors are nowadays present in most devices and provide a new modality of collecting user data. Berkovsky et al. [BTK + 19] investigated how eye-tracking data can be used to detect personality traits. In a controlled lab experiment with 21 participants, they first assessed the participants’ personality by using multiple personality tests. Unlike the studies presented in the previous sections, in this study, from the Big Five personality traits neuroti- cism was not assessed. The participants were shown a series of image and video stimuli for 55 minutes. The images and video snippets were selected from annotated databases that cat- egorize the stimuli based on the affective response they trigger in a user, i.e., based on the feeling or characteristics of the feeling that an average user experiences when looking at the stimuli. Eye-tracking glasses were used to record the participant’s saccades and gaze direction.
From the resulting data collection, three types of high-order features were extracted, namely, eye-blinking measures, eye movement and pupillary response measures. Various standard clas- sification algorithms like Support Vector Machines (SVMs), Random Forests (RFs), Logistic Regression (LR), Naïve Bayes (NB), to only name a few, were used to classify the traits into two target classes based on the population median. Leave-one-out cross-validation resulted in a high accuracy for all Big Five traits ranging from 0.857 (openness) to 0.948 (agreeableness).
These results outperform the other two presented approaches in terms of accuracy. However, it has to be noted that the setting is different. In this work, the focus was not to find a general usage pattern that would reveal the traits, but to find a direct link between traits and how the human body responds physiologically to external stimuli. These stimuli were aligned in time during the study, i.e., all participants were shown the same stimuli in the same order. Hence, given a physiological response to a stimulus and the stimulus itself that caused the response, the traits can be predicted with high accuracy. This is not the case for the aforementioned works, which is why quantitatively, these results cannot be compared directly.
2.3.4. NLP-based Trait Classification
Mesot et al. [MWKG20] also focused on touch data, but unlike Küster et al. [KTVA18] (see
Section 2.3.1), they solely focused on touch events from a chat conversation and exploited the
semantics of the written text by using Natural Language Processing (NLP). In a controlled lab
experiment with 70 participants, an experimenter held a chat conversation with the participants
on a smartphone. The touch events were recorded in a session of 60 to 70 minutes. From the
typed text, a language model using Bidirectional Encoder Representations from Transformers
(BERT) [DCLT19] was built for each user. Furthermore, touch heat maps indicating where on
the screen the user touched the most, were extracted. These heat maps were fed into a vari-
ational autoencoder to obtain a low-dimensional latent representation of the heat maps. The
latent vectors of the language model and those of the variational autoencoder showed particular
strengths for individual traits when considered separately. Combining them into one model by
learning the combination weights for each trait separately resulted in considerably high classi-
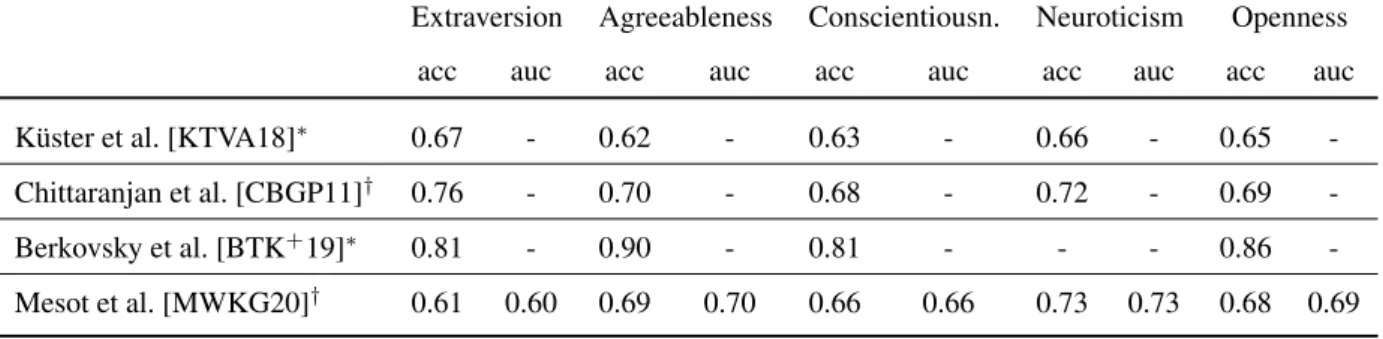
2.3. Personality Trait Classification fication accuracy for all traits (from 0.61 for extraversion up to 0.73 for neuroticism). Unlike other approaches, Mesot et al. also reported the area under the curve (AUC), which describes the performance of a classifier by integrating the true-positive rate as a function of the false-positive rate. The benefit of this metric is that it considers all potential thresholds t that can be used to separate predicted probabilites into the two target classes. This is in contrast to the accuracy metric reported by all previous works where a separation threshold was chosen implicitly.
Extraversion Agreeableness Conscientiousn. Neuroticism Openness
acc auc acc auc acc auc acc auc acc auc
Küster et al. [KTVA18]
∗0.67 - 0.62 - 0.63 - 0.66 - 0.65 -
Chittaranjan et al. [CBGP11]
†0.76 - 0.70 - 0.68 - 0.72 - 0.69 -
Berkovsky et al. [BTK
+19]
∗0.81 - 0.90 - 0.81 - - - 0.86 -
Mesot et al. [MWKG20]
†0.61 0.60 0.69 0.70 0.66 0.66 0.73 0.73 0.68 0.69
∗
p unknown,
†p < 0.05
Table 2.4.: Mean classification accuracy (acc) and area under the curve (auc) on the Big Five personality traits using different approaches. p-values result from repeating the experiment 100 times.
2.3.5. Summary and Limitations
Several studies suggest that a person’s Big Five personality traits can be classified into two classes (low and high) with an accuracy of up to 76% (see Table 2.4) given general usage patterns like context information or direct touch interactions. Furthermore, sensing technolo- gies can be used to very accurately detect personality traits based on physiological responses triggered by external stimuli. Although not directly comparable to the other approaches, this method achieves the highest accuracy (see Table 2.4).
The approaches by Küster et al. [KTVA18] and Mesot et al. [MWKG20] report results in a controlled lab experiment, and in-the-wild performance data needs yet to be collected to see how well the approaches work in practice. Additionally, the approach by Mesot et al. [MWKG20]
might be subjectively considered to be privacy-invasive since it interprets the written text and
understands the semantics of what was written. It is also limited to languages where a language
model can be built accurately. This is not the case for languages like Swiss-German where
no universal grammar is defined. Chittaranjan et al. [CBGP11] achieve a high classificaiton
accuracy, but at the cost of needing one month of data to perform the actual prediction since the
training data was aggregated on a monthly level. Thus, it is not clear how shorter aggregation
windows would impact the classification performance. Depending on the application, a user
might not be willing to wait a whole month for a first prediction. Also, privacy-invasiveness
might be an issue. Although it is subjective to say what is privacy-invasive and what is not,
there might be users that would not agree to allow the collection of their messages, phone logs,
application names and usage times, etc. Berkovsky et al. [BTK + 19] used eye-tracking data
and achieved a very high accuracy, however at the cost of needing the user’s attention in order
to assess the traits. Unlike the other two works, the traits are not assessed passively in the
background.
2. Related Work
Although both Küster et al. [KTVA18] and Chittaranjan et al. [CBGP11] use very different approaches, they both rely on hand-crafted features that imply (at least to some extent) domain knowledge and expertise. Depending on the type of collected data, it may not be clear a priori which features are predictive, and domain knowledge might be missing. It would therefore be desirable to have an automatic feature extraction and selection process, independent of the type of data that is being researched. In the following chapters we show how such a process looks like.
2.4. Depression Level Classification
Similar to trait classification, depression level classification can be tackled using various ap- proaches. De Choudhury et al. [DCGCH13] classified Twitter users into classes of high and low depression level by analyzing their posts using different linguistic approaches. They achieved a prediction accuracy of up to 72.4% using SVM classifiers. A potential drawback of this ap- proach is that social media data may be sensitive, and analyzing them can be considered privacy- invasive which may not be tolerated by some users. Furthermore, one year of Twitter posts was analyzed, which would further complicate the use of this approach in a real-world application because this amount of data might not be available and depression level may change multiple times during this period. Farhan et al. [FYM + 16] predicted depression by using activity data obtained from smartphone sensors and GPS trackers. Depending on the amount of activity and patterns in the GPS location and movement collected over 14 days, depression was classified with a mean F1-score of up to 0.82. However, a professional psychiatric evaluation was per- formed to obtain the ground truth, which is time-consuming and costly in practice. While this is not a problem at the time when a potential application is deployed, it may be a problem during training when a bigger data set is used for training. Additionally, 14 consecutive days with good data quality were required to make a prediction, which could in practice result in much longer prediction intervals. Ware et al. [WYM + 20] predicted not only depression but also depression symptoms using a very similar approach to Farhan et al., i.e., they also used smartphone sens- ing data and location data. However, the location data was not obtained from GPS trackers but from WiFi infrastructure. Predictions were again made on 14-day-intervals if the data quality and amount of data were sufficient. An F1-score of up to 0.83 was achieved for some depression symptoms, which is comparable to previous work from Farhan et al. [FYM + 16]. The ground truth was not assessed by a professional, however, an oral face-to-face assessment using health questionnaires was conducted. While this is less costly than a professional psychiatric eval- uation, it is still time-consuming. Furthermore, the problem with potentially long prediction intervals still remains.
In summary, several approaches for predicting depression level have been developed, but the
limitations of these approaches are similar to the problems regarding personality traits described
in Section 2.2.4. Time-consuming elements such as long prediction intervals and privacy-
invasive data collection shall be eradicated by proposing a way to infer the depression level
in a fast, passive and non-privacy-invasive way. The following chapters show a way of achiev-
ing these goals.
3
Dataset
This chapter presents the dataset in detail. First, the data collection process is explained, cover- ing the collection of the groundtruth using personality tests, as well as the recording of various types of context, interaction and sensor data. In a next step, the collected data is statistically analyzed and validated. In a final step, the dataset is cleaned by excluding participants where the data validation revealed anomalies.
3.1. User Study
As has been shown in Chapter 2, there are several ways to tackle the problem of finding a
data source that reveals information about a user’s personality traits. Context information,
interaction- and sensor data have all been shown to be indicative of personality traits. Our goal
is to use a data source where limitations such as long data collection time, privacy-invasiveness
and additional user effort (see Section 2.3.5) do not arise. Hence, we seek a data source that
is predictive for the personality traits, non-privacy-invasive, and can also be collected unobtru-
sively without additional effort from the user in a short period of time. We rule out all types of
data related to context information because of potential privacy issues. Also, we forego NLP-
based approaches using touch data for the same reason. However, we do not discard touch data
entirely since raw touch data without analyzing any semantics may still be of use. Sensor data
obtained from built-in sensors are also a viable data source since they are readily accessible
and do not suffer from the mentioned limitations. The data of interest consists therefore of raw
touch data and sensor data from built-in phone sensors.
3. Dataset
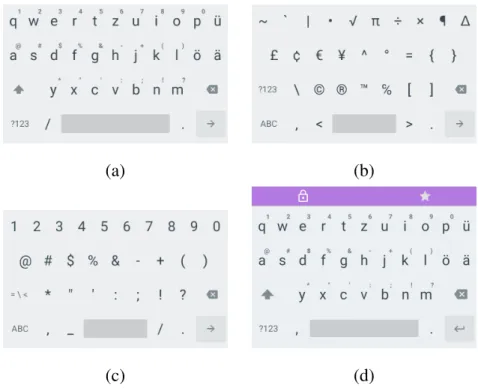
(a) (b)
(c) (d)
Figure 3.1.: Screenshots from the custom keyboard showing the main alphabet in (a), the additional symbols and numbers in (b) and (c), and the main alphabet in private mode (d). The private mode is visualized by displaying a purple bar with a lock.
3.1.1. Data Collection
The dataset used in this work was embedded in a more broad research context which is not limited to the purpose of this work. The data collection was carried out in an in-the-wild setting with 82 participants over a period of 10 weeks by using a data collection app implemented for this study. From the diverse types of collected data, only a subset is relevant for this work and is described in Table 3.1. A full list of all collected types of data can be found in Appendix A.
It has to be noted that comparability easily becomes an issue when many different devices come
into play, which is why it should be considered beforehand. Screen size, different keyboard lay-
outs and diverse built-in sensors can complicate direct comparability. As for the keyboards,
all participants were asked to switch to a custom keyboard provided by the collection app (see
Figure 3.1). Depending on the screen size and the device’s orientation, we normalized the touch
events to the range [0, 1]× [0, 1] in a post-processing step, which makes all touch events directly
comparable. Another reason for using a custom keyboard is that otherwise direct access on
the touch events is impeded unless the phone is rooted because the event handling is entirely
carried out by the system. Using the custom keyboard, the event handling becomes visible to
the keyboard which can then record the events. Although it was stressed in advance that only
raw x and y coordinates were going to be logged during the study and that the corresponding
keys were neither going to be logged nor analyzed, it would generally still be possible to re-
trieve the typed text by mapping the touch coordinates on the keyboard. Since this may have
raised privacy issues, a private mode for entering passwords, e-mail addresses or other sensitive
information was added to the keyboard in order to provide full control over the data collection
to the participants. The private mode was active by default whenever password fields or other
3.1. User Study text fields related to sensitive information were being filled out. Additionally, the users could activate the private mode manually by pressing the lock in the header of the keyboard depicted in Figure 3.1 (d) for three seconds. The header of the keyboard was shown in purple to signalize that the private mode was active. The data collection was stopped entirely every time the private mode was activated either manually or automatically, and was resumed as soon as the private mode was deactivated again. As for the sensors, luckily, most built-in physical sensors like accelerometers or gyroscopes nowadays use the same units to express measurements, which makes sensor data usually directly comparable.
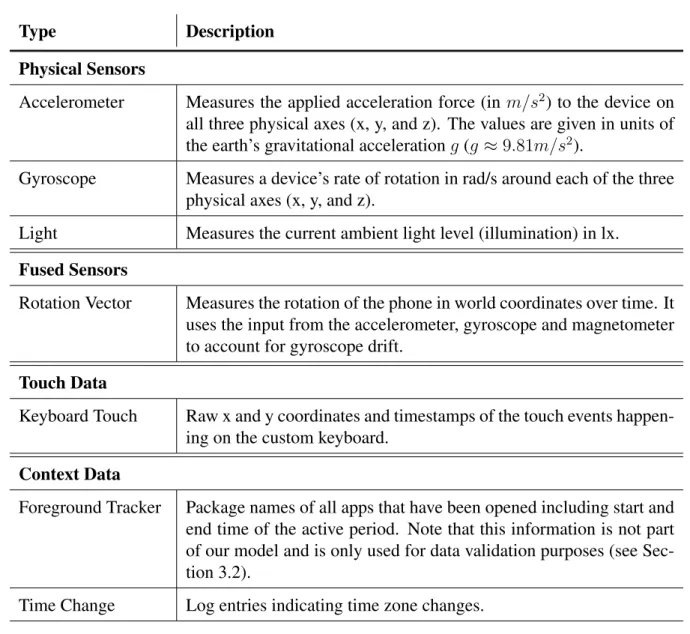
Type Description
Physical Sensors
Accelerometer Measures the applied acceleration force (in m/s 2 ) to the device on all three physical axes (x, y, and z). The values are given in units of the earth’s gravitational acceleration g (g ≈ 9.81m/s 2 ).
Gyroscope Measures a device’s rate of rotation in rad/s around each of the three physical axes (x, y, and z).
Light Measures the current ambient light level (illumination) in lx.
Fused Sensors
Rotation Vector Measures the rotation of the phone in world coordinates over time. It uses the input from the accelerometer, gyroscope and magnetometer to account for gyroscope drift.
Touch Data
Keyboard Touch Raw x and y coordinates and timestamps of the touch events happen- ing on the custom keyboard.
Context Data
Foreground Tracker Package names of all apps that have been opened including start and end time of the active period. Note that this information is not part of our model and is only used for data validation purposes (see Sec- tion 3.2).
Time Change Log entries indicating time zone changes.
Table 3.1.: Overview of the types of collected data that are relevant in this work.
3.1.2. Data Labeling
As a ground truth measure for the personality traits and the depression level, a German version
of the BFI-2 [SJ17] as introduced in Section 2.2.2, and the PHQ-8 as introduced in Section 2.2.3
were used, respectively. The statements used in the questionnaires can be found in Appendix A.
3. Dataset
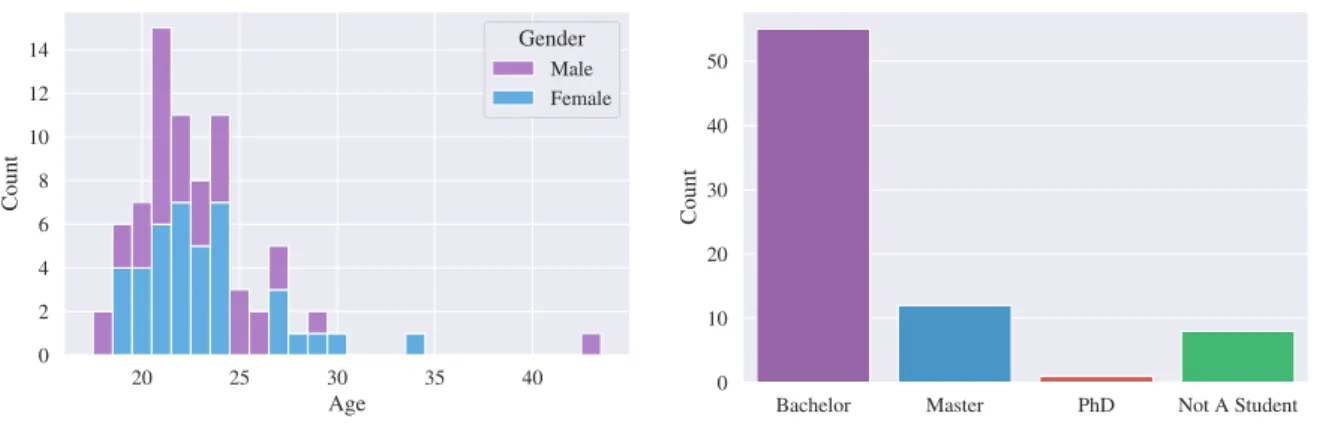
20 25 30 35 40
Age 0
2 4 6 8 10 12 14
Count
Gender Male Female
Bachelor Master PhD Not A Student 0
10 20 30 40 50
Count
Figure 3.2.: The age of the participants (left) and the university program they are currently enrolled in (right).
During the recruiting of the participants, it was stated that only German-speaking participants were accepted such as to avoid language problems with the personality tests. Since personality traits remain very stable over time [HBJD16], the ground truth does not need to be assessed multiple times and a single personality test result can be used as a label for all training instances collected for one particular user. However, it has been shown that personality traits can be intentionally changed in mental coaching sessions in only 10 - 12 weeks [MOC14]. Therefore, the ground truth was assessed twice, once at the beginning of the study, and once at the end of the study. This does not only ensure that the personality traits remained constant over time (and thus, that the ground truth is accurate for the entire period of the study), but it also provides a form of validation since we can omit participants that showed big changes in a personality trait because big changes would indicate that the test was answered dishonestly.
3.2. Data Validation
A total number of 82 participants completed the study, which consisted of not only the data collection and the four personality tests (2x BFI-2, 2x PHQ-8) described in the previous sec- tion, but also of a short survey querying demographics and information about the participants’
profession. Three participants were excluded because of anomalies in their test answers (see
Section 3.2.1) and one participant was excluded because of corrupted timestamp values (see
Section 3.2.2). Two more participants were excluded because they did not fill out the person-
ality tests and the survey on time. From the remaining 76 participants, 36 were males and 40
were females. The participants were 23 years old on average (SD = 3.77) and 68 of them were
university students, most of which were currently enrolled in a Bachelor’s program (see Fig-
ure 3.2). 74 participants were native German or Swiss-German speaking and they also indicated
in the survey to type in the respective languages most of the time. In the following, we ana-
lyze the personality traits and depression levels obtained from evaluating the questionnaires and
statistically validate the dataset. In a next step, the smartphone usage is analyzed which is not
relevant to the final model itself, but can be useful in the context of data validation.
3.2. Data Validation
Extraversion Agreeableness Conscientiousness Neuroticism Openness
Our Dataset 3.42 3.92 3.58 2.58 3.79
Mean World 3.34 3.69 3.52 3.01 3.64
Mean Western Europe 3.38 3.56 3.39 2.99 3.71
Table 3.2.: Mean personality traits from our dataset, globally and in western Europe on the range [1, 5] [SAM + 07].
3.2.1. Personality Traits and Depression Level
In Table 3.2 and Figure 3.3 we present the results of the BFI-2 and the PHQ-8. The evaluation of the BFI-2 showed that the mean personality traits are very similar to the world average and the western Europe average [SAM + 07], but that there is a notable difference for neuroticism.
A possible explanation for this is that neuroticism is the only negatively associated trait since it is also known as negative emotionality [DAR15]. Thus, a low score in this trait is generally considered as something desirable which is why the participants might have distorted their scores with respect to this trait and therefore scored lower than average. In general, our set of participants presents a high variability in all traits and spreads widely over the range of possible values, which benefits our models because it indicates that the set is representative. This might not seem to be the case for the depression level because the highest depression level in our dataset is 13 whereas the highest possible level is 24. However, recall that a depression level above 9 already indicates depressive disorders [KSS + 09], which is the case for 17 users. Hence, a wide spread is not expected for the depression level, which suggests that our set of users is also representative with respect to the depression level.
The BFI-2 and PHQ-8 were carried out twice in order to ensure that the personality traits did not change during the study because it can be assumed that the traits should remain stable over this period [HBJD16, MOC14]. A difference between the first and the second outcome of the questionnaires can be an indicator for dishonest or random answers which should be filtered out beforehand. Naturally, the test results were not identical in both personality tests, hence a tolerance had to be taken into account before excluding users. First of all, there is a discretization error of 12.5% in the BFI-2 [SJ17] induced by the 5-point Likert scale because the scale is four units long (distance from 1 to 5) and the true value might be exactly in between two levels, which would result in an error of half a unit, which is 12.5% of the whole range. So, a difference smaller than that must be tolerated in any case. Furthermore, Martin et al. [MOC14]
showed that mental coaching can change a personality trait by up to 20% (± 5%) in 10 - 12 weeks. Since this coincides with the duration of the study, the tolerance cannot be lower than 20% because we cannot rule out that participants were in such a process of personality change.
We added a small margin to account for the variance, which results in a final tolerance of 25%
(i.e., we accept an absolute change of ± 1.0 or smaller). Three participants were excluded
based on this tolerance threshold. Figure 3.4 shows the personality test results of a participant
that has been excluded, and of a participant that has been kept based on these thresholds. For the
depression level, a higher tolerance should be taken into account because the PHQ-8 assesses
the depression level of the last two weeks before the test and is therefore potentially less stable
over such a long period as was the user study. Hence, higher changes over time might be
3. Dataset
Extraversion AgreeablenessConscientiousness Neuroticism Openness 1
2 3 4 5
Depression Level (PHQ-8) 0
2 4 6 8 10 12
(a) (b)
Figure 3.3.: Distribution of personality characteristics. (a) Mean score on the Big Five personality traits per trait and per user according to the BFI-2 questionnaire [SJ17]. (b) Mean rating of the statements in the PHQ-8 depression level questionnaire [KSS + 09] per participant. Note that the y-axis for the PHQ-8 is re-scaled for readability and actually ranges from 0 to 24.
possible, which is why we allowed a change of up to 40%. However, this threshold did not have an influence on the user set because all users showed a change smaller than this tolerance threshold.
In general, we could not detect any trends in the change of the personality traits (see Figure 3.5).
The mean absolute changes for the OCEAN traits were 0.03 (extraversion), -0.02 (agreeable- ness), 0.03 (conscientiousness), -0.01 (neuroticism) and -0.01 (openness) which shows that the traits remained constant on average. Due to the epidemiological situation in Switzerland caused by the COVID pandemic and the resulting restrictions, one could have expected to see a slight increase in depression level. However, the depression level did not increase much either (mean absolute change of 0.28, i.e., a 1.17% increase). It has to be noted that the study coincided with the lifting of many restrictions and the participants may not have been exposed to incisive restrictions compared to other countries.
3.2.2. Smartphone Usage
Although context information is irrelevant for our model, it was still part of the data collection as
listed in Table 3.1 because it is well-suited as a data validation method. For example, we would
expect to see an increased phone usage in the mornings, lunch breaks, evenings and weekends
when participants usually have free time and are not working. We would also expect to see no
or only few activity during the night when users are sleeping, and the activity should also be
evenly distributed over the duration of the study. The background service that performs the data
recording is stopped by the system every time the phone is locked. However, the end time of a
session may not be logged if the data collection app is not closed correctly or closed abruptly.
3.2. Data Validation
E A
C
N
O
1 2 3 4 5
Our Dataset World Western Europe
E A
C
N
O
1 2 3 4 5
Pre-Study Post-Study
E A
C
N
O
1 2 3 4 5
Pre-Study Post-Study
![Table 2.3.: Mean personality traits globally and in western Europe on the range [1, 5] [SAM + 07].](https://thumb-eu.123doks.com/thumbv2/1library_info/3908842.1525988/24.892.147.792.1016.1070/table-mean-personality-traits-globally-western-europe-range.webp)
![Table 3.2.: Mean personality traits from our dataset, globally and in western Europe on the range [1, 5] [SAM + 07].](https://thumb-eu.123doks.com/thumbv2/1library_info/3908842.1525988/34.892.146.795.141.229/table-mean-personality-traits-dataset-globally-western-europe.webp)
![Figure 3.3.: Distribution of personality characteristics. (a) Mean score on the Big Five personality traits per trait and per user according to the BFI-2 questionnaire [SJ17]](https://thumb-eu.123doks.com/thumbv2/1library_info/3908842.1525988/35.892.86.764.123.461/figure-distribution-personality-characteristics-personality-traits-according-questionnaire.webp)
![Figure 3.4.: Radial personality plots obtained from evaluating the BFI-2 [SJ17] on our dataset](https://thumb-eu.123doks.com/thumbv2/1library_info/3908842.1525988/36.892.135.805.112.371/figure-radial-personality-plots-obtained-evaluating-bfi-dataset.webp)
