doi: 10.3389/fmars.2019.00743
Edited by:
Carol Robinson, University of East Anglia, United Kingdom Reviewed by:
Xosé Anxelu G. Morán, King Abdullah University of Science and Technology, Saudi Arabia David L. Kirchman, University of Delaware, United States
*Correspondence:
Natasha McDonald natashamc1@gmail.com
Specialty section:
This article was submitted to Marine Biogeochemistry, a section of the journal Frontiers in Marine Science
Received:15 August 2019 Accepted:14 November 2019 Published:10 December 2019
Citation:
McDonald N, Achterberg EP, Carlson CA, Gledhill M, Liu S, Matheson-Barker JR, Nelson NB and Parsons RJ (2019) The Role of Heterotrophic Bacteria and Archaea in the Transformation of Lignin in the Open Ocean.
Front. Mar. Sci. 6:743.
doi: 10.3389/fmars.2019.00743
The Role of Heterotrophic Bacteria and Archaea in the Transformation of Lignin in the Open Ocean
Natasha McDonald1,2* , Eric P. Achterberg2, Craig A. Carlson3, Martha Gledhill2, Shuting Liu3, Julia R. Matheson-Barker1, Norm B. Nelson4and Rachel J. Parsons1
1Bermuda Institute of Ocean Sciences, St. George’s, Bermuda,2GEOMAR Helmholtz Centre for Ocean Research Kiel, Kiel, Germany,3Marine Science Institute, University of California, Santa Barbara, Santa Barbara, CA, United States,4Earth Research Institute, University of California, Santa Barbara, Santa Barbara, CA, United States
The pelagic ocean receives terrigenous inputs of a range of organic compounds;
however, the role that this terrigenous material plays in the ocean carbon cycle and biological pump is not entirely understood, and questions remain as to how oceanic cycles of terrigenous and autochthonous carbon interact. A significant portion of organic carbon that cannot be utilized by marine microbes in the epipelagic ocean escapes microbial remineralization to be sequestered in the deep ocean as refractory dissolved organic matter (DOM). Lignin, a “model” terrigenous compound, is thought to be refractory in the open ocean unless chemically altered. However, in this study, incubation experiments performed using lignin-amended oligotrophic seawater from the Sargasso Sea exhibited bacteria and archaea growth that doubled compared to unamended control treatments. The increase in bacteria and archaea cell abundance in lignin-amended treatments coincided with a 21–25% decrease in absorbance (250–
400 nm) of chromophoric dissolved organic matter (CDOM), suggesting that certain microbes may be capable of altering fractions of this ostensibly recalcitrant organic matter. Furthermore, the microbial response to the lignin-amended treatments appears to be taxon-specific. Two phyla of Archaea, Euryarchaeota and Thaumarchaeota, exhibited an increase in abundance of 7-fold and 28-fold (from 2.42 × 10⁶ cells L−1 to 1.72 × 10⁷ cells L−1, and from 1.60 × 10⁶ cells L−1 to 4.54 × 10⁷ cells L−1, respectively), over 4 days of incubation in lignin-amended treatments. Additionally, an increase of 11-fold and 13-fold (from 2.93 × 10⁶ cells L−1 to 3.30 ×10⁷ cells L−1, and from 3.26×10⁶cells L−1 to 4.28×10⁷cells L−1, respectively), was observed in the abundance of these phyla in treatments containing lignin with added nitrogen and phosphorus, thus raising questions regarding primary and/or secondary responses to
lignin degradation. Our findings indicate that marine bacteria and archaea play a role in the transformation of the optical properties of lignin in the open ocean and that they may serve as a potential sink for a portion of the lignin macromolecule.
Keywords: thaumarchaeota, lignin, bacterioplankton abundance, CDOM, fluorescentin situhybridisation (FISH)
INTRODUCTION
Dissolved organic matter (DOM) is an important component of many ocean biogeochemical cycles (Hedges et al., 1997;Fasham et al., 2001; Mopper et al., 2015) and can serve as a substrate for heterotrophic archaea and bacteria (Cottrell and Kirchman, 2000;Carlson et al., 2002). The majority of DOM in the open ocean is of marine origin (Koch et al., 2005;Carlson and Hansell, 2015); however, terrigenous inputs of compounds such as lignin may be important to the oceanic carbon cycle. Lignin, a cross- linked macromolecule, unique to woody vascular plants, has been used as a model compound and tracer of terrigenous carbon (Del Vecchio and Blough, 2004; Hernes and Benner, 2006). On the basis of measurements of lignin phenol concentrations, it has been shown that less than 2% of oceanic DOC is terrigenous (Hernes and Benner, 2006); yet, if estimates of annual riverine export to the ocean and atmospheric deposition of dissolved or water soluble organic carbon to the surface ocean are considered (∼0.4 and∼0.65 Pg organic C, respectively), the concentrations of lignin phenols should be higher (Williams and Druffel, 1987;
Hedges et al., 1997;Koch et al., 2005;Lavorivska et al., 2016).
This raises a number of questions about the transport and fate of terrigenous DOM in the open ocean.
Furthermore, a portion of DOM has been shown to be light- absorbing, or chromophoric (CDOM), and is found ubiquitously throughout the global ocean. CDOM accounts for up to 50% of blue light absorption in the open ocean, thereby effectively regulating photosynthesis and influencing remote sensing algorithms used to predict primary production. Despite its impact on biogeochemical cycles, the composition and sources of CDOM in the open ocean remain largely unresolved. Dark microbial incubation studies have demonstrated that production of CDOM is positively correlated with an increase in bacterial cell abundance, providing evidence that CDOM is a byproduct of heterotrophic bacterial production (Nelson et al., 2004;Kinsey et al., 2017). The same studies also demonstrated that some fraction of CDOM is subsequently removed, presumably due to microbial remineralization. It is thought that the chemical composition and degradation rate of marine CDOM varies depending on the quality of the organic nutrient substrate available to bacterioplankton (Nelson et al., 2004). Lignin is also chromophoric, but its role in the pelagic CDOM pool is poorly understood. A number of studies have investigated the relationship between lignin and microbes in soil or riverine water, and suggest that some fraction of lignin is biologically available and that distinct microbial lineages under specific nutrient conditions are capable of degrading lignin (Hernes and Benner, 2003; Peng et al., 2008;Bugg et al., 2011; Huang et al., 2013).
Additionally, recent genomics studies have shown a wide range of organisms with novel enzymes that have the potential to degrade
lignin (Cragg et al., 2015;Janusz et al., 2017). However, the ability of microbial communities to utilize lignin in nutrient-depleted oceanic regions and the relationship to CDOM variability has not been fully investigated.
Here, we evaluate the response of the bacteria and archaea communities to lignin amended oligotrophic seawater from the Sargasso Sea to determine if specific lineages respond to lignin amended treatments and to assess whether terrigenous organic matter can serve as an intermediary in the production of autochthonous CDOM.
MATERIALS AND METHODS Sample Collection
Samples were collected at the Bermuda Atlantic Time Series Study (BATS) site in the North Atlantic (31◦400N, 64◦100W) on board theR/V Atlantic Explorerin July, 2014. Water was collected from depths of 1 and 60 m, using Niskin bottles on a rosette containing a conductivity, temperature and depth (CTD) sensor package. An inoculum of unfiltered “whole water” containing natural bacteria and archaea assemblages was added to grazer- diluted incubation media. Water samples for the incubation media were collected from 1 m depth, to ensure low background concentrations of CDOM as a result of photobleaching, low lignin concentrations due to photooxidation and low nutrients (Nelson et al., 2004, 2007;Hernes and Benner, 2006). Seawater collected from 1 m depth was filtered through a 0.2-µm filter (Whatman Polycap AS) and 14-L aliquots were transferred into 20-L polycarbonate carboys (Nalgene, United States) that were pre-cleaned with 10% hydrochloric acid. Water for the inoculum was collected from a depth of 60 m (where maximum bacterioplankton and CDOM concentrations can typically be observed at BATS) (Carlson and Ducklow, 1996;Steinberg et al., 2001;Bates and Johnson, 2016), and 7 L of inoculum was added, unfiltered, to each carboy, thereby diluting the filtered surface seawater to 70% of the total volume (Supplementary Table S1). This diluted seawater culture approach has been shown to alleviate grazing pressure by protistan grazers (Carlson et al., 2002, 2004; Nelson et al., 2004).In situconcentrations of NO3
and PO4 were <0.02 and <0.03 µmol L−1, respectively, at both 1 m and 60 m depth (Steinberg et al., 2001); CDOM absorbance (325 nm) at 1 m was 0.075 m−1and 0.155 m−1 at 60 m. Althoughin situDOC concentrations were not measured on the cruise, TOC concentrations ranged from 67.1 µmol L−1 at 60 m to 67.4 µmol L−1 at the surface. Previous studies have indicated that DOC comprises the majority of TOC in the epipelagic zone at BATS and have evidenced DOC concentrations of ∼68µmol L−1 from June to October (Carlson et al., 1998).
Nutrient Amendments
Replicate incubations (n= 2) were performed in the dark and at thein situtemperature of the inoculum (23◦C). Seawater dilution cultures included unamended controls and treatments that included a combination of organic and inorganic amendments (Supplementary Table S1). The DOM amendments (shown in Supplementary Table S1) included: (1) lignin (96% purity, alkali- extracted with low sulfonate content; Sigma-Aldrich) (Lignin);
(2) lignin with the addition of 1µmol L−1ammonium chloride (99.998% trace metal basis; Sigma-Aldrich) and 0.1 µmol L−1 dipotassium phosphate (BioUltra anhydrous ≥99.0%; Sigma- Aldrich) (LNP); or (3) glucose (D-(+-Glucose≥99.5% (Sigma- Aldrich) with the addition of 1µmol L−1ammonium chloride and 0.1µmol L−1dipotassium phosphate (GNP). The inclusion of both GNP and LNP treatments in this study allowed for the direct comparison of the microbial response to a model labile substrate, compared with a complex terrigenous organic substrate. The commercial lignin was chosen according to previous work by Boyle et al. (2009). Concentrations of N and P were chosen to be similar to those used in previous work at the BATS site (Carlson et al., 2002).D-glucose was added to the carboys to obtain a final concentration of 10µmol L−1 C. The solution was prepared such that less than 20 mL of the aqueous glucose solution was added to the 20 L sample, and thus did not affect the ionic strength of the sample. A solution of lignin was prepared by the addition of solid lignin material to de- ionized water (MilliQ, Millipore, United States), with subsequent sonication and filtration (GF/F filters, Whatman, and a pre-rinsed 0.2-µm pore size track-etched polycarbonate filter, Whatman).
The total organic carbon (TOC) content of the solution was determined according toCarlson et al. (2010)prior to inoculation and the solution was pipetted directly into the appropriate carboys to target a concentration of 10 µmol L−1 C. Samples for bacteria and archaea cell abundance, DOC, CDOM, and fluorescencein situhybridization (FISH) were drawn by spigot directly into sampling containers at discrete time intervals over a period of 35 days.
Determination of CDOM Absorption Coefficient
Changes in CDOM concentrations were determined by UV- Visible spectroscopy. Subsamples for each amendment were gravity filtered through a 0.2-µm filter (polycarbonate track- etched membrane filter; Whatman, Chicago, IL, United States) that had been pre-flushed with 500 mL of de-ionized water and collected into muffled glass vials (I-Chem, Thermo Fisher Scientific, Waltham, MA, United States) fitted with PTFE- lined polypropylene caps. Samples were stored in the dark at 4◦C until analysis. Absorbance measurements were made using a dual-beam spectrophotometer (Perkin Elmer Lambda- 18), equipped with a photo-multiplier tube. Samples were analyzed in quartz cuvettes with a 10-cm pathlength and were blank corrected against de-ionized water. Blank-corrected spectra (250–700 nm) were reported as absorption coefficients (m−1) using the equation:
a = 2.303A/l (1)
whereais the absorption coefficient (m−1),Ais the absorbance and l is the pathlength (m). Absorbance values at discrete wavelengths in the near-UV spectrum (325 and 340 nm) were selected from individual spectra to measure changes in concentration and changes in CDOM components over time, particularly lignin (Hernes and Benner, 2003;Del Vecchio and Blough, 2004;Nelson et al., 2004).
Enumeration of Bacteria and Archaea Cell Abundance
Bacteria and archaea abundance samples (40 mL) were fixed with formalin (10% final concentration), and stored at −80◦C until slide preparation. Slides were prepared according toPorter and Feig (1980), Parsons et al. (2015), and McNally et al. (2017).
Slides were then enumerated using an AX70 epifluorescence microscope (Olympus, Tokyo, Japan) under ultraviolet excitation at 1000×magnification. At least 500 cells per slide (10 fields) were counted for bacteria and archaea abundance.
Quantification of Dissolved Organic Carbon
Dissolved organic carbon was sampled in duplicate and filtered through 0.7-µm pre-combusted glass fiber filters (Whatman, GF/F) into pre-combusted borosilicate glass vials (40 mL;
I-Chem) fitted with acid-washed Teflon-lined caps and stored frozen at –20◦C until analysis. All DOC samples were sent to the University of California for analysis. Samples were analyzed using high-temperature combustion on Shimadzu TOC-V analyzers, with slight modifications from the manufacturer model, as described in Carlson et al. (2010). In order to minimize the machine blanks, expansive conditioning of the combustion tube with repeated injections of low carbon water (LCW) as well as deep seawater was performed. A daily standardization of the system response was performed using a four-point standardization calibration curve of glucose solution in LCW.
In-house surface and deep references were included in every analytical run in order to ensure comparability between sample sets. The in-house surface and deep references used in this study were collected from the Santa Barbara Channel in April 2014 and calibrated against consensus reference material (Hansell, 2005) and historical house reference materials.
The average surface and deep reference values were 66.6±0.9 and 38.0±0.7µmol L−1C, respectively. Further details of this method are described inCarlson et al. (1998, 2010).
Enumeration of Specific Lineages by Fluorescence in situ Hybridization (FISH) and Catalyzed Reporter Deposition-FISH (CARD-FISH)
Fluorescent in situ hybridisation was utilized to quantify the abundance of the major bacteria and archaea phylotypes present in the seawater. We followed the protocols described inParsons et al. (2015)andMcNally et al. (2017)for all FISH and CARD- FISH. The FISH probes used for this study (Supplementary Table S3) have previously been validatedin silicofor specificity
using Probe Match on the Ribosomal Database Project (Cole et al., 2009) and TestProbe and Probebase on the SILVA website (Loy et al., 2007). The bacterial and archaeal groups quantified included the SAR11 clade (152R, 441R, 542R, 732R probes), Alteromonas spp. (AC137R), Flavobacteria II (CFB563R), Rhodobacteraceae (536R), SAR202 (103R, 311R), Euryarchaeota (Eury806), and Thaumarchaeota (Thaum537) (McNally et al., 2017).
RESULTS
Bacteria and Archaea Cell Abundance
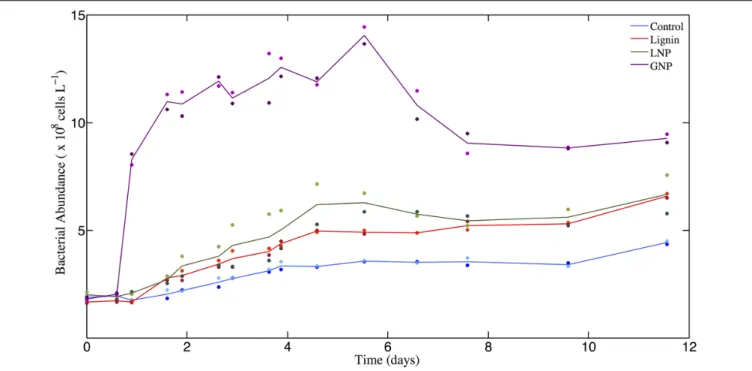
The cell abundance data show that in all treatments where lignin was added (Lignin or LNP), the microbial response was greater than that observed in the unamended Controls (Paired t-test for Control and Lignin (p < 0.05), and for Control and LNP (p < 0.05); Figure 1). The unamended Controls exhibited a 2.5-fold increase in bacteria and archaea cell abundance (from 1.875×10⁸cells L−1 to 4.42×10⁸cells L−1) between days 0 and 12. The treatments that were amended solely with commercial lignin showed an average increase in cell abundance of ∼3-fold between days 0 and 5 (from 1.67 × 10⁸ cells L−1 to 4.95 × 10⁸ cells L−1), after which the population remained relatively unchanged until day 12, when it increased by another 1.2-fold (to 6.59 × 10⁸ cells L−1). The treatments amended with lignin in addition to nitrogen and phosphorus (LNP) showed an average increase in cell abundance of 3-fold between days 0 and 5 (from 1.99 × 10⁸ cells L 1 to 6.20 × 10⁸ cells L−1) and then remained in stationary growth for the duration of the incubation.
The glucose amendments with added nitrogen and phosphorus (GNP) demonstrated an increase in cell abundance (from 1.81 × 10⁸ cells L−1 to 1.10 × 10⁹ cells L−1) between days 0 and 2, then approximated stationary growth through day 6 (at ∼ 1.40 × 10⁹ cells L−1), after which cell densities declined through day 12.
Changes in CDOM Absorbance
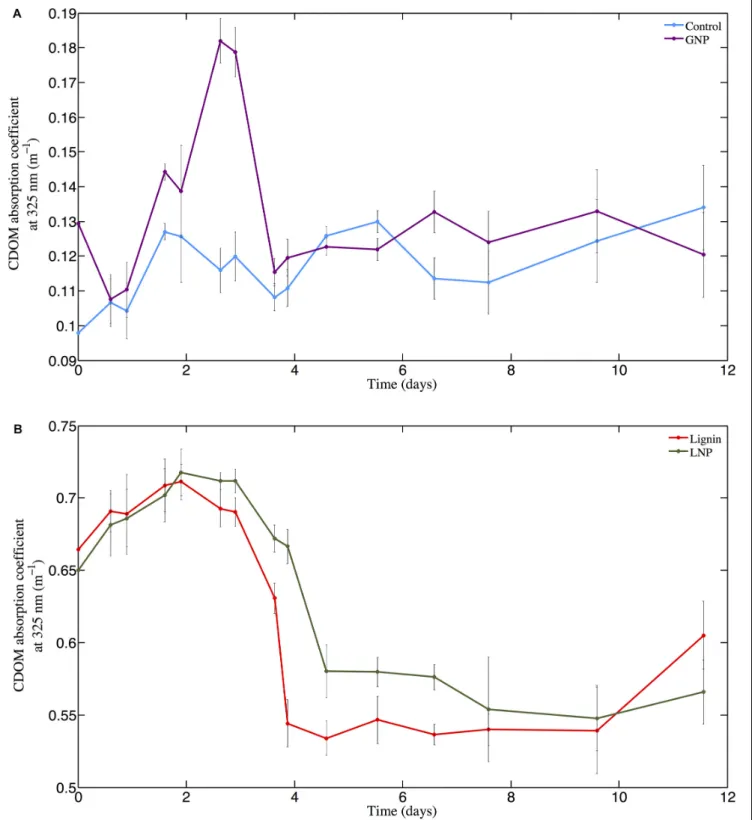
The absorbance of the unamended Control (absorption coefficient at 325 nm; m−1) ranged from 0.098 m−1 at day 0 (T0) to 0.134 m−1 at day 12 (T15; Figure 2, top panel). In the GNP amendments, CDOM absorbance at 325 nm increased continuously over the first 3 days from 0.129 m−1to 0.182 m−1, then decreased to 0.123 m−1by day 5 (T9) (Figure 2, top panel) and remained relatively unchanged (paired t-test for T9 and T14,p>0.05) for the remainder of the experiment (Figure 2).
CDOM 325 nm absorption coefficients at the absorbance maximum in the GNP treatments were almost 70% higher than for Controls at the same time point. Both the Lignin and LNP amended samples exhibited a higher initial absorbance (between 250 and 450 nm) than the Controls at day 0 (T0), due to the chromophoric nature of the amendments themselves (T0 = 0.664 m−1 and 0.650 m−1, respectively). Spectra (250–
450 nm) of both Lignin and LNP amended samples (Figure 3, top and center panels, respectively), exhibited a discrete peak at approximately 340 nm, attributed to the amendment of lignin, as well as a less pronounced shoulder from 260–280 nm.
Both of these peaks decreased substantially between days 2 and 10, indicating a loss of absorbance at these wavelengths of approximately 30%, and resulting in spectra that resembled the
FIGURE 1 |Bacterioplankton cell abundance (×108cells L–1) over time (days). Solid lines represent the average of replicates for each of the four treatments: GNP, Lignin, LNP, and un-amended controls. Individual datapoints, representing duplicates for each treatment are color-correlated with the plot of the respective mean.
FIGURE 2 |Changes in the CDOM absorption coefficient (m–1) at 325 nm from day 0 through day 12 (T0–T15) for(A)GNP (purple line with dots) and Control (light blue line with dots) and(B)Lignin and LNP treatments (red line and green line with dots, respectively).
shape of oceanic CDOM spectra (Figure 3, bottom panel). In both treatments, absorbance at 325 nm increased until day 2 (Figure 2, bottom panel), indicating the production of CDOM in situand then exhibited an almost 25% decrease in absorbance,
falling below initial absorbance values (Figure 2, bottom panel).
Both LNP and Lignin absorbance at 325 nm remained relatively unchanged from day 10 to 35 (paired t-tests, p = 0.06 and p= 0.25, respectively;Supplementary Figure S1).
FIGURE 3 | (A)CDOM absorption coefficient (m–1) for the Lignin treatment [250–450 nm, for days 2–5 (T4–T9)].(B)CDOM absorption coefficient (m–1) for the LNP treatment [250–450 nm, for days 2–5 (T4–T9)].(C)CDOM long-wavelength absorbance (250–700 nm; m–1) for Lignin on days 2 and 5 (T4andT9) and ControlT0
(day 0).
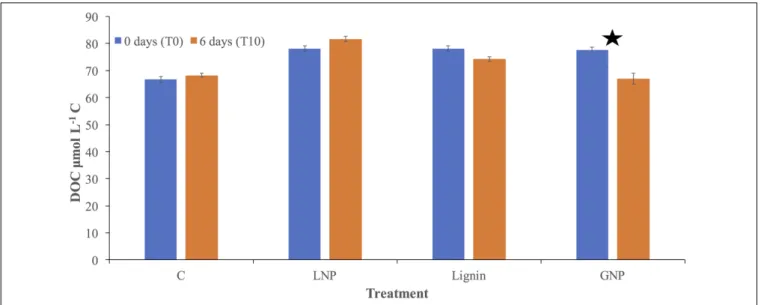
FIGURE 4 |Dissolved organic carbon (DOC;µmol L–1C) concentrations for all treatments and controls. DOC was measured at the initial time point (blue) and after 6 days (orange). Error is shown as standard deviation between replicate samples and treatments. The star indicates a significant change (two samplet-test assuming unequal variances) in DOC between the two time points.
Dissolved Organic Carbon Utilization
Dissolved organic carbon analysis confirmed an addition of
∼10 µmol L−1 C to each of the Lignin, LNP, and GNP treatments, compared to the control at the time of inoculation (Control = 66.6 µmol L−1 C ± 1.2; Lignin = 78.2µmol L−1 C±1.0; LNP = 78.2µmol L−1C±1.1; GNP = 77.6µmol L−1 C ±1.1.). There was no resolvable change in DOC throughout the incubation for either the unamended control or the LNP treatments. We observed a loss of∼4µmol L−1and 11µmol L−1in the Lignin and GNP treatments, respectively (Figure 4).
Specific Lineages Measured Using FISH and CARD-FISH
The initial microbial community (T0) in all treatments was dominated by members of the SAR11 lineage, with cell abundances between 4.18 and 5.82 × 10⁷ cells L−1, while cell abundances of all other targeted groups were at least an order of magnitude lower (Supplementary Figures S2A–D). In the unamended Control samples, SAR11 continued to increase throughout the incubation, reaching 1.61×10⁸cells L−1by day 6 (T10), with cell abundances still above 1×10⁸cells L−1on day 10 (T13;Figure 5andSupplementary Figure S2A). In contrast, bacteria and archaea populations in the amended treatments shifted by day 4, and SAR11 abundance reached stasis, while other lineages increased (Supplementary Figures S2B–D).
In the GNP treatments, Alteromonas spp. increased from
>2×10⁶cells L−1 (T0) to almost 9×10⁸cells L−1 by day 4,
comprising 56.3% of the total microbial community (Figure 5B andSupplementary Figure S2B). The increase inAlteromonas was less pronounced in both lignin-amended samples (a net increase of 2.60 and 4.76×10⁷cells L−1, respectively, compared to an increase of 8.87×10⁸ cells L−1in the GNP treatments), whereas Archaea became more pronounced in these treatments
(Figure 5A and Supplementary Figures S2C,D). During days 0 through 4, the cell population of Thaumarchaeota increased from 1.60 × 10⁶ cells L−1 to 4.54× 10⁷ cells L−1 (a factor of ∼28) in the Lignin treatments and from 3.26 × 10⁶ cells L−1 to 4.28 × 10⁷ cells L−1 (a factor of ∼13) in the LNP treatments. Over the same time period, Euryarchaeota increased from 2.42 × 10⁶ cells L−1 to 1.72× 10⁷ cells L−1 (a factor of ∼7) in the Lignin treatments and from 2.93 × 10⁶ cells L−1 to 3.30 × 10⁷ cells L−1 (a factor of ∼11) in the LNP treatments (Figure 5AandSupplementary Figures S2C,D). In fact, Thaumarchaeota increased from 3.26 × 10⁶ cells L−1 to 4.54 × 10⁷ cells L−1 between days 0 and 4 (Supplementary Figure S2C). However, by day 6, Thaumarchaeota abunances in all lignin-amended treatments had decreased to approximately 2×10⁷cells L−1. Euryarchaeota cell abundance decreased from 1.71 to 1.16 × 10⁷ cells L−1 between days 4 and 6 in the Lignin treatments, and decreased from 3.30 ×10⁷ cells L−1 to only 5.70 × 10⁶ cells L−1 between days 4 and 6 in the LNP treatments (Supplementary Figures S2C,D). In the unamended Control treatments, the abundance of Thaumarchaeota and Euryarchaeota decreased by day 4 (a loss of 5.02 × 10⁶ cells L−1 and 4.47 × 10⁷ cells L−1, respectively. Cell densities of Thaumarchaeota also decreased in the GNP treatments throughout the first 4 days (from 9.87 × 10⁵ cells L−1 to 7.29×10⁵cells L−1), while Euryarcheota cell abundances were low but exhibited an increase (from 8.65 × 10⁵ cells L−1 to 1.41×10⁶cells L−1) (Supplementary Figures S2A,B).
In addition to increases in Archaea, cell growth was observed for SAR202, which increased by between day 0 and day 4 for all amended samples (Figure 5andSupplementary Figures S2A–
D). Cell densities ofRhodobacteraceain the unamended controls did not exceed an average of 1.55×10⁷ cells L−1(Figure 5A), but demonstrated a significant increase in cell abundance in all of the amended treatments (pairedt-tests for growth between day 4
FIGURE 5 | (A)difference in percent contribution of specific lineages to the total prokaryote populations and(B)difference in the cell abundance of targeted lineages in each of the four treatments (Control, GNP, Lignin, LNP) between days 0 and 6 (T0andT10).
and 6 for each amendment,p<0.05 for all tests;Supplementary Figures S2B–D). Cell growth was highest in the treatments with added inorganic nutrients (GNP = 1.30 × 10⁸ cells L−1 and LNP = 1.08×10⁸cells L−1, respectively, on day 6), whereas it only reached a maximum of 6.33×10⁷cells L−1 (on day 6) in the Lignin treatments. Notably, in all of the amended samples and the controls, the maximum growth forRhodobacteraceadid not occur until day 6. Additionally, growth of Flavobacteriales was investigated, but although it was detected at all time points for all treatments, in the lignin amended treatments, it reached a minimum on day 4, while likeRhodobacteracea, it reached a maximum on day 6.
DISCUSSION
Microbial Growth and DOC Utilization
The GNP amended treatments yielded the greatest growth response and coincident drawdown of DOC (Figures 4, 5B) of all treatments, which is consistent with previous studies that have demonstrated that copiotrophic populations grow rapidly in the presence of a labile carbon source and available
macronutrients (Carlson et al., 2002, 2004, 2009; Ewart et al., 2008;Goldberg et al., 2011;Nelson and Carlson, 2012). Microbial cell growth was also evidenced in the Lignin and LNP treatments (Figure 1), which suggests that some marine heterotrophs were able to utilize a portion of the added lignin; however, the question of which components of the lignin molecule were used remains unresolved. Unlike the GNP amendments, where DOC drawdown accounted for all of the added organic carbon, no significant DOC drawdown was observed in the Lignin or LNP amendments (Figure 4). However, DOC removal in the Lignin treatment was greater than that observed in the unamended control (Student’s t-test, p = 0.174), where DOC removal was also not resolved. As the DOC measurements were not resolvable below the micromolar level, we cannot say definitively whether DOC was utilized in the Lignin and LNP treatments. However, the lignin amended dark incubations revealed greater prokaryote growth compared to the unamended controls, suggesting that marine heterotrophs were able to utilize a portion of the DOM in the lignin amended treatments to support anabolism. A such, we utilized CDOM measurements to further investigate changes in DOM.
Changes in CDOM Absorbance
The microbial growth over the first few days, coincident with an increase in CDOM absorption at 325 nm in all amended samples (Figures 1, 2), is consistent with the idea that as organic matter is remineralized by microbes, chromophoric byproducts are produced, either through direct release or by transformation of organic matter to a molecular structure with enhanced chromophoric properties (Stedmon and Nelson, 2015). While CDOM production in the GNP amendments was followed by a decrease in the 325 nm absorption coefficient to levels similar to those atT0 (Figure 2, top panel;
Supplementary Table S2), the CDOM absorbance at 325 nm in the Lignin and LNP amendments decreased to values 20%
lower than the T0 values (Figure 2, bottom panel), further suggesting an alteration of chromophoric organic matter in the lignin amended treatments. Nevertheless, the final CDOM values between 250 and 450 nm in the Lignin and LNP treatments remained well above those of the unamended control (Figure 3), suggesting that portions of the lignin remained unaltered in these treatments. Absorbance measurements alone do not conclusively prove that microbial remineralization of the amended carbon took place in the incubated samples;
however, a decrease in CDOM absorbance coincident with an increase in some lineages of bacteria and archaea in the lignin amended treatments does suggest that these microbes altered the chromophoric components of lignin throughout the incubation. Thaumarchaeota and Euryarchaeota, in particular, reached maximum cell abundances in the Lignin and LNP treatments in conjunction with minimum CDOM 325 nm values (Figures 2, 5). Specifically, there was a coinciding decrease in spectral absorbance at the lignin excitation maxima (∼340 nm; Figure 2, bottom panel; Figure 3, top panel and middle panel) as Thaumarchaeota cell abundance increased (Supplementary Figures S2C,D). The more pronounced growth of Euryarchaeota in the LNP treatment than in the Lignin
treatment (2.91 × 10⁷ cells L−1 vs. 1.27 × 10⁷ cells L−1, respectively; Supplementary Figures S2C,D) may indicate the additional requirements of nitrogen and phosphorus for cell growth of this lineage. Furthermore, metagenomic analysis has revealed that Marine Group II Euryarcheota have protein degradation pathways (Iverson et al., 2012;Orsi et al., 2016) and may have a role in DON transformation.
The featureless absorption spectrum of CDOM in natural waters, which exhibits an exponential increase in absorbance with decreasing wavelength, has been the subject of much discussion, as it has been shown that this spectrum cannot be the result of the superposition of spectra of individual chromophores (Blough and Del Vecchio, 2002;Del Vecchio and Blough, 2002, 2004), and it has been suggested that chemical alteration of chromophores must occur to produce the CDOM spectrum.Del Vecchio and Blough (2002, 2004) proposed that charge-transfer complexes formed from the partial oxidation of lignin precursors were responsible for the absorbance spectra in laboratory experiments using dissolved humic substances and that these complexes would be found in natural waters, where donor-acceptor complexes arise. Upon initial amendment of the incubations with lignin, a distinct absorbance peak was observed at ∼340 nm (which is not observed in monthly in situ CDOM measurements at BATS), along with a broad
“shoulder” between 265–280 nm (Figure 3, top and middle panels). However, as absorbance was measured over time, the enhanced absorbance at these wavelengths gradually decreased, resulting in a spectrum which more closely resembled the shape of the featureless “textbook” CDOM spectrum, as described by Blough and Del Vecchio (2002) and Nelson and Siegel (2002) (Figure 3, bottom panel). The timing of this CDOM transformation coincided with an increase in cell abundance and could indicate that microbes may play a previously unknown role in creating the charge-transfer complexes proposed to govern CDOM absorbance.
Taxon-Specific Microbial Response
The taxa targeted by the probes used in this study have been found within the North Atlantic Subtropical Gyre, which is dominated by the oligotrophic alphaproteobacterium, SAR11, representing∼40% of the prokaryotic community in the euphotic zone (Morris et al., 2002a,b). In the amended incubations, the absolute cell abundance of SAR11 was relatively constant over time (Supplementary Figures S2C,D), while several other lineages increased. Members of the SAR202 clade of marine bacteria exhibited a maximum increase in cell abundance (Figure 5andSupplementary Figures S2C,D) in the amended treatments at the same time when CDOM decreased. SAR202 have been estimated to account for ∼30% of all bathypelagic plankton (Morris et al., 2004; Varela et al., 2008), and studies have shown that multiple SAR202 clade genomes encode families of enzymes such as flavin-dependent monooxygenases, enolases and ring-hydroxylating dioxygenases, that may allow for the degradation of recalcitrant organic matter (Landry et al., 2017;
Liu et al., 2019). As such, the ability of SAR202 to degrade lignin warrants further study. While maximum cell abundance
was reached on day 4 for most of the targeted lineages, the copiotrophic alphaproteobacterium Rhodobacteracea exhibited maximum growth on day 6 in all treatments (Supplementary Figures S2A–D). The maxima for Rhodobacteracea occurred after CDOM had already decreased and therefore, it remains unclear if members of this lineage were consuming lignin directly or if they were utilizing byproducts of its remineralization.
Members of Rhodobacteracea have been shown to comprise approximately 5% of the total bacterioplankton community within the surface 300 m of the Sargasso Sea (Parsons et al., 2011). However, in this study,Rhodobacteracea comprised up to 13% of the population in the Lignin amendment and 17%
of the total population in the LNP amendment. The maximum cell abundance of Rhodobacteracea in the LNP treatments was almost double that observed in the Lignin treatments (Figure 5), and was comparable to the maximum observed for Rhodobacteraceain the GNP treatments (Figure 5). This presents the possibility that Rhodobacteracea growth was influenced by added N and P.
It is interesting to note thatAlteromonasexhibited higher cell abundances in the LNP than the Lignin treatment (Figure 5 and Supplementary Figures S2C,D), as Alteromonas is a copiotrophic organism, and has been shown to outcompete other species in the presence of labile carbon substrates, especially when nitrogen and phosphorus are not limited. Additionally, the added N and P in the LNP amended samples could account for the fact thatAlteromonascell abundance was almost double that in the Lignin treatment. Several possible mechanisms could account for its growth in the lignin amended samples.
It is possible that Alteromonas was able to utilize the DOM that was originally present in the seawater before the carbon substrate was added. Conversely, labile breakdown products could have been generated by the degradation of lignin by other lineages, whichAlteromonaswas then able to utilize. Alternately, Alteromonas may be able to directly utilize a portion of the lignin macromolecule.
The growth of Thaumarchaeota in both lignin amended treatments is of particular interest, as this lineage is known for its demonstrated ability to oxidize ammonia and as such, is largely known as a chemoautotroph (Konneke et al., 2005;Walker et al., 2010). However, it has also been shown to take up amino acids, and genes linked to the utilization of organic carbon have been identified in the same lineage of marine Archaea as that identified in our study, thus revealing the potential mixotrophic nature of this lineage (Hallam et al., 2006; Pester et al., 2011; Varela et al., 2011). It has been reported that approximately 60% of Archaea in samples collected from the Mediterranean and Pacific, including Marine GI Crenarchaeota-1 and Crenarchaeota-2, could uptake dissolved amino acids (Ouverney and Fuhrman, 2000). This study concluded that a portion of Crenarchaeota are heterotrophic and coexist with bacteria. Furthermore, a 2006 study of Crenarchaeota in the North Atlantic also demonstrated their ability to uptake amino acids, with certain lineages actively incorporating D- and L- aspartic acid (Teira et al., 2006). Notably, while the Crenarchaeota phylum has since been divided, creating the new Thaumarchaeota phylum, the oligonucleotide probe used by both Varela et al. (2011) and
Teira et al. (2006) to identify Crenarchaeota (Cren537 [5- TGACCACTTGAGGTGCTG-30]) is the same as was used in the present study to detect Thaumarchaeota.
Proposed Mechanisms of Lignin Degradation by Bacteria and Archaea
As a component of cell walls in vascular plants, lignin serves to protect plants from pathogens and is therefore naturally resistant to degradation from many types of microbes. The complex nature of the cross-linked lignin macromolecule, comprising of three phenolic monomers, creates a natural hindrance to radical decoupling and therefore can impede microbial degradation of the compound. While enzymatic breakdown of lignin has not previously been demonstrated for oceanic microbes, particularly archaea, two species of bacteria have been found to degrade lignin in marine pulp mill effluent (Gonzales et al., 1997), and there are groups of soil-associated bacteria, as well as many fungi (Glenn et al., 1983; Tien and Kirk, 1984; Glenn and Gold, 1985;
Gong et al., 2014) that use peroxidases and laccases (Cragg et al., 2015) to degrade lignin. Although fungi typically utilize heme-based lignin peroxidase (LiP) or manganese peroxidase (MnP) to depolymerize lignin, the mechanisms for microbial degradation of lignin are less clear (Brown et al., 2011; Brown and Chang, 2014). It is interesting to note that archaeal ammonia monooxygenases belong to a family of copper-containing membrane-bound monooxygenases (CuMMOs) (Pester et al., 2011) and the ability of these enzymes to oxidize lignin into phenolic breakdown products has not yet been investigated.
CONCLUSION
This study provides evidence that transformation of terrigenous DOM in dark incubations by marine heterotrophs is taxon-specific, with some marine lineages of bacteria and archaea altering what were previously thought to be biologically recalcitrant carbon sources, on a timescale of days. Furthermore, these results indicate that in addition to the photochemical interactions speculated as being responsible for the distinct CDOM absorbance spectrum, that biologically driven alterations of chromophores may occur.
Additionally, this study demonstrates a clear growth response to added lignin by multiple bacteria and archaea lineages, including Thaumarchaeota, warranting further investigation as to whether this is a primary response consistent with previous evidence that Thaumarcheota is mixotrophic, or a secondary response to reduced remineralization byproducts of other organisms. These results also provide further insight into the mechanisms by which cycles of terrigenous and autochthonous DOM in the pelagic ocean are inter- connected. The subsequent in situ production of CDOM (at 325 nm) in lignin-amended incubations of marine
heterotrophs suggests a cycle in which terrigenous and autochthonous CDOM are linked, with specific lineages of bacteria and archaea capable of transforming portions of lignin and then producing autochthonous CDOM, either through the production of DOM or the molecular rearrangement of existing DOM. Because up to 25% of lignin remains undegraded by photolysis, and lignin has been detected in the bathypelagic region of the North Atlantic, questions remain about the role of microbial degradation in the deep ocean. It is increasingly evident that the chemical composition and optical properties of DOM are linked to microbial community composition, and that these factors play a large role in determining the lability and fate of organic carbon in the ocean. It is by better understanding these links that a more comprehensive view of DOM cycling in the ocean can be achieved.
DATA AVAILABILITY STATEMENT
All datasets generated for this study are included in the article/Supplementary Material.
AUTHOR CONTRIBUTIONS
NM, CC, RP, and JM-B designed the study. NM, SL, JM-B, and RP carried out the experimentation and analysis. EA, MG, and NN provided expertise and advice in analyzing data and interpreting the results. NM, EA, CC, MG, SL, JM-B, NN, and RP contributed to the writing of the manuscript.
FUNDING
This study was supported in part by the NSF Oceanic Microbial Observatory grant (award OCE-0801991) as well as by the Canadian Associates of BIOS (CABIOS) and Simons Foundation International’s BIOS-SCOPE Program. Additionally, travel support was granted by Future Ocean.
ACKNOWLEDGMENTS
We would like to thank Ellie Halewood and Keri Opalk for their valuable contributions and assistance with DOC analysis, as well as Dr. Rod Johnson and BATS technicians for facilitating at-sea sample collection, and the captain and crew of the R/V Atlantic Explorer.
SUPPLEMENTARY MATERIAL
The Supplementary Material for this article can be found online at: https://www.frontiersin.org/articles/10.3389/fmars.
2019.00743/full#supplementary-material
REFERENCES
Bates, N. R., and Johnson, R. J. (2016).Bermuda Atlantic Time Series (Bats) Bottle Data. St. George’s: Institute of Ocean Sciences.
Blough, N. V., and Del Vecchio, R. (2002). “Chromophoric DOM in the coastal environment,” inBiogeochemistry of Marine Dissolved Organic Matter, eds D.
Hansell, and C. Carlson, (San Diego, CA: Academic Press).
Boyle, E. S., Guerriero, N., Thiallet, A., Del Vecchio, R., and Blough, N. V.
(2009). Optical properties of humic substances and Cdom: relation to structure.
Environ. Sci. Technol.43, 2262–2268. doi: 10.1021/es803264g
Brown, M. E., and Chang, M. C. Y. (2014). Exploring bacterial lignin degradation.
Curr. Opin. Chem. Biol.19, 1–7. doi: 10.1016/j.cbpa.2013.11.015
Brown, M. E., Walker, M. C., Nakashige, T. G., and Chang, M. C. (2011). Discovery and characterization of heme enzymes from unsequenced bacteria: application to microbial lignin degradation. J. Am. Chem. Soc. 133, 18006–18009.
doi: 10.1021/ja203972q
Bugg, T. D. H., Ahmad, M., Hardiman, E. M., and Rahmanpour, R. (2011).
Pathways for degradation of lignin in bacteria and fungi.Nat. Prod. Rep.28, 1883–1896. doi: 10.1039/c1np00042j
Carlson, C., and Hansell, D. (2015). “Doc sources, sinks, reactivity, and budgets,” in Biogeochemistry of Marine Dissolved Organic Matter, 2nd Edn, eds D. Hansell, and C. Carlson, (San Diego, CA: Academic Press).
Carlson, C. A., and Ducklow, H. W. (1996). Growth of bacterioplankton and consumption of dissolved organic carbon in the Sargasso Sea.Aquat. Microb.
Ecol.10, 69–85. doi: 10.3354/ame010069
Carlson, C. A., Ducklow, H. W., Hansell, D. A., and Smith, W. O. (1998). Organic carbon partitioning during spring phytoplankton blooms in the Ross Sea polynya and the Sargasso Sea.Limnol. Oceanogr.43, 375–386. doi: 10.4319/
lo.1998.43.3.0375
Carlson, C. A., Giovannoni, S. J., Hansell, D. A., Goldberg, S. J., Parsons, R., Otero, M. P., et al. (2002). Effect of nutrient amendments on bacterioplankton production, community structure, and Doc utilization in the northwestern Sargasso Sea.Aquat. Microb. Ecol.30, 19–36. doi: 10.3354/ame030019 Carlson, C. A., Giovannoni, S. J., Hansell, D. A., Goldberg, S. J., Parsons,
R., and Vergin, K. (2004). Interactions among dissolved organic carbon, microbial processes, and community structure in the mesopelagic zone of the northwestern Sargasso Sea.Limnol. Oceanogr.49, 1073–1083. doi: 10.4319/lo.
2004.49.4.1073
Carlson, C. A., Hansell, D. A., Nelson, N. B., Siegel, D. A., Smethie, W. M., Khatiwala, S., et al. (2010). Dissolved organic carbon export and subsequent remineralization in the mesopelagic and bathypelagic realms of the North Atlantic basin.Deep Sea Res. Part Ii-Top. Stud. Oceanogr.57, 1433–1445.
doi: 10.1016/j.dsr2.2010.02.013
Carlson, C. A., Morris, R., Parsons, R., Giovannoni, S. J., and Vergin, K. (2009). Seasonal dynamics of Sar11 populations in the euphotic and mesopelagic zones of the northwestern Sargasso Sea.Isme J.3, 283–295. doi:
10.1038/ismej.2008.117
Cole, J. R., Wang, Q., Cardenas, E., Fish, J., Chai, B., Farris, R. J., et al.
(2009). The ribosomal database project: improved alignments and new tools for rrna analysis. Nucleic Acids Res. 37, D141–D145. doi: 10.1093/nar/
gkn879
Cottrell, M. T., and Kirchman, D. L. (2000). Natural assemblages of marine proteobacteriaand members of theCytophaga-Flavobacter cluster consuming low and high molecular weight dissolved organic matter. Appl. Environ.
Microbiol.66, 1692–1697. doi: 10.1128/aem.66.4.1692-1697.2000
Cragg, S. M., Beckham, G. T., Bruce, N. C., Bugg, T. D. H., Distel, D. L., Dupree, P., et al. (2015). Lignocellulose degradation mechanisms across the tree of life.
Curr. Opin. Chem. Biol.29, 108–119. doi: 10.1016/j.cbpa.2015.10.018 Del Vecchio, R., and Blough, N. V. (2002). Photobleaching of chromophoric
dissolved organic matter in natural waters: kinetics and modeling.Mar. Chem.
78, 231–253. doi: 10.1016/s0304-4203(02)00036-1
Del Vecchio, R., and Blough, N. V. (2004). On the origin of the optical properties of humic substances.Environ. Sci. Technol.38, 3885–3891. doi: 10.1021/
es049912h
Ewart, C. S., Meyers, M. K., Wallner, E. R., Mcgillicuddy, D. J., and Carlson, C. A.
(2008). Microbial dynamics in cyclonic and anticyclonic mode-water eddies in the northwestern Sargasso Sea.Deep Sea Res. Part Ii-Top. Stud. Oceanogr.55, 1334–1347. doi: 10.1016/j.dsr2.2008.02.013
Fasham, M. J. R., Balino, B. M., Bowles, M. C., Anderson, R., Archer, D., Bathmann, U., et al. (2001). A new vision of ocean biogeochemistry after a decade of the joint global ocean flux study (Jgofs).AMBIO10, 4–31.
Glenn, J. K., and Gold, M. H. (1985). Purification and chracterization of an extracellular Mn(Ii)-dependent peroxidase from the lignin-degrading basidomycete, phanerochaete chrysosporium. Arch. Biochem. Biophys. 242, 329–341. doi: 10.1016/0003-9861(85)90217-6
Glenn, J. K., Morgan, M. A., Mayfield, M. B., Kuwahara, M., and Gold, M. H.
(1983). An extracellular H2O2-requiring enzyme preparation involved in lignin biodegradation by the white rot basidiomycete phanerochaete-chrysosporium.
Biochem. Biophys. Res. Commun.114, 1077–1083. doi: 10.1016/0006-291x(83) 90672-1
Goldberg, S. J., Carlson, C. A., Brzezinski, M., Nelson, N. B., and Siegel, D. A.
(2011). Systematic removal of neutral sugars within dissolved organic matter across ocean basins.Geophys. Res. Lett.38:L17606.
Gong, G., Woo, H. M., Um, Y., and Park, T. H. (2014). Lignin utilization by Bacillussp. associated with the growth enhancement and the molecular weight distribution change of lignin.New Biotechnol.31:S102.
Gonzales, J. M., Mayer, F., Moran, M. A., Hodson, R. E., and Whitman, W. B.
(1997).Microbulbifer hydrolyticusgen. nov., sp. nov., andMarinobacterium georgiensegen. nov., sp. nov., two marine bacteria from a lignin-rich pulp mill waste enrichment community.Int. J. Syst. Bacteriol.47, 369–376. doi:
10.1099/00207713-47-2-369
Hallam, S. J., Mincer, T. J., Schleper, C., Preston, C. M., Roberts, K., Richardson, P. M., et al. (2006). Pathways of carbon assimilation and ammonia oxidation suggested by environmental genomic analyses of marine crenarchaeota. PLoS Biol. 4:e95. doi: 10.1371/journal.pbio.00 40437
Hansell, D. (2005). Dissolved organic carbon reference material program.Eos Trans. Am. Geophys. Union86:318. doi: 10.1016/j.aca.2013.06.015
Hedges, J. I., Keil, R. G., and Benner, R. (1997). What happens to terrestrial organic matter in the ocean?Organ. Geochem.27, 195–212. doi: 10.1016/s0146- 6380(97)00066-1
Hernes, P. J., and Benner, R. (2003). Photochemical and microbial degradation of dissolved lignin phenols: implications for the fate of terrigenous dissolved organic matter in marine environments.J. Geophys. Res. Oceans108:3291.
Hernes, P. J., and Benner, R. (2006). Terrigenous organic matter sources and reactivity in the North Atlantic Ocean and a comparison to the Arctic and Pacific oceans.Mar. Chem.100, 66–79. doi: 10.1016/j.marchem.2005.
11.003
Huang, X. F., Santhanam, N., Badri, D. V., Hunter, W. J., Manter, D. K., Decker, S. R., et al. (2013). Isolation and characterization of lignin-degrading bacteria from rainforest soils.Biotechnol. Bioeng. 110, 1616–1626. doi: 10.1002/bit.
24833
Iverson, V., Morris, R. M., Frazar, C. D., Berthiaume, C. T., Morales, R. L., and Armbrust, E. V. (2012). Untangling genomes from metagenomes: revealing an uncultured class of marine Euryarchaeota.Science335, 587–590. doi: 10.1126/
science.1212665
Janusz, G., Pawlik, A., Sulej, J., ´Swiderska-Burek, U., Jarosz-Wilkołazka, A., and Paszczy´nski, A. (2017). Lignin degradation: microorganisms, enzymes involved, genomes analysis and evolution.FEMS Microbiol. Rev.41, 941–962. doi: 10.
1093/femsre/fux049
Kinsey, J., Corradino, G., Ziervogel, K., Schnetzer, A., and Osburn, C. (2017).
Formation of chromophoric dissolved organic matter by bacterial degradation of phytoplankton-derived aggregates.Front. Mar. Sci.4:430. doi: 10.3389/fmars.
2017.00430
Koch, B. P., Witt, M. R., Engbrodt, R., Dittmar, T., and Kattner, G. (2005).
Molecular formulae of marine and terrigenous dissolved organic matter detected by electrospray ionization Fourier transform ion cyclotron resonance mass spectrometry.Geochim. Cosmochim. Acta69, 3299–3308. doi: 10.1016/j.
gca.2005.02.027
Konneke, M., Bernhard, A. E., De La Torre, J. R., Walker, C. B., Waterbury, J. B., and Stahl, D. A. (2005). Isolation of an autotrophic ammonia-oxidizing marine archaeon.Nature437, 543–546. doi: 10.1038/nature03911
Landry, Z., Swan, B. K., Herndl, G. J., Stepanauskas, R., and Giovannoni, S. J.
(2017). SAR202 genomes from the dark ocean predict pathways for the oxidation of recalcitrant dissolved organic matter.mBio8:e00413-17. doi: 10.
1128/mBio.00413-17
Lavorivska, L., Boyer, E. W., and Dewalle, D. R. (2016). Atmospheric deposition of organic carbon via precipitation.Atmos. Environ.146, 153–163. doi: 10.1016/j.
atmosenv.2016.06.006
Liu, S., Parsons, R., Opalk, K., Baetge, N., Giovannoni, S., Bolanos, L., et al. (2019).
Different carboxyl-rich alicyclic molecules (CRAM) proxy compounds select distinct bacterioplankton for oxidation of DOM in the mesopelagic Sargasso Sea.Limnol. Oceanogr.(in press).
Loy, A., Maixner, F., Wagner, M., and Horn, M. (2007). probeBase - an online resource for rrna-targeted oligonucleotide probes: new features 2007.Nucleic Acids Res.35, D800–D804.
McNally, S. P., Parsons, R. J., Santoro, A. E., and Apprill, A. (2017). Multifaceted impacts of the stony coral Porites astreoides on picoplankton abundance and community composition.Limnol. Oceanogr.62, 217–234. doi: 10.1002/lno.
10389
Mopper, K., Kieber, D. J., and Stubbins, A. (2015). “Marine photochemistry of organic matter,” inBiogeochemistry of Dissolved Organic Matter, 2nd Edn, eds D. Hansell, and C. Carlson, (San Diego, CA: Academic Press).
Morris, R. M., Connon, S. A., Rappe, M., Vergin, K. L., Siebold, W. A., Carlson, C. A., et al. (2002a). High cellular abundance of the Sar11 picoplankton clade in seawater.Nature420, 806–809.
Morris, R. M., Rappe, M. S., Connon, S. A., Vergin, K. L., Siebold, W. A., Carlson, C. A., et al. (2002b). Sar11 clade dominates ocean surface bacterioplankton communities.Nature420, 806–810. doi: 10.1038/nature01240
Morris, R. M., Rappe, M., Urbach, E., Connon, S. A., and Giovannoni, S. J.
(2004). Prevalence of the Chloroflexi-related Sar202 bacterioplankton cluster throughout the mesopelagic zone and deep ocean.Appl. Environ. Microbiol.70, 2836–2842. doi: 10.1128/aem.70.5.2836-2842.2004
Nelson, C. E., and Carlson, C. A. (2012). Tracking differential incorporation of dissolved organic carbon types among diverse lineages of Sargasso Sea bacterioplankton.Environ. Microbiol.14, 1500–1516. doi: 10.1111/j.1462-2920.
2012.02738.x
Nelson, N. B., Carlson, C. A., and Steinberg, D. K. (2004). Production of chromophoric dissolved organic matter by Sargasso Sea microbes.Mar. Chem.
89, 273–287. doi: 10.1016/j.marchem.2004.02.017
Nelson, N. B., and Siegel, D. A. (2002). “Chromophoric Dom in the open ocean,”
inBiogeochemistry of Marine Dissolved Organic Matter, ed. D. A. C. C. Hansell, (San Diego, CA: Academic Press).
Nelson, N. B., Siegel, D. A., Carlson, C. A., Swan, C., Smethie, W. M., and Khatiwala, S. (2007). Hydrography of chromophoric dissolved organic matter in the North Atlantic.Deep Sea Res. Part I Oceanogr. Res. Pap.54, 710–731.
doi: 10.1016/j.dsr.2007.02.006
Orsi, W. D., Smith, J. M., Liu, S., Liu, Z., Sakamoto, C. M., Wilken, S., et al.
(2016). Diverse, uncultivated bacteria and archaea underlying the cycling of dissolved protein in the ocean.ISME J. 10, 2158–2173. doi: 10.1038/ismej.
2016.20
Ouverney, C., and Fuhrman, J. (2000). Marine planktonic archaea take up amino acids.Appl. Environ. Microbiol.66, 4829–4833. doi: 10.1128/aem.66.11.4829- 4833.2000
Parsons, R. J., Breitbart, M., Lomas, M. W., and Carlson, C. A. (2011). Ocean time-series reveals recurring seasonal patterns of virioplankton dynamics in the northwestern Sargasso Sea.ISME J.2011, 1–12. doi: 10.1038/ismej.2011.101 Parsons, R. J., Nelson, C. E., Carlson, C. A., Denman, C. C., Andersson,
A. J., Kledzik, A. L., et al. (2015). Marine bacterioplankton community
turnover within seasonally hypoxic waters of a subtropical sound: Devil’s Hole, Bermuda.Environ. Microbiol.17, 3481–3499. doi: 10.1111/1462-2920.
12445
Peng, R. H., Xiong, A. S., Xue, Y., Fu, X. Y., Gao, F., Zhao, W., et al. (2008).
Microbial biodegradation of polyaromatic hydrocarbons.FEMS Microbiol. Rev.
32, 927–955. doi: 10.1111/j.1574-6976.2008.00127.x
Pester, M., Schleper, C., and Wagner, M. (2011). The Thaumarchaeota: an emrging view of their phylogeny and ecophysiology.Curr. Opin. Microiol.14, 300–306.
doi: 10.1016/j.mib.2011.04.007
Porter, K. G., and Feig, Y. S. (1980). The use of Dapi for identifying and counting aquatic microflora.Limnol. Oceanogr.25, 943–948. doi: 10.4319/lo.1980.25.5.
0943
Stedmon, C. A., and Nelson, N. B. (2015). “The optical properties of Dom in the ocean,” inBioegeochemistry of Marine Dissolved Organic Matter, ed. D. A. C. C.
Hansell, (San Diego, CA: Academic Press).
Steinberg, D. K., Carlson, C. A., Bates, N., Johnson, R. J., and Michaels, F. A. (2001).
Overview of the Us Jgofs Bermuda atlantic time-series study (Bats): a decade- scale look at ocean biology and biogeochemistry.Deep Sea Res. Ii48, 1405–1447.
doi: 10.1016/s0967-0645(00)00148-x
Teira, E., Van Aken, H., Veth, C., and Herndl, G. J. (2006). Archaeal uptake of enantiomeric amino acids in the meso- and bathypelagic waters of the North Atlantic.Limnol. Oceanogr.51, 60–69. doi: 10.4319/lo.2006.51.1.0060 Tien, M., and Kirk, T. (1984). Lignin-degrading enzyme from phanerochaete
chrysosporium: purification, characterization, and catalytic properties of a unique H2O2-requiring oxygenase.Proc. Natl. Acad. Sci. U.S.A.81, 2280–2284.
doi: 10.1073/pnas.81.8.2280
Varela, M. M., Van Aken, H. M., and Herndl, G. J. (2008). Abundance and activity of Chloroflexi-type Sar202 bacterioplankton in the meso- and bathypleagic waters of the (sub)tropical Atlantic. Environ. Microbiol. 10, 1903–1911.
doi: 10.1111/j.1462-2920.2008.01627.x
Varela, M. M., Van Aken, H. M., Sintes, E., Reinthaler, T., and Herndl, G. J.
(2011). Contribution of Crenarchaeota and Bacteria to autotrophy in the North Atlantic interior.Environ. Microbiol.13, 1524–1533. doi: 10.1111/j.1462-2920.
2011.02457.x
Walker, C. B., de la Torre, J. R., Klotz, M. G., Urakawa, H., Pinel, N., Arp, D. J., et al. (2010). Nitrosopumilus maritimus genome reveals unique mechanisms for nitrification and autotrophy in globally distributed marine crenarchaea.Proc.
Natl. Acad. Sci. U.S.A.107, 8818–8823. doi: 10.1073/pnas.0913533107 Williams, P. M., and Druffel, E. R. M. (1987). Radiocarbon in dissolved organic-
matter in the Central North Pacific-Ocean.Nature330, 246–248. doi: 10.1038/
330246a0
Conflict of Interest:The authors declare that the research was conducted in the absence of any commercial or financial relationships that could be construed as a potential conflict of interest.
Copyright © 2019 McDonald, Achterberg, Carlson, Gledhill, Liu, Matheson-Barker, Nelson and Parsons. This is an open-access article distributed under the terms of the Creative Commons Attribution License (CC BY). The use, distribution or reproduction in other forums is permitted, provided the original author(s) and the copyright owner(s) are credited and that the original publication in this journal is cited, in accordance with accepted academic practice. No use, distribution or reproduction is permitted which does not comply with these terms.
![FIGURE 3 | (A) CDOM absorption coefficient (m – 1 ) for the Lignin treatment [250–450 nm, for days 2–5 (T 4 –T 9 )]](https://thumb-eu.123doks.com/thumbv2/1library_info/5311911.1679017/6.892.74.823.83.985/figure-cdom-absorption-coefficient-lignin-treatment-nm-days.webp)