Master Thesis
Cephalopods of the Sargasso Sea Distribution patterns in relation to
hydrographic conditions
Christian-Albrechts-Universität zu Kiel
Alexandra Lischka
Masterarbeit
“Cephalopods of the Sargasso Sea Distribution patterns in relation to
hydrographic conditions”
Christian-Albrechts-Universität zu Kiel Mathematisch-Naturwissenschaftliche
Fakultät
Sektion Biologie
Prof. Dr. G. Hartl CAU Kiel Zoologisches Institut,
Populationsgenetik
PD Dr. R. Hanel Thünen Institut für
Fischereiökologie, Hamburg-Altona Alexandra Lischka
(1009628)
Eidesstattliche Erklärung
Hiermit erkläre ich, Alexandra Lischka,
dass ich die vorliegende Masterarbeit selbständig verfasst sowie alle inhaltlichen und wörtlichen Zitate als solche gekennzeichnet habe.
Diese Arbeit hat in gleicher oder ähnlicher Form noch keiner Prüfungsbehörde vorgelegen.
Kiel, den 25. November 2015
Acknowledgement
Mein Dank gilt zunächst Dr. Uwe Piatkowski für die Einarbeitung in die Cephalopoden-Thematik, ohne ihn hätte ich mir nicht einen solch taxonomischen Überblick verschaffen können. Ich danke Ihm für seine Geduld, den wissenschaftlichen Beistand, die konstruktiven Vorschläge sowie die Ermöglichung der vielen wissenschaftlichen Kontakte.
Zudem danke ich PD Dr. Reinhold Hanel für die
Bereitstellung des Themas und seinen wissenschaftlichen Rat. Durch seine Betreuung wurde es mir ermöglicht, Cephalopoden nicht nur aus dem Museumsregal zu bestimmen.
Professor Dr. Günther Hartl möchte ich ganz besonders für die Übernahme der Zweitkorrektur danken sowie die Unterstützung während meines Studiums, was außerstudienplanmäßige Praktika angeht.
Vielen Dank an Dr. Malte Demerau für die tolle
Einarbeitung in die DNA Sequenzierung und das Erstellen phylogenetischer Stammbäume. Danke an Dr. Mike Miller für die Stationskarten und seinen Tintenfischenthusiasmus, sowie an Dr. Håkan Westerberg für sein ozeanographisches Fachwissen. Ich danke Dr. Rabea Diekmann für die tatkräftige Unterstützung bei der PCA und Claudia Klimpfinger für die Zeichnungen meines Deckblattes.
„Jede Thesis trägt die Handschrift des Erstellers, und doch ist sie niemals die Arbeit eines Einzelnen.“ In diesem Sinne danke ich allen weiteren für die wertvolle Unterstützung während meiner Masterarbeit.
Table of Contents
Table of Contents
1. Introduction 11
1.1. The Sargasso Sea . . . 11
1.2. Pelagic fauna of the Sargasso Sea . . . 12
1.3. Cephalopods . . . 13
1.4. Barcoding . . . 19
1.5. Aim of the study . . . 21
2. Material and Methods 22 2.1. Sampling and study areas . . . 22
2.2. Species Identification . . . 26
2.3. Data analysis . . . 27
2.4. Barcoding . . . 29
3. Results 31 3.1. Walther Herwig cruise 373 . . . 31
3.1.1. Hydrography . . . 31
3.1.2. Abundance of cephalopods and trawl comparison . . . . 33
3.1.3. Taxonomic composition of catches . . . 34
3.1.4. Species distributions and sizes . . . 37
3.1.5. Species Richness and relative abundance in relation to Distribution . . . 47
3.2. Barcoding . . . 49
3.3. Maria Merian 41 . . . 54
3.3.1. Hydrography . . . 54
3.3.2. Abundance of cephalopods and Trawl comparison . . . . 56
3.3.3. Taxonomic composition / Systematics and Distribution . 57 3.3.4. Species distributions and morphometrics . . . 58
3.3.5. Species Richness and relative abundance in relation to distribution . . . 74
3.3.6. Cephalopod abundance in relation to Hydrography . . . 77
3.3.7. Comparison of day and night trawls . . . 83
4. Discussion 85
A. Species Tables 97
References 104
List of Figures
List of Figures
1. Map of the Sargasso Sea . . . 12
2. Net primary production of World Oceans . . . 13
3. Pelagic marine food web . . . 14
4. World catch rate of cephalopods . . . 14
5. Orders of living cephalopods . . . 16
6. Anatomical features of cephalopod species . . . 17
7. Reproduction model of Todarodes pacificus . . . 18
8. Paralarval ommastrephid life stages . . . 19
9. Research area during Wh 373 . . . 23
10. Research area during MSM 41 . . . 23
11. Sampling gear used during MSM 41 . . . 24
12. Schematic drawing of an IKMT net . . . 25
13. Schematic drawing of the Manta Trawl . . . 25
14. Schematic drawing of the MOCNESS net . . . 26
15. Oversea surface temperature during WH 373 . . . 32
16. SST and salinity from WH 373 CTD casts . . . 33
17. Depths profiles of WH 373 stations . . . 33
18. Composition of cephalopod families during WH 373 . . . 35
19. Chtenopteryx sicula. Geographical distribution according PMT catches . . . 39
20. Hyaloteuthis pelagica. Geographical distribution according PMT catches . . . 42
21. Hyaloteuthis pelagica. Histogram of DML . . . 42
22. Ommastrephes bartramii. Geographical distribution according PMT catches . . . 43
23. Ommastrephidae. Histogram of DML sampled with PMT . . . 43
24. Onychoteuthis banksii and Onykia carriboea. Geographical dis- tribution according PMT catches . . . 44
25. Onychoteuthidae. Histogram of DML sampled with PMT & IKMT 45 26. Pyroteuthidae. Histogram of DML sampled with PMT & IKMT 46 27. Kitecharts demonstrating the catch rates among WH 373 stations in relation to distribution . . . 49
28. Phylogenetic trees based on the COI gene locus of 33 cephalopod specimens . . . 51
29. SST maps during MSM 41 . . . 55
30. Depth profiles of MSM 41 stations . . . 56
31. General composition of cephalopod families of the total catch during MSM41. . . 58
List of Figures
32. Typical cephalopod community of a sampled station from petri
dish. . . 58
33. Distribution of Ancistrocheirus sp. and histogram . . . 60
34. Distribution of Chtenopteryx sicula individuals and histogram . 61 35. Distribution of cranchiids according to the station grid and histograms . . . 62
36. Distribution of Helicocranchia sp. and histogram . . . 63
37. Distribution of Leachia spp. and histogram . . . 64
38. Distribution of MSM 41 enoploteutid cephalopods. . . 65
39. Distribution of Abraliopsis morisii specimens and histogram . . 66
40. Distribution of Selenoteuthis scintillans specimens and histogram 67 41. Distribution of ommastrephids according to the station grid and histograms . . . 69
42. Size-frequency distribution of Ommastrephidae individuals. . . . 69
43. Distribution of onychoteuthids according to the station grid and histograms . . . 71
44. Onychoteuthidae. Size-frequency distribution of individuals. . . 72
45. Size-frequency distribution of Onykia carriboea individuals . . . 72
46. Distribution ofPyroteuthis margaritifera according to the station grid and histogram . . . 73
47. Distribution of Japetella diaphana according to the station grid and histogram . . . 74
48. Boxplots of collected specimens during MSM 41 . . . 76
49. Map of the study area during MSM 41 with the division of the latitudinal sections used for SIMPER analysis. . . 76
50. Catch rates of cephalopods of the most abundant families at the 49 stations . . . 79
51. PCA based on chord distances of cephalopod abundances . . . . 80
52. PCA based on chord distances of cephalopod abundances show- ing scores . . . 81
53. RDA based on chord distances of cephalopod early life stages . . 82
54. Sample Scores of RDA based on chord distances of cephalopod assemblages in relation to SST . . . 83
55. Boxplots of specimens/species collected in relation to day and night hauls . . . 83
56. MDS plots of cephalopod assemblages during day and night . . 84
57. General distribution of Leachia sp. during WH 373 . . . 87
58. General distribution of Japetella diaphana during WH 373 . . . 88
59. Table 1: Sepiida, Oegopsida . . . 97
60. Table 2: Oegopsida . . . 98
List of Tables
61. Table 3: Cranchiidae . . . 99
62. Table 4: Cranchiidae . . . 100
63. Table 5: Ommastrephidae & Onychoteuthidae . . . 101
64. Table 6: Oegopsida . . . 102
65. Table 7: Octopoda . . . 103
List of Tables
1. Cephalopods collected by different gear. . . 342. Abundance of collected cephalopods by PMT and IKMT hauls during WH373. . . 36
3. Diversity indices for the 7 stations of the pelagic midwater trawl during WH373 . . . 48
4. Summary of sequenced specimens compared to sequences avail- able in GenBank . . . 50
5. Cephalopods of the MSM41 cruise, collected by different gear. . 56
6. Species table of the specimens collected during MSM 41. . . 59
7. Diversity indices for the 49 stations during MSM41 . . . 75
8. SIMPER analysis discriminating species/families . . . 77
9. Correlations between the environmental variables and the canon- ical axes of the conducted RDA. . . 82
10. Discrimination of families between day and night hauls. . . 84
Abstract
A comprehensive collection of mainly early life cephalopods that were sampled during two research cruises to the Sargasso Sea with the FRV Walther Herwig III in April 2014, and the RV Maria S Merian in April 2015, is analysed in this work. In 2014, 714 specimens were collected by a pelagic midwater trawl, and further 1,349 specimens by an Isaacs-Kidd Midwater Trawl (IKMT). A total of 2,487 cephalopods were caught during the cruise in 2015. They belonged to 36 species (20 families). The most abundant family was represented by the Flying squids (Ommastrephidae). Identification of cephalopods was supported by DNA barcoding based on partial COI sequences. The subtropical convergence zone (STCZ) was found at approximately 27°N. This frontal system is characterised by a sharp near-surface temperature gradient and divides the Sargasso Sea into a northern and a southern area. This distinction was also reflected in the cephalopod community composition. For example, the cranchiidLeachia lemur prevailed in the northern part, while the cirrate octopod, Japetella diaphana was mainly distributed in the southern part of the study area. PCA and RDA analyses detected a significant correlation between species occurrence and sea surface temperature. Ordination analysis (MDS) showed significant differences in the cephalopod assemblages between day and night with midwater species (Enoploteuthidae, Pyroteuthidae) dominating the night catches, probably due
to their upward migration into the top 200 m during the night.
Zusammenfassung
Während zweier aufeinanderfolgender Expeditionen der deutschen Forschungss- chiffe Walther Herwig (WH 373) und Maria S. Merian (MSM 41) in die Sargas- sosee in den Jahren 2014 und 2015 wurden frühe Lebensstadien sowie subadulte Cephalopoden gesammelt. 2014 wurden insgesamt 714 Individuen mithilfe eines pelagischen Schleppnetzes (PMT) und weitere 1,349 Cephalopoden mithilfe eines engmaschigem Netzes (IKMT) gefangen. Insgesamt 2,487 Cephalopo- den wurden während der Forschungsfahrt im Jahr 2015 gesammelt, welche 36 Arten (20 Familien) angehören. Die häufigste Familie stellten die Flugkalmare (Ommastrephidae) dar. Mithilfe von genetischen Barcoding Studien des COI Genlokus sollte die morphologische Identifizierung gewisser Arten unterstützt werden. Des Weiteren wurde die subtropische Konvergenzzone bei ungefähr 27°N identifiziert. Dieses Frontensystem wird über einen starken oberflächen- nahen Temperaturgradienten ausgezeichnet, der die Sargasso See in einen nördlichen und einen südlichen Teil trennt. Diese Unterteilung spiegelt sich ebenfalls in der Artenzusammensetzung wieder. Beispielsweise dominierte der Glaskalmar, Leachia lemur, im nördlichen Areal, wohingegen der cirrate Ok- topode, Japetella diaphana, hauptsächlich im südlichen Teil des untersuchten Gebietes angetroffen wurde. PCA und RDA Analysen wiesen auf eine sig- nifikante Korrelation zwischen Artenvorkommen und Oberflächentemperatur.
Multidimensionale Skalierung (MDS) detektierte signifikante Unterschiede in der Cephalopodengemeinschaft bezüglich der Tag- und Nachtfänge von pelagis- chen Arten (Enoploteuthidae, Pyroteuthidae), welche überwiegend in den Nachtfängen vorkamen. Dies kann vermutlich mit nächtlichen vertikalen Migra- tionsmustern in die oberen 200 m der Wassersäule erklärt werden.
1. | Introduction
1. Introduction
1.1. The Sargasso Sea
The Sargasso Sea is famous for its myths around the Bermuda triangle and the presence of the pelagic brown algae Sargassum whose occurrence tradi- tionally defined the boundaries of this ocean (Andersen et al., 2011). Located in the western North Atlantic Ocean, and also known as the North Atlantic Subtropical Gyre, the Sargasso Sea is bordered by several currents (Fig. 1).
The Gulf Stream marks the western and the Canaries Current the eastern borders. The northern and southern frontiers are marked by the North Atlantic and the North Equatorial Current (Voorhis and Hersey, 1964). Except for the island of Bermuda, the Sargasso Sea does not contain any land masses. In its centre, between 20° and 30°N, the Subtropical Convergence Zone (STCZ) is located. This is the latitude band which separates the westerlies to the easterly (easterlies) trades where a distinct temperature front develops from fall to spring (Halliwell et al., 1994; Voorhis and Hersey, 1964) . Colder northern waters meet tropical southern water masses which affects near-surface temperature as well as the salinity gradients and results in a more productive, colder northern and a warmer, less productive southern region. During winter, a large water mass of about 18°C, which varies highly in intension and volume, located around 31°N, is ventilated to the surface which extends to the permanent thermocline (Pacariz et al., 2014). The surface waters begin to stratify during spring which affects phytoplankton bloom. The seasonal changes only occur north but not south to the STCZ, which mark the southern Sargasso Sea as an even more oligotrophic area (DuRand et al., 2001).
Thermal fronts, irregular mesoscale eddies (Eden and Dietze, 2009; McGillicuddy et al., 1998), advective transport of water masses (Palter et al., 2005) and a seasonal convective overturn (Hansell and C. A. Carlson, 2001) have strong influences on the planktonic system (Andersen et al., 2011). Bermuda Atlantic Time series Study (BATS) and the Bermuda Testbed Mooring (BTM) illustrate the physical, biogeochemical as well as biological oceanography of this area in relation to seasonal changes (Dickey et al., 1998).
1. | Introduction
Fig. 1: Map showing the Sargasso Sea including its restricting currents (obtained from: http://www.svgoldenglow.com).
1.2. Pelagic fauna of the Sargasso Sea
It is known for long that the Sargasso Sea is referred to as an oceanic desert, an oligotrophic, low productive ocean (Menzel and Ryther, 1960). Due to the stratification of the surface waters, nutrient availability is reduced to the euphotic zone, which affects phytoplanktonic primary production and thus limits the zooplanktonic food supply (Riley, 1957). Because of the frontal temperature system that divides the Sargasso Sea into a northern and a southern part, it cannot be defined as a homogeneous ocean. This division also affects the primary productivity as represented in fig 2.
Concerning the Sargasso Sea pelagic food web, the main part of zooplankton community is represented by small copepods, estimated abundance of 75 to 87%
in the upper 500 m, (Böttger, 1982). Copepods as well as other zooplankton organisms, e.g. pteropods, provide an important food resource for early life stages of many fish species. Associated with many juvenile fish species, also different eel larvae, the so called leptocephali, inhabit the Sargasso Sea (Riemann et al., 2010). Amongst them, young American and European eel larvae occur before they start their long juvenile migrations to fresh waters or coastal marine areas (Miller and J. McCleave, 1994; Schmidt, 1923; Tesch and White, 2008).
Several early life stages of mesopelagic fish were found to be associated with pelagic Sargassum. Especially fish species like tuna, billfish or marlin play an
1. | Introduction
Fig. 2: (A) World Ocean means of net primary production along selected areas, including the northern Sargasso Sea (3a) and the southern Sargasso Sea (3b); (B) Mean yearly sea surface temperature (from Rosa et al., 2008, adapted from Backus et al. 1977).
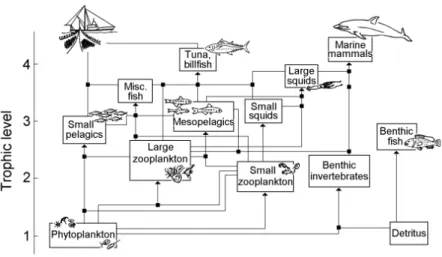
important role as apex predators in pelagic marine food webs (Fig. 3). Within the food web, fish larvae and some copepods are generally planktivorous feeders (Luckhurst, 2014). Jellyfishes occur as predators but also contribute to the diet of sea turtles like the Leatherback turtle (Dermochelys coriacea), which occurs as a migratory species in the Sargasso Sea as well (Gray et al., 2006).
1.3. Cephalopods
Ecology
Cephalopods form one of the key components of the pelagic food web of the Sargasso Sea. Together with early life stages of marine fishes, young cephalopods constitute a major part of the macrozooplankton, which is an essential link in the marine food web. Most pelagic cephalopods are short-lived species with a general life span of less than two years (Boyle, 1987). Due to their fast growth rates, they generally spend a short time at lower trophic levels (Arkhipkin et al., 1998). Adult cephalopods are the major prey of marine top predators in high seas regions such as the Sargasso Sea (Fig. 3). For example swordfish, white marlins (Sato et al., 2004) or common dolphinfish (Oxenford and Hunte, 1999) are known to frequently feed on cephalopods. Furthermore, worldwide, approximately 4 million tonnes of cephalopods have been harvested worldwide in 2014 for human consumption (FAO, 2014), Fig. 4.
1. | Introduction
Fig. 3: Pelagic marine food web of an open-sea ecosystem (after Pauly, 1999).
Fig. 4: World catch rate of cephalopods from 1950 to 2013 (FAO, 2015).
Concerning the cephalopod diversity in the Sargasso Sea, species richness differs along the STCZ, marking the northern part (Zone 3a, Fig. 2) with higher levels of cephalopod diversity in comparison to the less diverse southern part (Diekmann and Piatkowski, 2002). Those differences can be linked to lower sea surface temperatures as well as higher net primary production in the northern area of the Sargasso Sea (Rosa et al., 2008). The thermal front in the Sargasso Sea represents a pronounced faunal boundary concerning cephalopod abun- dance and diversity with restricting certain species occurrences to the southern
1. | Introduction
or northern parts (Diekmann and Piatkowski, 2002).
Taxonomy
The exclusively marine class of Cephalopoda belongs to the phylum Mollusca.
It represents an ancient group with a fossil record of approximately 10,500 species. Approximately 900 recent species are described, belonging to two main groups, the Nautiloidea and the Coleoidea (Fig. 5). The Nautiloidea only comprise a few species with the pearl boat, Nautilus pompilius being the most prominent, characterized by a typical external shell. The majority of recent cephalopod species belongs to the Coleoidea which are divided into four orders: the Sepioidea (cuttlefishes and sepiolids), the Teuthoidea (squids), the Vampyromorpha (vampire squid), and the Octopoda (octopuses) (Jereb and Roper, 2010), Fig. 5.
The major common feature of the Sepioidea and Teuthoidea are the four arm pairs and the two tentacles. This group comprises cuttlefishes and squids.
Cuttlefishes exhibit an internal shell, the cuttlebone. As they are able to rapidly change their skin colour and shape, they are often referred to as the chameleons of the ocean (Hanlon et al., 1985; Mäthger et al., 2006). Important characteristics for the identification of cephalopods are the shape and form of the arms and suckers. In cuttlefishes and squids, especially the club or armature, the distal part of the tentacles, is an important identification trait (Fig. 6).
In male cephalopods one arm is specialized for the transfer of spermatophores to the female, which is called “hectocotylus”. For species identification of male cephalopods, the hectocotylus represents an important feature (Robson, 1926). Squids (Teuthoidea) can be divided into two main groups, the Myopsida, which exhibit a cornea covering their eyes and the Oegopsida, which lack such a cornea (Fig. 6 b). Squids have no cuttlebone but a gladius, an internal structure primarily consisting of chitin. For identification, many features have to be considered, some important ones are the funnel- as well as the mantle locking cartilages or the funnel groove. The buccal anatomy also represents an important characteristic including the buccal connectives and crown in the middle of the arms, which lead to the chitineous beak (Jereb and Roper, 2010).
The eight-armed octopods (Octopoda) can be divided into finned cirrate, and incirrate octopods. Cirrate octopods exhibit spikes, the so called cirri on their arms which they use in feeding. Most of them are typical inhabitants of the deep-sea. The incirrate octopods are mostly bottom dwelling benthic octopuses, with many still undescribed species (Fig. 6, Allcock et al., 2006).
1. | Introduction
Nautiloidea
Coleoidea
Sepioidea
Teuthoidea Myopsida
Oegopsida Idiosepiidae
Sepiadariidae
Sepiidae
Sepiolidae
Spirulidae
Octopoda
Cirrata
Incirrata Vampyroteuthidae
Fig. 5: Orders of living cephalopods (Jereb and Roper, 2010).
1. | Introduction
Fig. 6: (a) Teuthida specimen, important traits are the different eye types (Myop- sid/Oegopsid squid), the photophore pattern, the funnel and mantle locking cartilages.
(b) Incirrate Octopod cephalopod (Roper and Lu, 1979).
Cephalopod early life stages
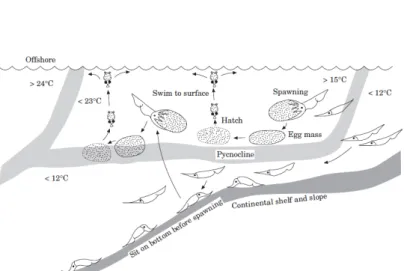
Knowledge about cephalopod early life stages is generally sparse and often restricted to economically important species (Boletzky, 2003). Several oceanic cephalopods exhibit a warm water associated life cycle that also exploits the opportunities along shelf breaks, which includes bottom near spawning (Laptikhovsky and Nigmatullin, 1993). For exampleTodarodes pacificus (Om-
mastrephidae), one of the most important commercially exploited squid, spawns its egg masses at the isopycnic surface around 15°C. Early life stages then migrate vertically from the thermocline water layer to lower epipelagic waters at 100-150 m of depth. Subadults then descend to deeper water layers and supposedly mate as adults close to the bottom of slopes before they start the upward migration for spawning (Sakurai et al., 2000), Fig. 7.
1. | Introduction
Fig. 7: Reproduction model ofTodarodes pacificus, including spawning at the isocline, ascending hatchlings and migration of subadults to deeper waters (Sakurai et al., 2000).
All cephalopods show a direct development without a true metamorphosis.
Despite the lack of a true larval stage, the early life stages of many taxa not only differ in size but also in external morphology from the adult life forms and are called “paralarval” stages (R. E. Young, 1988). One example for a striking differentiation during the paralarval development is represented by the family Ommastrephidae (Flying squids). Newly hatched ommastrephid squid tentacles are fused into a “proboscis”, which starts to separate into the tentacles by a mantle length of 3-4 mm (Fig. 8). Because of this dimorphism, they were formerly mistaken for an own taxon, calledRhynchoteuthis (Chun, 1903). By reaching a dorsal mantle length of about 10 mm the separation is finished for most species. During the separation process, tentacles and arms gain in size whereas the growth of the mantle is reduced (Chun, 1903; Vidal, 1994). Because of these distinct morphological changes during development, the early life stages of ommastrephid squid might allow the term “larvae” (Boletzky, 1974). There is, however, no single morphological change common to all cephalopods (compared to e.g. the notochord flexion in fish), therefore the term “larvae” should be avoided (Shea and Vecchione, 2010).
1. | Introduction
Fig. 8: Above: Growth of an ommastrephid squid illustrating the separation of the proboscis from 1.4 to 9 mm DML (R. E. Young and Hirota, 1990). Below: Paralarval ommastrephid life stages.
During the planktonic life stage, the cephalopod paralarvae predatorily feed on zooplankton and are active swimmers by using jet propulsion. However, as for other early marine life stages, their distribution strongly dependends on the oceanic circulation (Moreno et al., 2009; Shea and Vecchione, 2010) .
1.4. Barcoding
Due to the morphological differentiation during growth, identification of young cephalopods is not always clear, especially if important taxonomic traits are not yet fully developed. Another tool, besides morphological identification, represents the analysis of genetic differences between species.
The idea of facilitating species identification by comparing selected gene loci has attracted biologists on a broad range (Hebert and Gregory, 2005). The method of “DNA Barcoding” is widely applied, which means that short DNA sequences are used for species identification, similar to a supermarket scanner.
The obtained sequences are then provided to a public database, like the Barcode of Life Database (BOLD) or NCBI’s GenBank in order to cover a broad range of taxa (Hebert et al., 2003). A recent taxonomic tool, including marine taxonomy, has been the use of the mitochondrial cytochrome c oxidase subunit I (COI) DNA sequences for species identification and clarification of taxonomic
1. | Introduction
status (Hebert et al., 2003). Especially for fish species, a variety of projects focus on this method, which integrates with the Fish Barcode of Life Initiative (FISH-BOL; www.fishbol.org; Hanner et al., 2005). COI is a relatively fast evolving gene with a higher molecular evolutionary rate than those of 12S and 16S rDNA (Knowlton and Weigt, 1998). It is flanked by highly conserved DNA regions, enabling the use of universal primers for amplification in a wide range of taxa (Folmer et al., 1994; Zhang and Hewitt, 1997). Nonetheless, amino-acid sequence changes of COI occur more slowly compared to most other mitochondrial genes making it highly suitable to delimit taxa on the species level (Lynch and Jarrell, 1993). Since the Cephalopod International Advisory Council (CIAC) meeting in February 2006, there is an increasing interest in contributing genetic sequences of cephalopods to the Cephalopod Barcode of Life Database (Bonnaud et al., 1997; Strugnell and Lindgren, 2007). Up to now, many cephalopod barcoding projects have been approached but an extensive database, as established for e.g. fishes, is still missing. Especially for so called cryptic species or species complexes, groups that can even comprise several genera, morphological identification is not always sufficient. One example for a species complex in cephalopods represents the hooked-squid, Onykia carriboea. In comparing genetic sequences, morphological species identification can be supported. So far, 48.395 nucleotide sequences of cephalopods are listed in GenBank (http://www.ncbi.nlm.nih.gov/genbank), with more than 50%
deriving from octopods. However, sequences from rare as well as economically negligible species are still lacking.
1. | Introduction
1.5. Aim of the study
During two oceanographic expeditions on board the German research vessels Walther Herwig (cruise number WH373) and Maria S. Merian (cruise number MSM41), intense plankton sampling in an overlapping area of the Sargasso Sea at the same season of two consecutive years (2014, 2015) was conducted. As cephalopods represented one of the major macrozooplanktonic groups in the Sargasso Sea, this study focuses on the distribution and abundance of early life stages of cephalopods in this area.
The central objective of the study was to identify if the Subtropical convergence zone (STCZ) has effects on the composition of cephalopod communities in the Sargasso Sea. Therefore, species assemblages of this area were to be de- scribed with mostly morphologically based species identification and additional molecular genetic analyses. Those were conducted especially to support the morphological identification of several hooked-squids (family Onychoteuthidae), including the potentially cryptic species complex formed by Onychoteuthis banksii and Onykia carriboea, which might include more than two species. Fur-
thermore, three morphotypes belonging to the flying squids, Ommastrephidae, were identified and compared to the molecular data. In addition, DNA from the most abundant species of the research area was sequenced as well as from two rare morphotypes. One of them potentially representing the early life stage of the giant squid, Architeuthis dux, and the other resembling a cycloteuthid, referred to as “Stern”.
This study represents the most comprehensive analysis on early life stages of cephalopods ever conducted in the Sargasso Sea and will be compared to other subtropical and tropical oceans.
2. | Material and Methods
2. Material and Methods
2.1. Sampling and study areas
FFS Walther Herwig III cruise 373
The cephalopod specimens were sampled in the Sargasso Sea from March to April 2014 during cruise 373 of the German vessel Walther Herwig. Focus of the cruise was the investigation of distribution and abundance of European eel (Anguilla anguilla) early development stages and its accompanying fauna.
The study area covered the central Sargasso Sea with stations ranging from 36° to 24°N and 70° to 27°W. Sea surface temperatures were generated from the National Oceanic and Atmospheric Administration, NOAA/ESRL Physical Sciences Division, Boulder Colorado, http://www.esrl.noaa.gov/psd/) and illus- trate the temperature front around 26° to 28°N (Fig. 9). Sampling was mainly carried out with an Isaacs-Kidd Midwater Trawl (IKMT) with a 6.2 m2 mouth opening, a length of 10 m, and 0.5 mm mesh (Hydro-Bios Apparatebau GmbH).
In total 56 IKMT tows along seven north-to-south transects as well as nine additional IKMT stations were sampled between the core study area and Ponta Delgada, Azores (Fig. 9). Double oblique IKMT tows covered the epipelagic zone, from sea surface to 300 m of depth. The seven additional IKMT tows were double oblique tows down to 150 m depth except for one single oblique tow down to 700 m. Each IKMT tow filtered between 29,652 and 113,447 m3 water (mean: 72,825 ± 17,277 m3). At seven sampling stations also a pelagic fisheries trawl (Multisampler, Engel Netze) was used that had a width of 45 m, a height of 30 m, a length of 145 m and mesh sizes from 180 cm down to 80, 40, 20, 10, 8, 6, 4 cm in the codend. Deployment of this midwater trawl was through the ships back with the help of trawl cables on both sides. The mean towing speed was 3.4 knots. Five tows were conducted down to 300 m, one to 700 and another one to 1,000 m. Water filtered by the pelagic trawl could not be accurately esti- mated because of the different mesh sizes. Therefore, cephalopod yield of each pelagic trawl sample is expressed in absolute numbers for each species occurring.
2. | Material and Methods
Fig. 9: Research area including the station grid of WH 373 in relation to the SST at the beginning of the cruise. Dark dots indicate PMT and orange dots IKMT stations.
Map provided by M. Miller, 2015.
Maria S. Merian cruise 41
In April 2015 cephalopods were collected during the cruise MSM 41 of the German research vessel Maria S. Merian. One of the major tasks of this cruise was the investigation of abundance and biomass of macrozooplankton in the Sargasso Sea. The study area ranged from 22° to 31°N and 58° to 70°W, with a total of 49 oceanographic stations that were arranged along five north-to-south transects (Fig. 10).
Fig. 10: MSM 41 cruise map including the station grid of the study area in relation to SST. Dark dots indicate night and white dots day hauls. Map provided by M. Miller, 2015.
2. | Material and Methods
Sampling Gear
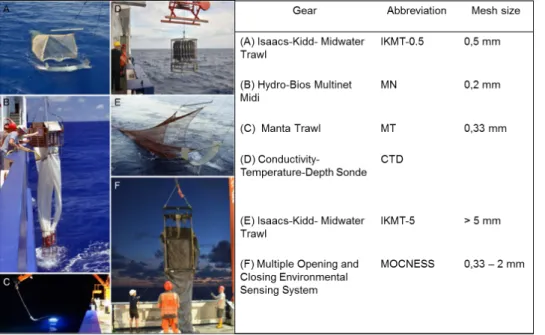
Stations were sampled using six types of gear: a CTD Rosette (Sea-Bird Electronics Inc, USA) for recording hydrographical data, and taking water samples; and several nets to collect macroplankton (IKMT-0.5, IKMT-5, Manta Trawl, MOCNESS, MSNV; Fig. 11).
Fig. 11: Sampling gear used during MSM 41. Photos from cruise report MSM 41, 2015.
The CTD, short for Conductivity-Temperature-Depth, is a sonde, which records hydrographical parameters such as pressure, temperature, conductivity, and which has attached a metal rosette wheel with bottles for taking water samples at selected depths (Fig. 11D). It was always deployed in advance of the net tows at each sampling site down to 500 or 1,000 m, respectively. At each station plankton was collected by double oblique tows using the Isaacs-Kidd Midwater Trawl (IKMT) with a 6.2 m2 mouth opening, a length of 10 m, and 0.5 mm mesh size (Hydro-Bios Apparatebau GmbH, Germany). Sampling was conducted from sea surface to 300 m of depth and lasted for about 3 hours. At towing speeds of approximately 3 knots, a depressor is responsible for the net opening and zooplankton was collected in a net bag (Fig. 11A). The filtered water volume of the nets was estimated using a flow meter (General Oceanics, USA), the size of the net mouth opening and a calibration factor (Miller and McCleave, 1994 & 2007). In total, 26 stations were sampled at night and
2. | Material and Methods
23 stations during daytime. At selected stations, additional hauls with an IKMT net of 5 mm mesh size (13.5 m2 mouth opening) were conducted to catch larger leptocephali and cephalopods (Fig. 11E). 10 hauls were performed in total with this net type, usually during day or dawn, covering stations from each transect. The IKMT tows were conducted with a major focus on the distribution and abundance of the European as well as the American eel larvae (Anguilla anguilla, A. rostrata). Besides leptocephali, cephalopods were quantitatively sorted out from the plankton samples.
Fig. 12: Schematic drawing of an IKMT net (Hydro-Bios Apparatebau GmbH, Ger- many)
The Manta Trawl is a net designed for surface sampling (90 cm x 16 cm net opening) with a manta ray resembling shape (Design by Jens Harder, MPI Bremen, Germany). During the cruise it was mainly used for collecting microplastic particles and neuston organisms (Fig. 13).
Fig. 13: Schematic drawing of the Manta Trawl, including unit sizes.
Alternating with a vertical multi net (MN), stratified vertical tows of the MOCNESS were conducted at every second station down to 500 m except for
2. | Material and Methods
the middle transect at 64°W where the MOCNESS was deployed down to 1,000 m. MOCNESS stands for Multiple Opening/Closing Net and Environmental Sensing System and each net can be opened and closed independently at se- lected depths (Wiebe, 1976; Fig. 14).
Fig. 14: MOCNESS net with net depths indicated for the 500 m tows. Depths of the nets for the 1,000 m tow are shown in italic letters (drawing after the Gulf of Maine Research Institute).
2.2. Species Identification
Early life stages of cephalopods as well as juvenile specimens were quantitatively sorted out from all sampling nets and identified to the lowest taxonomic level possible. The identification was based on published keys (Diekmann and Piatkowski, 2002; Jereb and Roper, 2010; Nesis, 1987; Sweeney et al., 1992).
For the identification, specimens were examined using a stereomicroscope.
The dorsal mantle length of the specimens was measured and species were photographed (Camera IC 80H, Binocular MZ8, 10-40x; Leica Microsystems GmbH, Germany). Specimens were either frozen at -20°C or conserved in 70%
ethanol. Some specimens that were in good condition were fixed in 4% formalin for later detailed detailed morphological studies. Tissue samples of each species were taken from freshly caught specimens and fixed in 70% ethanol for further genetic analyses.
2. | Material and Methods
2.3. Data analysis
Univariate data analysis
The largest amount of cephalopods was caught with the smaller mesh size IKMT net during the MSM 41 cruise.Therefore, this comprehensive data set was used to investigate distribution and diversity patterns of cephalopods and to describe their community structure in the Sargasso Sea cephalopod densities (n/10,000 m3) were calculated for each station and used for the spatial analysis of the community structure. In order to smoothen the dominating effect of the most abundant species, the catch numbers of each species were fourth-root transformed (Field et al., 1982). The median catch rates of cephalopod species as well as specimens were calculated for the latitudes and longitudes of the study area and visualized as boxplots. To test for normality in the transformed data, Shapiro-Wilk’s W test was applied and host-hoc Tukey HSD test was used to detect significant differences between the means of the different latitudes and longitudes. For descriptive statistics, univariate indices such as the Margalef’s species richness index (d) were calculated. It describes the total number of species at a sampling site, with S representing the total number of species in the sample (at a single station or transect) and N representing the number of individuals (Margalef, 1958).
M argalef0s species richness index (d) = S−1 ln(N)
The Shannon-Wiener diversity index (H’) was calculated in order not only to consider the amount of species but also the relative abundance of each species.
This index assumes that individuals are randomly sampled from an infinitely large community and that every species is represented in the sample (Shannon and Weaver, 2015).
Shannon−W iener diversity index (H0) =−X
pi·ln(pi)
with
pi= ni N
representing the amount of species (i) relatively to the total number of individ- uals (N).
The Pielou’s evenness index (J) was applied for the different stations. Using the Shannon-Wiener diversity index (H’), this index characterises the biodiversity of a sample by describing its evenness referring to the species number (S).
2. | Material and Methods
The Pielou’s evenness index takes up values between 0 and 1, less variation is demonstrated by high J’ values (Pielou, 1966).
P ielou0s evenness index (J) = H0 ln(S)
As a proxy for the biodiversity of a habitat, the probabilities that two sampled individuals belong to the same species were calculated with the Simpson’s index (Begon et al., n.d.; Magurran, 1988). 0 hereby represents infinite diversity whereas 1 indicates no diversity.
Simpson0s diversity index (λ) = X p2i Multivariate data analysis
Multivariate statistical analyses were applied to describe community structure, abundance and species composition of early life cephalopod associations in the Sargasso Sea. The study area was divided into northern and southern as well as eastern and western transects and compared by different methods of the Primer-E software (Version 6, Clarke and Warwick, 2001). Analysis of similarity, ANOSIM, (Clarke and Warwick, 2001) was performed to identify differences in the community structure of the different transects (northern vs. southern as well as western-eastern areas). Additionally, the similarity percentage routine, SIMPER (Clarke and Warwick, 2001) was conducted to identify dominant species, which were responsible for community differences. If a species identification was not possible, individuals were grouped to higher taxa (usually to the family level), specimens that could only be identified as Teuthoidea indet. were excluded from the analysis.
Agglomerative, hierarchical cluster analysis and non-metric multidimensional scaling (MDS) was used for the analysis concerning species compositions of day and night catches. MDS analysis detects the best assemblage of data points based on the dissimilarity values of the data set. Thus, similar data points are visualized by proximity, dissimilar points are grouped farther apart from each other, illustrating discrete clusters. Sample classification was based on the group-average linking method (Field et al., 1982; Kruskal, 1964) and the Bray-Curtis measurement was used as the measure for distance (Bray and Curtis, 1957; Field et al., 1982). Similarities in cephalopod community compositions between stations sampled during cruise MSM41 were investigated with a Principal Component Analysis (PCA). PCA is a method which reduces the complexity of a dataset in defining linear combinations of the orginal data, the so-called principal components (PCs), and transforming them to a new
2. | Material and Methods
coordinate system. The greatest amount of variance of the total data set is explained by the first PC. Every successive PC explains a smaller proportion of the total variance. The individual contributions of the variables to the PCs are called loadings, the new coordinates of the objects (samples) called scores.
In this study, PCA was used for the illustration of possible spatial patterns of cephalopod communities. The examination of eigenvalues led to the choice of showing only the first two PCs.
In order to examine the relationships between environmental factors and com- munity composition, redundancy analysis (RDA) was applied. RDA is a linear eigenvector ordination technique related to PCA, which constrains the axes to be linear combinations of explanatory variables. Since not all the potential factors influencing the species composition could be quantified and included in the canonical analysis RDA was performed as an add-on to the PCA. Only daytime and SST were used as environmental variables as other variables like fluorescence were not available or were highly correlated (depth, salinity) be- tween sample sites. RDA results were shown in triplots, an ordination diagram of samples, species, and environmental conditions. Alikeness of sites and species with respect to the environmental variables is expressed with grouping them closer together. The strengths of the relationships, or rather the informative value of the representation through the levels, are represented by the arrow lengths, and their assosciations by the acuteness of the angle. The significance of the relationship was investigated by Monte Carlo permutation tests, including the test of the null hypothesis of independence between the two data sets with the canonical eigenvalues.
PCA was conducted with the software R 3.0.2 (R Core Team 2013) for statistical computing and the related package vegan (Oksanen et al., 2013). Prior to the analysis, species abundances taxon specific densities (n/10000 m3) were fourth root transformed and a chord distance transformation was applied (Legendre and Gallagher, 2001) to avoid the so-called double-zero problem.
2.4. Barcoding
Barcoding studies were performed with specimens from the WH373 cruise at the Thünen Institute of Fisheries Ecology in Hamburg. In total, 42 specimens were analysed from both IKMT and pelagic midwater trawls (PMT).
DNA extraction, amplification and sequencing
Mantle tissue was carefully removed with a sterile scalpel from specimens,
2. | Material and Methods
which had been preserved in 70% ethanol. DNA was extracted from the tissues by using the Qiagen DNEasy Kit (Valencia, CA) developed for the purification of DNA from animal tissues (Spin Column Protocol), following the manufacturer’s protocol. DNA from the cytochrome c oxidase subunit I gene locus was amplified using primers LCO1490 (forward) and HCO2198 (reverse) after Folmer el al., 1994.
Primer Sequence
LCO1490 5’-ggtcaacaaatcataaagatattgg-3’
HC02198 5’-taaacttcagggtgaccaaaaaatca-3’
The concentration of DNA was checked with the Cary 50 UV-Visible spec- trophotometer (Varian Inc) and DNA concentrations of 100 ng/µl were aimed by the extractions. The ratio of absorbance at defined wavelengths can be used to estimate the purity of DNA. Samples with a ratio at 260 nm/280 nm of 1.8 were considered as “pure”. For the amplification of the gene fragments 1 µl template DNA, 7.5 µl Taq-PCR Master Mix (Qiagen), 6 µl sterile water and 0.5 µl of each 10 mM primer were mixed. The polymerase chain reaction was initiated by a simplified hot start at 94°C for 7 minutes followed by 35 cycles of 60 s at 94°C (denaturation), 60 s at 45°C (annealing) and 90 s at 68°C (extension), followed by a final extension phase of 7 minutes at 68 °C. The PCR products were kept at 4°C. The PCR products were checked for successful amplification by electrophorese through a 1.4% agarose gel. Sequencing PCRs were performed using the BigDye Terminator v.3.1 Cycle Sequencing Kit, fol- lowing the manufacturer’s instructions. A volume of 0.76 µl PCR product was mixed with 0.4 µl of either the forward or reverse primer (Folmer et al., 1994), 1 µl 3.1 Sequencing Buffer (5X), 1 µl Mastermix 3.1. and 6.84 µl sterile water, resulting in a total volume of 10 µl. The amplification products were purified, thus, excessive fluorescent dNTPs were removed, by adding 5 µl BigDye-X- Terminator Reaction Mix, 14.5 µl sterile Water and 22.5 µl SAM solution to 8 µl of each PCR product in a total volume of 50 µl (Applied Biosystems, Inc).
Sequences were read with the AB3500 Genetic Analyser (Applied Biosystems, Inc). Nucleotide sequence analysis Sequence reads from both DNA strands were verified by eye and aligned using CodonCode Aligner v5.1.1 (CodonCode Corporation). Alignments were trimmed to avoid problems with missing data in the following analyses. Nucleotide variability was scored using the software DNASP v5 (Rozas et al., 2003). The phylogenetic relationship among taxa was assessed with three different approaches. Based on genetic distances a neighbour-joining (NJ) tree was constructed using the Bioedit 7.2.5 software
3. | Results
(Hall, 1997-2001). In addition, one tree was inferred based on the maximum likelihood (ML) method as implemented in RaxML v.8.0.26 (Stamatakis, 2006) and another tree was constructed based on Bayesian Inference (BI) using Mr- Bayes 3.2.4 software (Huelsenbeck and Ronquist, 2001). For the last two trees the best-fitting models of nucleotide substitution were chosen by likelihood scores obtained by jModelTest 0.1.1 (Posada, 2008). The best model for ML calculation was F81+I+G, the most appropriate model for Bayesian analyses was HKY+I+G. The basic local alignment search tool (BLAST) was used to compare the obtained sequences to available nucleotide sequences in GenBank, based on the maximum sequence identity percentage.
3. Results
3.1. Walther Herwig cruise 373
3.1.1. Hydrography
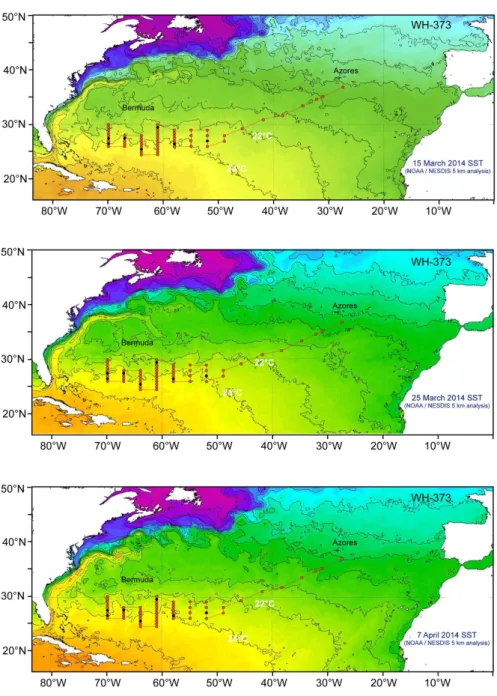
During the research cruise, transects were supposed to cross the two tempera- ture isotherms. This was achieved for almost all seven transects of the core study area even if the front was moving northwards. Further nine stations were sampled on the way to the Azores. Hydrographic sections were detected at the 22°C and the 24°C isotherms. OSTIA 1/20° global grid ( 6.5 km) L4 SST analysis (UK Met Office) was used to estimate daily sea surface temperatures.
A thermal front with a temperature gap between 22°C and 24°C could be observed for the western part of the core study area which was more diffuse in the eastern area (Fig. 15).
At every station of the seven transects, a hydrographic profile was generated from CTD data. In total, 107 CTD casts were made. A convergence zone, an increased SST change over a short distance, could be observed within the main study area between 26° and 28°N (Fig. 16). Salinity changes were observed in a west-eastern gradient. Changes concerning fluorescence, salinity and temperature were observed for the upper 300 m. With increasing depth, abiotic variables were comparable for the different transects.
3. | Results
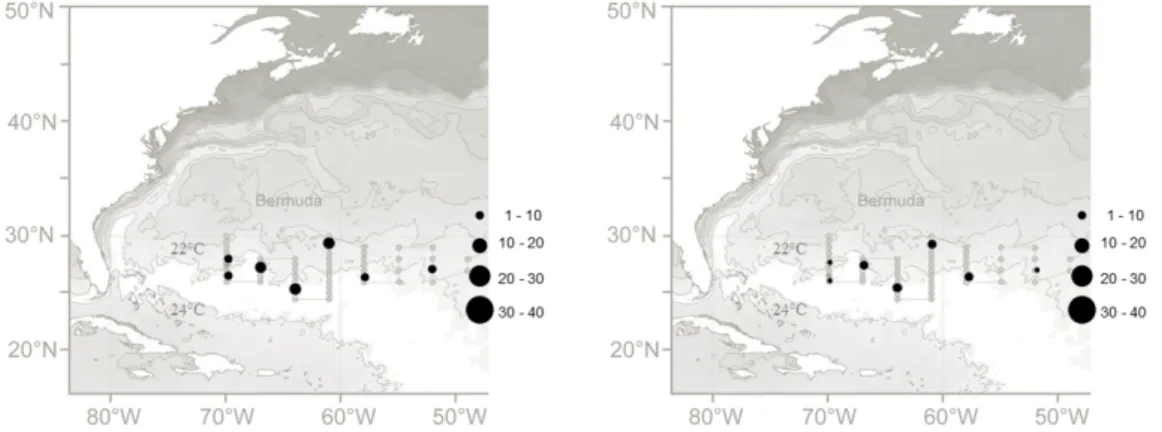
Fig. 15: Oversea surface temperature during WH 373 (generated from the National Oceanic and Atmospheric Administration (NOAA) from the beginning to the end of the survey (15th March 2014, 25th March 2014, 7th April 2014). Dark dots indicate PMT and orange dots IKMT stations. Maps provided by M. Miller, 2015.
3. | Results
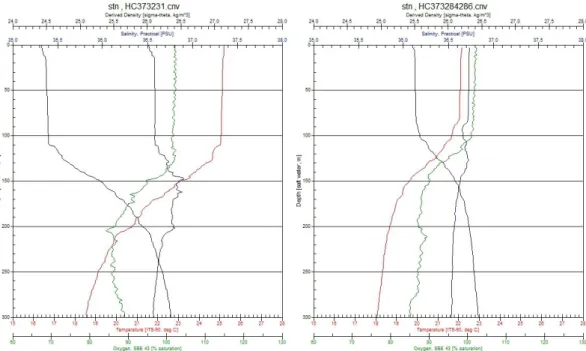
Fig. 16: Graphs interpolating sea surface temperature and salinity from 107 CTD casts of the core study area.
Fig. 17: Depths profiles of temperature, salinity, density and fluorescence for two stations north and south to the STCZ are shown.
3.1.2. Abundance of cephalopods and trawl comparison
During the WH373 cruise, 2,063 cephalopods belonging to 21 families were quantitatively sorted from the catches of all seven pelagic trawls and from 57
3. | Results
out of 65 catches of the IKMT trawls. Most specimens were caught with the IKMT.
Tab. 1: Cephalopods collected by different gear.
Gear Absolute number of
specimens Sampling Depth Number of Trawls
IKMT-0.5 1,349 0 - 300 m 57
PMT 714 0-1,000 m 7
3.1.3. Taxonomic composition of catches Pelagic Midwater Trawl
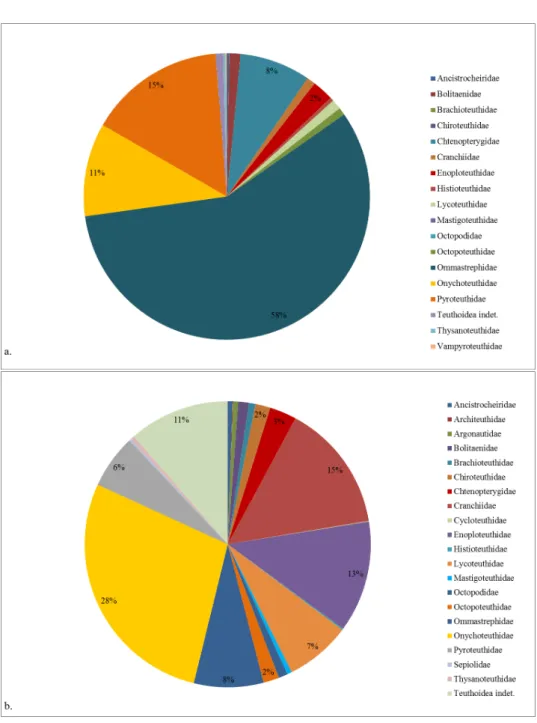
In total, 714 specimens of 21 species (14 families) were caught with the pelagic midwater trawl (Fig. 18, of which 57%, belonged to the family of the flying squids, Ommastrephidae; 15% of the fire squids, pyroteuthids; 11% belonged to the hooked-squids, Onychoteuthidae; and 8% of the total catch was represented by the combed squid Chtenopteryx sicula. 9% of the individuals belonged to the remaining ten families. One deep-sea vampyroteuthid, Vampyroteuthis infernalis, was caught during the 1,000 m trawl (Fig.18.
Isaacs-Kidd-Midwater-Trawl
1,349 individuals belonging to at least 36 species (20 families) were sampled using the IKMT (Fig. 18). Mostly teuthoid cephalopods were caught (97%), 3% of the catch was composed of octopods and three sepiid specimens, which could be identified as Heteroteuthis dispar. The hugest amount of the collected specimens belonged to the Onychoteuthidae (28%), 15% of the samples were glass squids, Cranchiidae, and 13% of the trawls were composed of enope squids, Enoploteuthidae (Fig.18 .
3. | Results
Fig. 18: General composition of cephalopod families of the total catch during WH373 using the PMT (above) and IKMT (below) nets.
3. | Results
Tab. 2: Abundance of collected cephalopods by PMT and IKMT hauls during WH373.
IKMT-0.5 PMT
Taxon n % size
range (mm) n % size
range (mm) Sepiida
Sepiolidae
Heteroteuthis dispar 3 0.22 2-8 Teuthoidea Oegopsida
Ancistrocheiridae
Ancistrocheirussp. 7 0.52 1-15 2 0.28 100-103
Architeuthidae
Architeuthis dux 1 0.07 2
Brachioteuthidae
Brachioteuthissp. 10 0.74 2-13 Chiroteuthidae
Chiroteuthis veranyii 13 0.96 5-50 Planctoteuthissp. 10 0.74 3.5-11 Chtenopterygidae
Chtenopteryx sicula 41 3.04 1-10 57 7.98 14-50
Cranchiidae
Bathothauma lyromma 8 0.59 4-15 Cranchiidae indet. 34 2.52 2.5-5 Helicocranchiasp. 56 4.15 4-21
Leachiasp. 64 4.74 4-31
Liguriellasp. 16 1.19 2-9
Liocranchiasp. 7 0.52 10
Megalocranchia oceanica 6 0.44 2-28 7 0.98 24-110
Teuthoweniasp. 5 0.37 6-23
Cycloteuthidae
Discoteuthissp. 1 0.07 15
Enoploteuthidae
Abralia veranyi 1 0.14 20
Abraliasp. 1 0.07 10
Abraliopsis morisii 1 0.14 12
Abraliopsissp. 67 4.97 1.5-16
Enoploteuthidae indet. 101 7.49 1-6
Enoploteuthis anapsis 1 0.07 20 15 2.10 18-69
Histioteuthidae
Histioteuthis corona corona 1 0.07 17 1 0.14 22
Histioteuthissp. 1 0.07 2.5 2 0.28
Lycoteuthidae
Selenoteuthis scintillans 96 7.12 1.5-13 8 1.12 9-34 Mastigoteuthidae
Mastigoteuthissp. 7 0.52 6.5-11 Octopoteuthidae
Octopoteuthidae indet. 23 1.7 1.5-4
Octopoteuthis sicula 1 0.07 9 5 0.7 35-180
Taningia danae 1 0.07 9 1 0.14 80
Ommastrephidae
Hyaloteuthis pelagica 4 0.3 1.5-3.5 302 42.3 11-70
Illexsp. 4 0.3 1-3
Ommastrephes batramii 108 15.13 11-84
Ommastrephidae indet. 102 7.56 1-9 Onychoteuthidae
Onychoteuthis banksii 337 24.98 3-14 64 8.96 9-51
Onykia carriboea 41 3.04 1.5-13 11 1.54 14-30
Pyroteuthidae
Pyroteuthidae indet. 3 0.22 4-13
Pyroteuthis margaritifera 79 5.86 1.5-33 110 15.41 9-39 Thysanoteuthidae
Thysanoteuthis rhombus 6 0.44 3-5
Teuthoidea indet. 154 11.42 1-6 6 0.84 24-36
Octopoda Argonautidae
Argonauta argo 8 0.59 2-4 2 0.3 20
Bolitaenidae
Bolitaenidae indet. 1 0.07 8
Bolitaena pygmaea 1 0.07 4 1 0.14 17
Japetella diaphana 14 1.04 3-23 8 1.12 18-30
Tremoctopodidae
Tremoctopussp. 1 0.14 24
Octopodidae indet. 8 0.59 2-4
Octopussp. 6 0.44 2-8
Vampyroteuthidae
Vampyroteuthis infernalis 1 0.14 40
Sum 1,349 714
3. | Results
3.1.4. Species distributions and sizes
Cephalopods of the PMT trawls were sorted out quantitatively from the sam- ples. The five catches to a depth of 300 m were very similar in their faunal composition which is supported by their strong grouping in the MDS plot.
Differences in family composition/species assemblage appeared for stations 233 (700 m) and 316 (1,000 m), where Cranchiidae and Enoploteuthidae were more
abundant.
Sepiida Sepiolidae
Heteroteuthis dispar
Three sepiids were caught at station 328 and 329 and could be identified as Heteroteuthis dispar, which belong to the Sepiolidae. They were caught with the IKMT and measured 2,3 and 8 mm in DML.
Teuthoidea Oegopsida Ancistrocheiridae
Ancistrocheirus lesueurii
Two juvenile individuals (DML 100; 103 mm) were caught by the PMT (sta- tions 259; 284) and seven early life stages (DML 1- 15 mm) with the IKMT at transects 4, 5, 6 and at station 323 (27.5°N, 49°W; Table 2).
Architeuthidae Architeuthis dux
One specimen differed significantly from all other specimens that could be allocated to families. It was sampled at station 306 (27°N, 54°W). This animal (DML 2 mm) showed extremely long arms with more than twice the length of the mantle, a pre-stretched head and tentacles which were completely armed with suckers. Provisional identification led to the paralarval stage of the giant squid, Architeuthis dux.
Brachioteuthidae Brachioteuthis sp.
Identification of the Brachioteuthidae was difficult as they resemble early life stages of Mastigoteuthidae and Chiroteuthidae. Ten individuals (2 – 13 mm DML caught by the IKMT were classified as Brachioteuthis sp. (Table 2) and appeared at one of the most eastern IKMT stations (station 327; 33.3°N,
3. | Results
34.4°W). Early life stages of this poorly described genus exhibit an extendable neck, numerous proximal tentacular suckers and an elongated, slightly pointed mantle.
Chiroteuthidae Chiroteuthis veranyi
The planktonic life stages of the chiroteuthids were formerly known as “Do- ratopsis” larvae and are characterized by an extremely long neck, a short arm crown and long clubs with numerous suckers. Thirteen paralarvae were caught by the IKMT (DML 5 – 50 mm) They were mostly in poor condition but fin shape, head and tentacle morphology were always distinct characteristics for species identification.
Planctoteuthis sp.
Specimens of this genus were not always clear concerning identification but could be distinguished by their fin structure and head shape. 10 individuals were sampled in total from the IKMT hauls (DML 3.5 - 11 mm).
Chtenopterygidae Chtenopteryx sicula
This species was abundant in the PMT catches where 57 individuals were caught (DML 14 – 50 mm). Additionally, 41 individuals were collected from IKMT hauls (DML 1 - 10 mm, Fig. 19).
3. | Results
0 1 2 3 4
20 30 40
DML [mm]
Frequency
0 3 6 9
0 3 6 9
DML [mm]
Frequency
Fig. 19: Chtenopteryx sicula. Geographical distribution according PMT catches. Dot size represents range of absolute number of individuals collected. Size histograms according samples witch PMT (left), n= 57, and IKMT (right), n=41.
Cranchiidae
In the PMT trawls, onlyMegalocranchia oceanica specimens (n=7) occurred which were easy to identify due to the complex photophores on the digestive gland. From IKMT samples, at least 7 different species were identified (see Table 2). Thirty-four very small or damaged individuals with no distinct char- acteristics could only be identified as Cranchiidae indet., (DML 2.5 - 5 mm).
The Cranchiidae were distributed throughout the whole study area and the following genera could be differentiated: Bathothauma lyromma,Helicocranchia sp.,Leachia sp., Liguriella sp.,Liocranchia sp.,Megalocranchia oceanica and Teuthowenia sp. (Table 2). Most of the Cranchiidae belonged to the genera
Leachia (n=64) andHelicocranchia (n=56).
Cycloteuthidae Discoteuthis sp.
One possibleDiscoteuthis individual was collected at IKMT station 279 (28°N, 61°W). It exhibited large fins, 4 rows of tentacular club suckers with more than 12 suckers in total which is a distinctive feature in contrast to young life stages of Octopoteuthis . Species identification was endorsed by genetic barcoding (see chapter 3.1.6).
Enoploteuthidae
This family is characterised by their typical photophores on head, eyes?, man- tle,arms and tentacles. In total, 170 specimens were sampled from the IKMT trawls with 101 individuals that could only be identified as Enoploteuthidae indet. due to their poor condition or their small size which did not allow a more precise identifications. Striking for the PMT stations was that the major share of Enoploteuthidae (n=14) was caught at station 316 (27°N, 51.5°W) which represented the only station that trawled down to a depth of 1,000 m (see also Table 2).
3. | Results
Abralia sp.
Two specimens of the genera Abralia were sorted from the samples, one adult individual (DML= 20) could be clearly identified as Abralia veranyi as its fins reached the posterior end of the mantle and it exhibited three club hooks alternating with two series of suckers.
Abraliopsis sp.
The genus Abraliopsis is characterised by three enlarged photophores on the distal tips of the fourth arms. Sixty-seven individuals of this genus, ranging between 1.5 and 16 mm DML were collected from the IKMT hauls; one larger specimen (DML 12 mm) that was identified as Abraliopsis morisii was caught with the PMT (27°N, 51.5°W).
Enoploteuthis sp.
This genus is recognisable by a tail that extends beyond the fins, two rows of tentacular hooks and usually nine photophores around the eyes. From the PMT trawls, 15 individuals could be identified asEnoploteuthis anapsis (DML 18 – 69). The biggest individual was an adult that measured 69 mm and was identified by its tentacular clubs and the continuous lines of photophores on the mantle. In total, 117 specimens contributed to the genus Enoploteuthis, the major share within the Enoploteuthidae (Table 2).
Histioteuthidae
These squids are also known as cock-eyed squid because of their enlarged left eye: futher they bear numerous photophores on head, mantle and arms which form characteristic patterns. All three Histioteuthidae collected by the PMT were juveniles. Two of them were in a bad condition that did not allow further species identification. One larger individual of 22 mm mantle length was identified as H. corona corona, an endemic species of the Atlantic Ocean that exhibits 17 photophores around the eyelids.
Lycoteuthidae
Selenoteuthis scintillans
From the IKMT trawls, 96 specimens ofSelenoteuthis scintillans were collected, with a DML ranging from 1.5 to 13 mm. Individuals could be identified by their posterior as well as the intestinal and/or ocular photophores. Eight juvenile specimens derived from the pelagic trawl and measured between 9 and 34 mm in DML. Those specimens were all collected at PMT station 316 which trawled down to 1,000 m.
3. | Results Mastigoteuthidae
Individuals were characterised by an elongated mantle, more than four rows of club suckers, heart-shaped fins and a posterior protruding spike-like tail. Few specimens of the genus Mastigoteuthis (n=7) were collected from the IKMT trawls with DML between 6.5 and 11 mm.
Octopoteuthidae
Octopoteuthidae are easily confused with Ancistrocheiridae at their early life stages as both families exhibit enlarged club suckers, proportionally big eyes and broad fins. Adult specimens exhibit eight arms as they lose their tenta- cles at the subadult stage which stands for the genus name, Octopoteuthis. Identification of early life stages of octopoteuthids was not always clear and genetic barcoding was used to proof correct species identification (see chapter 3.1.6). All Octopoteuthidae were caught until a maximum depth of 300 m and showed no pattern concerning the PMT stations. For 23 individuals, collected from IKMT trawls, identification to species level was not reliable. They were classified as Octopoteuthidae indet. (Table 2).
Octopoteuthis sicula
From the pelagic trawls, five Octopoteuthis sicula specimens were caught of which two were mature females (DML 140; 180 mm) and one an adult male (DML 115 mm). Arm tip photophores, the absence of tentacles, two light organs on the ventral side of mantle and the ink sac as well as the presence of hooks instead of suckers were clear characters for species identification. One Taningia danae (80 mm) was identified from the pelagic trawl due to the presence of large photophores on the tip of the second arms and the lack of photophores on the tip of the other arms. Another specimen of 9 mm DML was caught with the IKMT. It exhibited a photophore on the ink sac and an unseparated fin musculature.
Ommastrephidae
Early life stages of Ommastrephidae are characterised by fused tentacles (a pro- boscis) that start to separate around 3 mm of mantle length (“rhynchoteuthion larvae”). This family represented the most abundant taxon of the pelagic trawls (n= 410) and was very common in IKMT catches (n = 110). A relatively large number of early life Ommatrephidae collected with the IKMT (n=102) was not identified, because of their small size that did not show species specific characters (see Table 2).
Hyaloteuthis pelagica
3. | Results
The majority of the Ommastrephidae caught by the PMT were identified as Hyaloteuthis pelagica. Specimens exhibited the conspicuous photophore pattern on the ventral side of the mantle (Fig. 20, 21).
Fig. 20:Hyaloteuthis pelagica. Geographical distribution according PMT catches with dot size representing range of absolute number of individuals collected
0 5 10 15 20 25
20 40 60
DML [mm]
Frequency
Fig. 21: Hyaloteuthis pelagica. Specimens sampled with the PMT at station 228 (27°N’ 69.5°W) exhibiting the species characteristic photophore pattern on the ventral mantle side (left), histogram of the dorsal mantle lengths from all PMT samples (n
= 302 specimens) (right).
Illex sp.
Four early life stages from IKMT stations were identified as Illex sp. with unenlarged lateral suckers and a relatively short proboscis. Identification should be proofed with barcoding.
3. | Results
Ommastrephes bartramii
For the juvenile specimens, identification of O. bartramii was distinct due to the absence of photophores and the presence of an opal strip along the ventral side of the mantle. Size range of specimens caught with the PMT was between 11 and 84 mm DML (Fig. 23).
Fig. 22:Ommastrephes bartramii. Geographical distribution according PMT catches with dot size representing range of absolute number of individuals collected.
Fig. 23: Ommastrephidae. Histogram of the dorsal mantle lengths of specimens sampled with PMT (left): Hyaloteuthis pelagica n= 302, O.batramii, n= 108 and IKMT (right): Ommastrephidae total, n=102.
Onychoteuthidae
The hooked-squids represented the most abundant cephalopod group of the
3. | Results
IKMT hauls. Also, referring to the whole samples, they were always in the best condition. Because this family is under revision, species identification still followed the nomenclature of Jereb and Roper (2010). Accordingly, two species were found in the samples, Onychoteuthis banksii and Onykia carri- boea, which were morphologically clearly distinguishable. O. carriboea has an unclarified taxonomic status which moreover represents a species complex.
Concerning the IKMT samples, 337 individuals between 3 and 44 mm DML were identified as O. banksii as they possessed ocular and intestinal photophores.
41 specimens with a broader mantle, dark dorsal chromatophores could be classified as O. carriboea (DML 1.5 – 13 mm). Sixty-four O. banksii and 11 O. carriboea specimens were caught by the PMT; one of theO. carriboea was an adult female (DML 30 mm) (Table 2, Fig. 24, 25). For underlying the morphological identification, genetic barcoding experiments were performed.
Fig. 24: Onychoteuthis banksii (left) and Onykia carriboea (right). Geographical distribution according PMT catches with dot size representing range of absolute number of individuals collected.
3. | Results
Fig. 25: Onychoteuthidae. Histogram of the dorsal mantle lengths of Onychoteuthis banksii andOnykia carriboea sampled with PMT (left), n= 337, 41, and IKMT (right), n=64, 11.
Pyroteuthidae
Individuals of the fire-squids are easy to recognize by their conspicuous pho- tophore pattern around the eyes and on the viscera. The tentacular stalks are usually bent in young life stages and allow identification even of very small individuals. The main characteristics for species identification is the relation between the size of anal and gill photophores (smaller in Pterygioteuthis, larger inPterygioteuthis) and the occurrence of pink patches at the tentacular base in Pyroteuthis. The Pyroteuthidae were very abundant in the PMT trawls where they made up 15.41 % of the total catch (Table 2). 110 individuals were identified as Pyroteuthis margaritifera due to their conspicuous pink patches.
The sex of seven individuals could be identified for four adult males (maturity stage: 2-3) and three adult females (maturity stage: 4). The Pyroteuthidae also occurred in relatively high densities in the IKMT samples with 79 P.
margaritiferaand 3, possibly Pterygioteuthis giardi individuals which exhibited no tentacular hooks and a different fin shape.