Edited by:
Sophie von der Heyden, Stellenbosch University, South Africa
Reviewed by:
Xiubao Li, Hainan University, China Luisa Fernanda Dueñas, Universidad Nacional de Colombia, Colombia Brian Bowen, University of Hawai‘i, United States
*Correspondence:
Rui Rosa rrosa@fc.ul.pt
Specialty section:
This article was submitted to Marine Evolutionary Biology, Biogeography and Species Diversity, a section of the journal Frontiers in Marine Science
Received:06 May 2019 Accepted:11 July 2019 Published:02 August 2019
Citation:
Rosa R, Pissarra V, Borges FO, Xavier J, Gleadall IG, Golikov A, Bello G, Morais L, Lishchenko F, Roura Á, Judkins H, Ibáñez CM, Piatkowski U, Vecchione M and Villanueva R (2019) Global Patterns of Species Richness in Coastal Cephalopods. Front. Mar. Sci. 6:469.
doi: 10.3389/fmars.2019.00469
Global Patterns of Species Richness in Coastal Cephalopods
Rui Rosa1* , Vasco Pissarra1, Francisco O. Borges1, José Xavier2,3, Ian G. Gleadall4, Alexey Golikov5, Giambattista Bello6, Liliane Morais7, Fedor Lishchenko8, Álvaro Roura9, Heather Judkins10, Christian M. Ibáñez11, Uwe Piatkowski12, Michael Vecchione13and Roger Villanueva14
1MARE – Marine and Environmental Sciences Centre, Laboratório Marítimo da Guia, Faculdade de Ciências da Universidade de Lisboa, Lisbon, Portugal,2MARE – Marine and Environmental Sciences Centre, Department of Life Sciences, University of Coimbra, Coimbra, Portugal,3British Antarctic Survey, Natural Environment Research Council, Cambridge, United Kingdom,4Graduate School of Agricultural Science, Tohoku University Aobayama Campus, Sendai, Japan,5Department of Zoology, Kazan Federal University, Kazan, Russia,6Arion, Mola di Bari, Italy,7Institute of Environmental Health, Faculty of Medicine, University of Lisbon, Lisbon, Portugal,8A.N. Severtsov Institute of Ecology and Evolution, Laboratory for Ecology and Morphology of Marine Invertebrates, Moscow, Russia,9Instituto
de Investigaciones Marinas, Consejo Superior de Investigaciones Científicas, Vigo, Spain,10Department of Biological Sciences, University of South Florida, St. Petersburg, St. Petersburg, FL, United States,11Departamento de Ecología y Biodiversidad, Facultad de Ciencias de la Vida, Universidad Andres Bello, Santiago, Chile,12GEOMAR, Helmholtz Centre for Ocean Research Kiel, Kiel, Germany,13National Marine Fisheries Service, National Systematics Laboratory, National Museum of Natural History, Smithsonian Institution, Washington, DC, United States,14Institut de Ciencies del Mar, Consejo Superior de Investigaciones Científicas, Barcelona, Spain
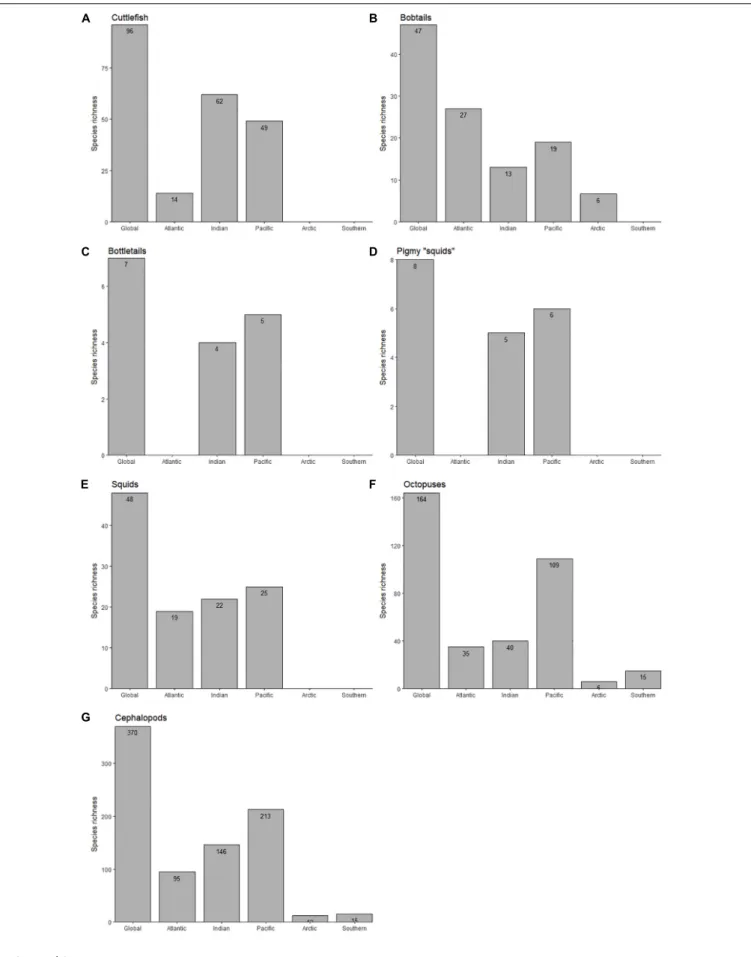
Within the context of global climate change and overfishing of fish stocks, there is some evidence that cephalopod populations are benefiting from this changing setting. These invertebrates show enhanced phenotypic flexibility and are found from polar regions to the tropics. Yet, the global patterns of species richness in coastal cephalopods are not known. Here, among the 370 identified-species, 164 are octopuses, 96 are cuttlefishes, 54 are bobtails and bottletails, 48 are inshore squids and 8 are pygmy squids. The most diverse ocean is the Pacific (with 213 cephalopod species), followed by the Indian (146 species) and Atlantic (95 species). The least diverse are the Southern (15 species) and the Arctic (12 species) Oceans. Endemism is higher in the Southern Ocean (87%) and lower in the Arctic (25%), which reflects the younger age and the “Atlantification”
of the latter. The former is associated with an old lineage of octopuses that diverged around 33 Mya. Within the 232 ecoregions considered, the highest values of octopus and cuttlefish richness are observed in the Central Kuroshio Current ecoregion (with a total of 64 species), followed by the East China Sea (59 species). This pattern suggests dispersal in the Central Indo-Pacific (CIP) associated with the highly productive Oyashio/Kuroshio current system. In contrast, inshore squid hotspots are found within the CIP, namely in the Sunda Shelf Province, which may be linked to the occurrence of an ancient intermittent biogeographic barrier: a land bridge formed during the Pleistocene which severely restricted water flow between the Pacific and Indian Oceans, thereby facilitating squid fauna differentiation. Another marked pattern is a longitudinal richness cline from the Central (CIP) toward the Eastern Indo-Pacific (EIP) realm, with central Pacific archipelagos as evolutionary dead ends. In the Atlantic Ocean, closure of the Atrato Seaway (at the Isthmus of Panama) and Straits of Gibraltar (Mediterranean Sea)
fmars-06-00469 August 1, 2019 Time: 18:37 # 2
Rosa et al. Global Biogeography of Coastal Cephalopods
are historical processes that may explain the contemporary Caribbean octopus richness and Mediterranean sepiolid endemism, respectively. Last, we discuss how the life cycles and strategies of cephalopods may allow them to adapt quickly to future climate change and extend the borealization of their distribution.
Keywords: biogeography, mollusk, cephalopod, cuttlefish, squid, octopus, species richness
INTRODUCTION
Given the importance that biodiversity plays in sustaining ecosystems (Cardinale et al., 2012; Hooper et al., 2012), identification of the main threats to biodiversity is important (Hobday and Pecl, 2014;Marchese, 2015;Ramirez et al., 2017).
Habitat degradation, overfishing, pollution, biological invasions and, in particular, climate change are the major causes of biodiversity loss, which has probably already reached a critical transition point (Barnosky et al., 2012). A global redistribution of marine species, including cephalopods, due to both man- driven biological invasions (e.g., direct transport of living beings, opening and widening of the Suez Canal) and, most importantly, climate change, is occurring (Sunday et al., 2012), with marine organisms now expanding their limits of distribution by a mean of 72.0±13.5 km per decade (Poloczanska et al., 2013).
Among the marine biota, and within the notion of winners and losers in the context of global change, there is some evidence that cephalopods (octopuses, squids, and cuttlefishes) are benefiting from the changing ocean environment, due to the combination of global warming and overfishing of their predators and competitors (Vecchione et al., 2009; Rodhouse, 2013;Doubleday et al., 2016). Part of this success may be also related to their great phenotypic flexibility and, consequently, environmental plasticity, which may be linked to their extensive recoding activity, since in cephalopods genetic changes “on the fly” by RNA editing at the translation level may be more important in the short term than hardwired changes in DNA (Alon et al., 2015;Liscovitch-Brauer et al., 2017).
Cephalopods are ecologically and commercially important invertebrates that are semelparous with a generally short life cycle. The latter may be categorized as: (i) holobenthic, when the entire life cycle is associated with the benthos, as in most cuttlefishes; (ii) holopelagic, when the entire cycle is associated with the pelagic environment, in all oceanic squids; or (iii) merobenthic (or meroplanktonic), when the hatchlings are planktonic but become benthic after settlement at the juvenile stage, in some octopuses (Villanueva et al., 2016). The short life span is also associated with high food intake and growth rates sustained by voracious strategies and opportunistic diets (Boyle and Boletzky, 1996;Boyle and Rodhouse, 2005). Not surprisingly, and probably as a result of their molecular and ecological features, cephalopods are found in all marine habitats (excluding the hadal zone and the Black Sea) from the polar regions to the tropics (Boyle and Rodhouse, 2005). Although cephalopod diversity and distribution have been studied extensively in the past, most such research and knowledge has been compiled as species accounts (see examples inJereb and Roper, 2005, 2010;Jereb et al., 2014).
Large-scale biogeographic studies on cephalopod diversity are
scarce and mostly concentrated in the Atlantic Ocean (Rosa et al., 2008a,b; Judkins et al., 2010), polar zones (e.g., Xavier et al., 1999; Allcock et al., 2011; Golikov et al., 2013; Xavier et al., 2016b, 2018) and the Pacific Ocean (Ibáñez et al., 2009, 2019) or specific taxonomic groups (e.g., Ibáñez et al., 2016; Ulloa et al., 2017). Moreover, some of those studies were designed to investigate broad-scale latitudinal gradients (e.g., richness and body-size data across latitudinal bins) and describe the respective environmental determinants (e.g., Rosa et al., 2008a, 2012;Ibáñez et al., 2019). To the best of our knowledge, there is no global quantitative information on diversity hotspots for this charismatic group of invertebrates on the continental shelf regions of the world.
It is worth noting that the concept of hotspots has been used as a key strategy for global conservation plans, but they remain largely unexplored for marine habitats (Worm et al., 2003; Renema et al., 2008; Tittensor et al., 2010) due to data deficiency (Mittermeier et al., 2011). Biodiversity hotspots have been defined usually using species-based metrics (e.g., species richness; endemic species richness; number of rare/threatened species) or, alternatively, focusing on phylogenetic and functional diversity metrics (Myers, 1988, 2003; Reid, 1998; Gray, 2000;
Hoekstra et al., 2005). More recently, marine hotspots have been identified based on richness with metrics that incorporate both species abundances and functional traits (Stuart-Smith et al., 2013) or, alternatively, based on regions that are warming more rapidly (Hobday and Pecl, 2014).
Here, the global biogeography (patterns of species richness and number of endemic species) of coastal cephalopods, which thrive on the world’s continental shelf regions, is described for the first time. The study was restricted to the neritic realm (i.e., coastal species) because there is a lack of knowledge about the distribution/biogeography of deep-sea/demersal cephalopod fauna in many parts of the global ocean. A presence/absence database was compiled and organized in five major coastal groups (defined in cf. Hanlon et al., 2018, p. 72), namely:
(i) cuttlefishes (species belonging to the Family Sepiidae), (ii) bobtails and bottletails (Families Sepiolidae and Sepiadariidae, respectively), (iii) pygmy “squids” (Family Idiosepiidae), (iv) inshore squids (Family Loliginidae), and (v) benthic incirrate octopuses (Families Octopodidae, Eledonidae, Enteroctopodidae, Megaleledonidae, and Bathypolypodidae). The occurrence of these groups was determined for Marine Ecoregions of the World (MEOW; Spalding et al., 2007). The ecoregions are defined as “Areas of relatively homogeneous species composition, clearly distinct from adjacent systems (. . .). The dominant biogeographic forcing agents defining the ecoregions vary from location to location but may include isolation, upwelling, nutrient inputs, freshwater influx, temperature regimes, ice regimes, exposure,
Frontiers in Marine Science | www.frontiersin.org 2 August 2019 | Volume 6 | Article 469
sediments, currents, and bathymetric or coastal complexity”
(Spalding et al., 2007). The following questions are addressed.
(1) Which oceans and other large-scale marine regions (i.e., realms – see Spalding et al., 2007) are the most diverse in terms of coastal cephalopod fauna? (2) Which coastal ecoregions constitute the main hotspots (and coldspots)? (3) What are the potential origin and diversification patterns (based on the number of shared species)? and (4) Which ocean realms present the greater levels of endemism? We discuss the impact of historical processes and major marine biogeographical barriers on the detected patterns.
MATERIALS AND METHODS Database
The geographical ranges of coastal cephalopod species were investigated, on a global scale, by means of an exhaustive survey of primary literature (e.g., Rosa et al., 2008a; Judkins et al., 2010; Xavier et al., 2018), with a special focus on the most recent FAO guides on the cephalopods of the world (Jereb and Roper, 2005, 2010; Jereb et al., 2014). The presence/absence database was built around 12 realms [Arctic (ARC); Temperate Northern Atlantic (TNA); Tropical Atlantic (TAT); Temperate Southern Africa (TSAF); Western Indo-Pacific (WIP); Temperate Australasia (TAUS); Indo-Pacific (CIP); Temperate Northern Pacific (TNP); Eastern Indo-Pacific (EIP); Tropical Eastern Pacific (TEP); Temperate South America (TSA); Southern Ocean (SO)] (Supplementary Tables S1–S3), and 232 ecoregions, both defined bySpalding et al. (2007). It includes a total of 370 species associated with, but not necessarily restricted to, continental shelves (bottom depths < 200 m) at late ontogenetic stages (because several species display ontogenetic horizontal/slope- shelf migrations). Oegopsid squids and pelagic octopuses are known to thrive in, or to periodically invade the neritic province but were not included in the present database for the sake of clarity. Similarly, deeper dwelling species are not considered because this would then include species such as near-benthic cirrate octopuses, which show much broader, oceanic distribution patterns. New (e.g., Lepidoctopus joaquini; Sales et al., 2019) and rare species (only known from their type locality – no significant information about their geographical distribution) were excluded. Based on such criteria, the chambered nautiluses were also excluded – the only species with a well-defined geographical range outside its type locality isNautilus pompilius.
Similarly, for the myopsid squid Australiteuthis aldrichi (the only member of the Family Australiteuthidae). It is also worth noting that some nominal species listed in the database are known to comprise species complexes. In contrast to theOctopus vulgaris complex (a focus of much recent research, e.g., Leite et al., 2008; Amor et al., 2014, 2015, 2017; Gleadall, 2016;
González-Gómez et al., 2018), the complexes ofSepia pharaonis (Anderson et al., 2011), Sepioteuthis lessoniana (Cheng et al., 2014) and Lolliguncula brevis(Sales et al., 2014) are not well- defined in geographical terms and therefore are listed as single species. Therefore, the species richness patterns presented here are conservative estimates.
Data Analyses
We used the software ArcGIS version 10.6.1 and the open- source shape files from Spalding et al. (2007) for the identification of the hotspots (ecoregions) of cephalopod richness. Additionally, ecoregions were clustered in 12 different realms, according to the criteria defined by Spalding et al.
(2007). The relationships among realms were evaluated for the different cephalopod groups based on the number of shared species (see similar approach in Floeter et al., 2008). For each group we calculated a similarity matrix (using the Bray–
Curtis index) to obtain a distribution dendrogram by means of hierarchical cluster analysis using the UPGMA algorithm (PAST;
Hammer et al., 2001). We then resampled the original binary matrix performing 1000 stochastic reassignments to generate a bootstrap procedure to obtain the percentage of replicates (1000 iterations) supporting each node of the dendrogram (only values >50% are shown). Endemic species were defined as those species restricted to a single realm in the database.
Bottletails and pygmy squids were excluded from the endemism analysis due to their low ecoregional richness values (up to a maximum of 2 species per ecoregion) and a restricted- realm distribution.
RESULTS
Global Coastal Cephalopod Richness per Ocean
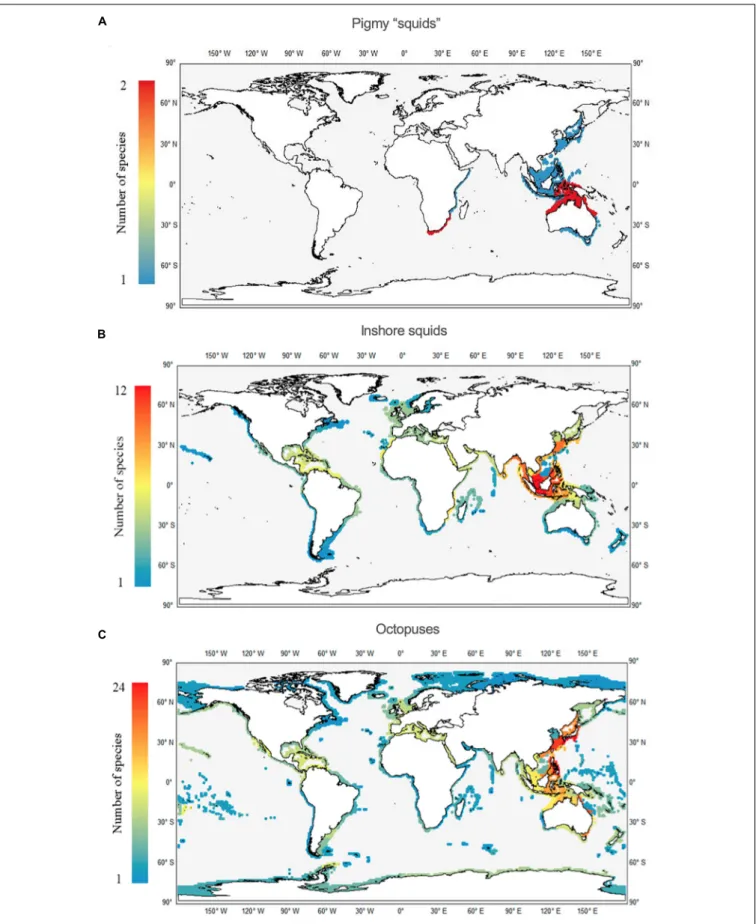
The present species richness database reveals that the most diverse ocean is the Pacific Ocean (with 213 cephalopod species), followed by the Indian (146 species) and Atlantic (95 species) Oceans. The least diverse are the Arctic (12 species) and Southern (15 species) Oceans. This trend is mostly observed in octopuses (Families Octopodidae, Eledonidae, Enteroctopodidae, Megaleledonidae, and Bathypolypodidae), inshore squids (Family Loliginidae) and pygmy “squids”
(Idiosepiidae), since cuttlefish (Family Sepiidae) richness is higher in the Indian (62 species) followed by the Pacific Ocean (49 species; Figure 1). In contrast, the richness of bobtails and bottletails (Families Sepiolidae and Sepiadariidae, respectively) is highest in the Atlantic (27 species). Among the 370 studied-species world-wide, 164 are octopuses, 96 are cuttlefishes, 54 are bobtails and bottletails, 48 are inshore squids and 8 are pygmy squids. It is important to note the absence of: (i) cuttlefishes, bobtails, bottletails, pygmy
“squids” and inshore squids in the Southern Ocean; (ii) cuttlefishes, bottletails, pygmy “squids” and inshore squids in the Arctic; and (iii) cuttlefishes and bottletails around the Americas (Figures 1,2).
Hotspots and Coldspots of Cephalopod Richness per Realm
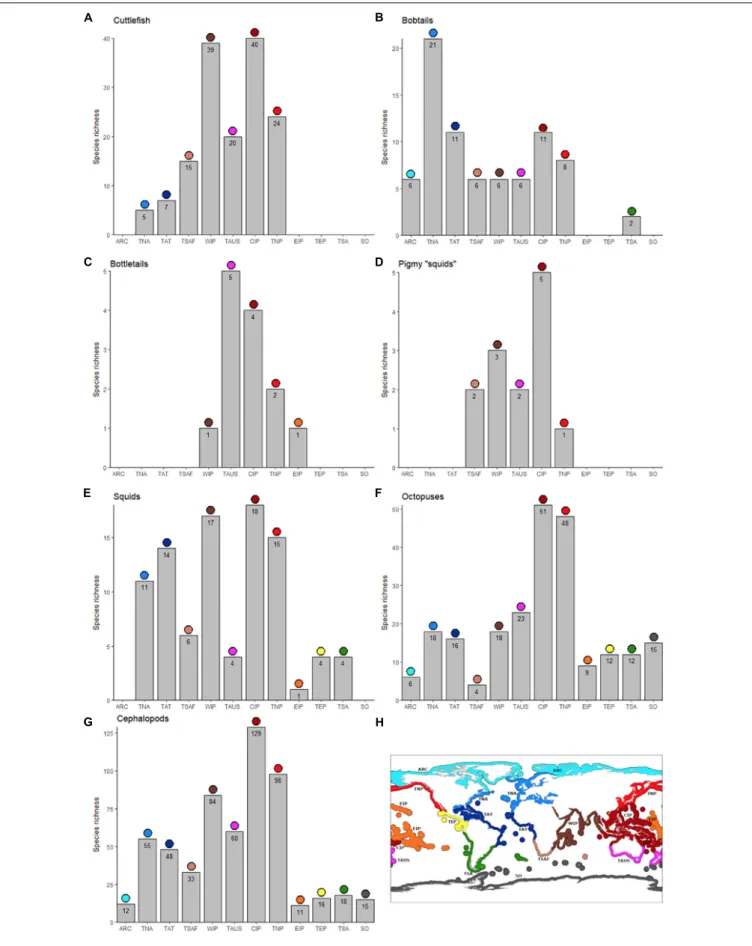
The most diverse cephalopod realm is the Central Indo-Pacific (CIP, n = 129 species), followed by the Temperate Northern Pacific (TNP,n= 98) and Western Indo-Pacific (WIP,n= 84).
The least diverse realms were the Southern (SO, n = 15) and
fmars-06-00469 August 1, 2019 Time: 18:37 # 4
Rosa et al. Global Biogeography of Coastal Cephalopods
FIGURE 1 |Continued
Frontiers in Marine Science | www.frontiersin.org 4 August 2019 | Volume 6 | Article 469
FIGURE 1 |Total number of species of cuttlefishes (Family Sepiidae;A), bobtails (Family Sepiolidae;B), bottletails (Family Sepiadariidae;C), pygmy squids (Family Idiosepiidae;D), inshore squids (Family Loliginidae;E), octopuses (Families Octopodidae, Eledonidae, Enteroctopodidae, Megaleledonidae, and Bathypolypodidae;
F), and overall (total cephalopods;G) throughout the World Ocean.
the Arctic (ARC, n= 12) oceans, and surprisingly the Eastern Indo-Pacific (EIP,n= 11;Figure 2). The major hotspot (CIP) is consistent in all cephalopod groups, except for bobtails and bottletails which have their hotspot in the Temperate Northern Atlantic (TNA), and Temperate Australasia (TAUS), respectively.
For octopuses, the least diverse realm is Temperate Southern Africa (TSAF, n= 4), and not EIP (n= 9) or the poles (ARC, n= 6; SO,n= 15).
Similarities of Cephalopod Fauna Among Realms
Figure 3summarizes the relationship of the number of shared species among realms. Based on cluster analyses, cuttlefishes show three major clusters: (i) CIP, TNP, and TAUS group, (ii) WIP and TSAF, and (iii) TNA and TAT (Figure 3A). Bobtails show similar trends with CIP clustering with TNP and TAUS (Figure 3B). In the bottletails, CIP clusters with TAUS and WIP with TNP (Figure 3C). In pigmy “squids,” CIP also clustered with TNP and TAUS (but below broostrap threshold;Figure 3D).
In contrast, in both inshore squids (Figure 3E) and octopuses (Figure 3F) CIP clusters closer to WIP and then TNP, and EIP is separate from the CIP, WIP, and TNP. Moreover, the octopuses also clearly show a second Arctic/Atlantic cluster and a third TNP and TAUS cluster. In the overall analysis, cephalopod SO fauna is clearly separate from the other realms (see section “Endemism Rates per Realm”). As observed for the cuttlefishes (and contrarily to octopuses and squids), CIP cephalopod fauna clusters closer to those of the TNP and TAUS (Figure 3G).
Cephalopod Richness per Ecoregion
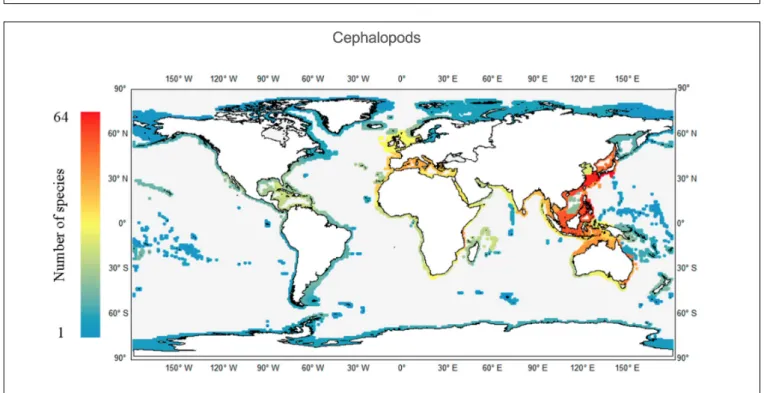
Within the 232 ecoregions considered, the highest richness value is observed in the Central Kuroshio Current ecoregion (CKC), with 64 species (Figure 4), followed by the East China Sea (ECS) (59 species) and Eastern Philippines (48 species) ecoregions. As mentioned above, the Indian Ocean was the second most diverse, and three hotspots were observed, namely the Java and Sulawesi Sea ecoregions, each with 38 species, and the Malacca Strait ecoregion with 33 species. Regarding the Atlantic Ocean, a major area of cephalopod richness spreads from the North Sea down to northwestern Africa, with the Western Mediterranean particularly rich (with 29 species) and in the Adriatic, Aegean and Ionian seas ecoregions (with 27 species). At any given latitude, the eastern Atlantic is always more diverse than the western side, in part because the family Sepiidae and the subfamily Sepiolinae are absent from the latter. As mentioned above, the families Sepiidae, Sepiadariidae, Idiosepiidae, and Loliginidae are absent from the polar ecoregions. Only the Family Sepiolidae and the octopuses are found in the Arctic coastal areas, varying from 1 to 4 species among ecoregions.
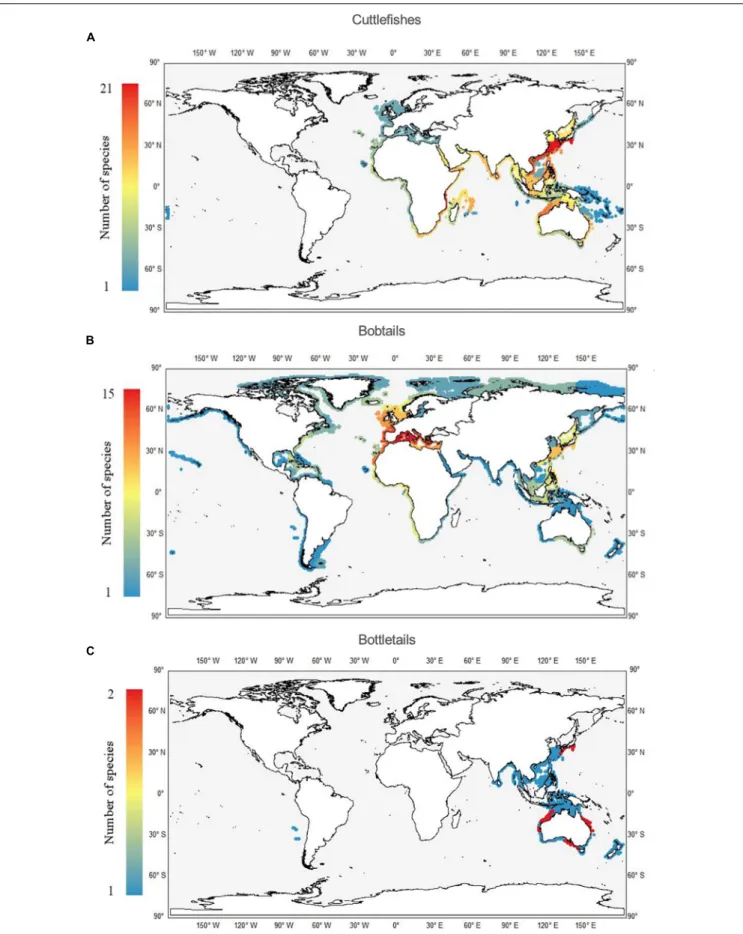
Cuttlefish, Bobtail, and Bottletail Richness per Ecoregion
The highest values of species richness in the Sepiidae are in the CKC and the ECS ecoregion, each with a total number of 21 species (Figure 5A). Two other hotspots are the adjacent Southern China to Vietnam ecoregion, and the East African Coral Coast, each with 13 species. A completely different global richness pattern was observed for bobtail species, members of the family Sepiolidae. Their maximum richness values were found in the Mediterranean ecoregions, especially in the western part with a total of 15 species (Figure 5B). The adjacent ecoregions, namely western Europe and north-western Africa, also showed high values (13 and 11, respectively). Quite similar values were also observed in the ECS and CKC ecoregions, each with eight species.
Bottletails are the least speciose groups, each with a maximum richness value of 2 per ecoregion, including the CKC, the Central and Southern Great Barrier Reef and the East Central Australian Shelf (Figure 5C).
Pygmy “Squid,” Inshore Squid and Octopus Richness per Ecoregion
Concerning the pygmy squids, there are certain similarities with the previous group regarding the restricted number of species;
that is, a maximum of 2 species in the same ecoregion. We identify two main areas: one in the Indo-Pacific, from north Australia to Indonesia, comprising 9 ecoregions; and a second in the area of South Africa to southern Mozambique, comprising 3 ecoregions (Figure 6A). Clear hotspots of inshore squid species richness occur in the Indo-Pacific area, more precisely in the Java Sea ecoregion (12 species), and Malacca Strait, Palawan and Sulawesi Seas (all three regions with 11 species each;Figure 6B).
In contrast, the greatest hotspot for octopuses occurs in the CKC ecoregion, yielding the maximum value of 24 species (Figure 6C).
The nearby ECS and Eastern Philippines ecoregions also have high species richness values, each with 18 species. Some of the least diverse ecoregions for octopuses were found within the TSAF and EIP realms.
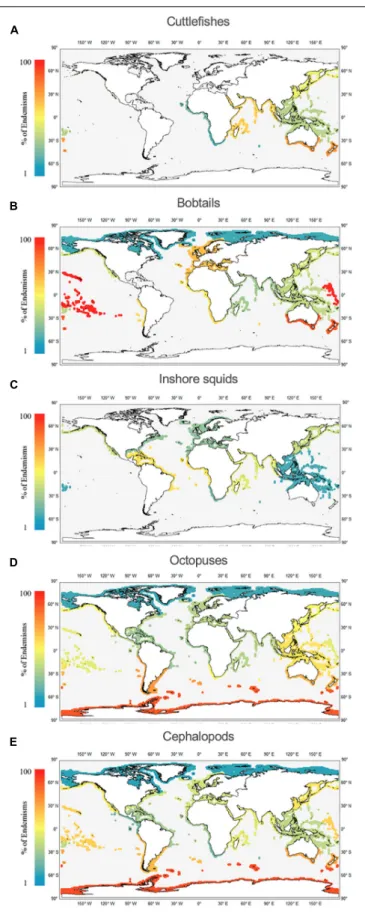
Endemism Rates per Realm
Among the 12 realms analyzed (Figures 7A–E and Supplementary Table S2), the realms with greater endemism rates of cuttlefishes (Figure 7A) are TAUS (53%), WIP (46%), and TNP (38%). There are no cuttlefish endemisms in TNA.
Regarding the bobtails (Figure 7B), the top three are the EIP (100%), TAUS (83%), and TNA (55%; mainly due to the highly- endemic Mediterranean fauna). The lowest value was found in the Arctic (17%). For inshore squids (Figure 7C), the top three for endemisms are the TAT (36%), WIP (29%) and TNP (27%). No squid endemisms were found in the TSA or TEP. The octopus fauna (Figure 7D) show most endemisms in the SO (87%), TSA (67%), and TAUS (65%); and lowest values in the
fmars-06-00469 August 1, 2019 Time: 18:37 # 6
Rosa et al. Global Biogeography of Coastal Cephalopods
FIGURE 2 |Continued
Frontiers in Marine Science | www.frontiersin.org 6 August 2019 | Volume 6 | Article 469
FIGURE 2 |Total number of species of cuttlefishes (Family Sepiidae;A), bobtails (Family Sepiolidae;B), bottletails (Family Sepiadariidae;C), pygmy squids (Family Idiosepiidae;D), inshore squids (Family Loliginidae;E), octopuses (Families Octopodidae, Eledonidae, Enteroctopodidae, Megaleledonidae, and Bathypolypodidae;
F), and overall (total cephalopods;G) per marine realm.: Arctic (ARC; light blue in lower panel), Temperate Northern Atlantic (TNA; blue), Tropical Atlantic (TAT; dark blue), Temperate Southern Africa (TSAF; light brown), Western Indo-Pacific (WIP; brown), Temperate Australasia (TAUS; purple), Central Indo-Pacific (CIP; dark red), Temperate Northern Pacific (TNP; red), Eastern Indo-Pacific (EIP; orange), Tropical Eastern Pacific (TEP, yellow), Temperate South America (TSA; green), Southern Ocean (SO; dark gray).(H)Is a global map for easy reference to the different realms.
Arctic (17%) and TAT (31%). In contrast to the other cephalopod groups, octopus endemisms occur in all 12 realms. As a group (Figure 7E), cephalopods show higher endemism in the SO (87%) and TAUS (77%), and lowest in the Arctic (25%).
DISCUSSION
Database Limitations
Species richness patterns presented here should be considered conservative because: (i) some assumptions were made (e.g., exclusion of oegopsids, new species and species-complexes;
see section “Materials and Methods”), and (ii) many coastal regions are still under-sampled (e.g., the African and western Indian Ocean region). Due to the lack of hard morphological structures, cephalopod species identification is challenging and difficult (Xavier et al., 2015), and some of the present diversity patterns may be driven by an underestimated cryptic diversity (Trontelj and Fišer, 2009). Moreover, cephalopods are known to be “masters of disguise” (Hanlon and Messenger, 2018), which may pose additional observational difficulties, particularly in the complex and heterogeneous tropical reef habitats (such as those found in the Eastern Indo-Pacific coldspot).
Central Indo-Pacific Realm and the Coral Triangle
The present study revealed that the greatest values in species richness of coastal cephalopod fauna were found in the CIP realm (Figure 2), a large area encompassing the Coral Triangle [known as the Indo-Australian Archipelago (IAA)], which is a well- known marine center of speciation and the largest global marine biodiversity hotspot for many taxa, ranging from corals to reef fishes (Bowen et al., 2013;Briggs and Bowen, 2013;Cowman and Bellwood, 2013). The IAA is a particularly broad shallow-water area with pronounced geological complexity and connects with two major biogeographic regions, key aspects that may promote speciation processes and/or provide species refuges (Bowen et al., 2013;Briggs and Bowen, 2013; Cowman and Bellwood, 2013).
Given that such a diversity hotspot is recurrent for so many taxonomic groups, including cephalopods (Figure 4), Renema et al. (2008)argued that there must be a unifying explanation.
Three main hypotheses are based on speciation processes and dispersal, describing this region as: (i) a “center of origin,”
implying that the IAA is a major site of speciation from which species disperse; (ii) a “center of overlap,” for which the IAA hotspot is a consequence of overlap from surrounding faunas, each of which is dispersing in all directions from its own separate biogeographic area; or (iii) a “center of accumulation”
where speciation occurs in peripheral areas and species extend
their ranges into this area through unidirectional dispersal as a result of prevailing currents (Woodland, 1983; Bellwood and Wainwright, 2002;Mora et al., 2003;Bowen et al., 2013;Gaither and Rocha, 2013; Bellwood et al., 2015). It is possible that, rather than just one mechanism, each of these processes might be contributing (seeMironov, 2006). At geological time scales, there is some evidence for three potential evolving stages. The IAA may have (i) begun as a center of accumulation (and/or refuge) for species that were part of the Tethys Sea fauna (during the loss of habitat as the Tethys Sea closed during the late Eocene and Oligocene); then (ii) become a center of origin or diversification, starting during the Miocene; and (iii) started a period of dispersal following the Pliocene (Bellwood and Wainwright, 2002;Renema et al., 2008;Briggs and Bowen, 2013;
Cowman and Bellwood, 2013). Such a biogeographic pattern may result from higher rates of survival within the IAA, without the need for any exceptional speciation events (Cowman and Bellwood, 2013). The apparent enhanced rates of speciation in the IAA may also be a comparative phenomenon linked to the lower temperatures and high endemism at higher latitudes (cf.Rabosky et al., 2018).
Central Kuroshio Current and East China Sea Ecoregions (Including the Ryukyu Archipelago)
The geological and evolutionary background mentioned above may explain why the CIP is the richest cephalopod-related realm.
Yet, increasing the spatial resolution of analyses reveals that the two main hotspots (at the ecoregion level) are outside the CIP, lying within the TNP realm. Among the 232 ecoregions considered, the highest cephalopod richness values are observed in the CKC and ECS ecoregions (Figure 4). Such a pattern may constitute evidence of the previously mentioned IAA dispersal stage: these two TNP ecoregions are located in a subtropical gyre with predominant currents running from the IAA, which is thus provided with a strong dispersal mechanism. Moreover, the CKC is also influenced by the Oyashio/Kuroshio transition zone. Such a complex oceanographic context, together with the nutrient enrichment dynamics of eddies and upwelling systems in the area, are known to greatly influence such marine ecosystems and related fisheries (Yatsu et al., 2013). Another, and probably more relevant, feature is the fact that both CKC and EAS ecoregions comprise the subtropical Ryukyu (Okinawan) Archipelago of Japan. This southern region of Japan borders the northern limit of the IAA and is well-known for its coral reefs and very high levels of marine biodiversity, both in terms of species richness and endemism (Hughes et al., 2002; Cowman et al., 2017;
Reimer et al., 2019).
fmars-06-00469 August 1, 2019 Time: 18:37 # 8
Rosa et al. Global Biogeography of Coastal Cephalopods
FIGURE 3 |Continued
Frontiers in Marine Science | www.frontiersin.org 8 August 2019 | Volume 6 | Article 469
FIGURE 3 |Dissimilarity index of cuttlefishes (Family Sepiidae;A), bobtails (Family Sepiolidae;B), bottletails (Family Sepiadariidae;C), pygmy squids (Family Idiosepiidae;D), inshore squids (Family Loliginidae;E), octopuses (Families Octopodidae, Eledonidae, Enteroctopodidae, Megaleledonidae, and Bathypolypodidae;
F), and overall (total cephalopods;G). Arctic (ARC; light blue in lower panel), Temperate Northern Atlantic (TNA; blue), Tropical Atlantic (TAT; dark blue), Temperate Southern Africa (TSAF; light brown), Western Indo-Pacific (WIP; brown), Temperate Australasia (TAUS; purple), Central Indo-Pacific (CIP; dark red), Temperate Northern Pacific (TNP; red), Eastern Indo-Pacific (EIP; orange), Tropical Eastern Pacific (TEP, yellow), Temperate South America (TSA; green), Southern Ocean (SO;
dark gray).(H)Is for easy reference to the different realms.
FIGURE 4 |Worldwide richness (number of species per ecoregion) patterns of coastal cephalopods.
Taxonomic Differences Between CIP and TNP Hotspots
Considering the overall patterns of major taxonomic (and consequently also ecological functional) groups, diversity is driven mainly by the octopus and cuttlefish fauna. The former reaches maximum richness values in the TNP, namely in CKC (24 species) and ECS (18 species;Figure 6). The (nektobenthic) family Sepiidae shows a similar occurrence of hotspots (CKC and ECS: each with 21 species;Figure 5A). In contrast, the (pelagic) inshore squid group shows highest richness in the CIP, within two different provinces: (i) the Sunda Shelf Province (already outside the IAA), composed of the Java Sea (12 species) and Malacca Strait ecoregions (11 species); and (ii) the Western IAA Province, which encompasses the Palawan and Sulawesi Seas ecoregions (each with 11 species;Figure 6). Understanding such speciation processes is quite challenging, first, because there are few geographic barriers (Briggs, 1994;Briggs and Bowen, 2013) and, second, because some coastal cephalopods have high dispersal potential with planktonic paralarval stages (Villanueva et al., 2016). Yet, the presence of ‘weak’ or intermittent barriers may have facilitated cephalopod differentiation in these Indo-Pacific areas. For instance, during Pleistocene sea-level fluctuations particularly during glacial periods with consequent low sea levels, a land bridge was formed on the Sunda shelf (the location of
the present squid hotspots), which severely restricted (but did not stop) water flow between the Pacific and Indian Oceans (McManus, 1985). A similar occurrence has been used to explain the evolutionary partitions (vicariant speciation) of other reef- associated groups, namely stomatopods (Barber et al., 2000) and fishes (Randall, 1998). In addition, the greater species richness of the benthic (octopuses) and nektobenthic (cuttlefishes and sepiolids) forms compared to the pelagic (squid) ones (see Figure 1) may indicate the importance of seabed (i.e., coral reef habitat) complexity and heterogeneity as a driving force in sympatric and/or parapatric speciation processes in the benthic and nectobenthic groups. The relatively low levels of endemism in the CIP (green colors in Figure 7E) and the higher number of shared species in both the TNP and TAUS (Figure 3) are suggestive that the IAA was a center of origin and a source of species for cephalopod communities in the North Western Pacific and Indian Oceans.
Richness Declines From CIP to EIP
Figure 4 reveals a striking difference between the CIP and EIP species richness levels, and a drastic shift from a hotspot (former) to a coldspot (latter) in adjacent realms. Such a steep longitudinal cline is not seen in other marine taxa (Stuart-Smith et al., 2013;Ramirez et al., 2017). For instance,Mora et al. (2003)
fmars-06-00469 August 1, 2019 Time: 18:37 # 10
Rosa et al. Global Biogeography of Coastal Cephalopods
FIGURE 5 |Worldwide richness (number of species per ecoregion) patterns of cuttlefishes (Family Sepiidae;A), bobtails (Family Sepiolidae;B), and bottletails (Family Sepiadariidae;C).
Frontiers in Marine Science | www.frontiersin.org 10 August 2019 | Volume 6 | Article 469
FIGURE 6 |Worldwide richness (number of species per ecoregion) patterns of pygmy squids (Family Idiosepiidae;A), inshore squids (Family Loliginidae;B) and octopuses (Families Octopodidae, Eledonidae, Enteroctopodidae, Megaleledonidae, and Bathypolypodidae;C).
fmars-06-00469 August 1, 2019 Time: 18:37 # 12
Rosa et al. Global Biogeography of Coastal Cephalopods
FIGURE 7 |Worldwide distribution of cephalopod endemisms (%) per realm, namely cuttlefishes (Family Sepiidae;A), bobtails (Family Sepiolidae;B),
(Continued)
FIGURE 7 |Continued
inshore squids (Family Loliginidae;C), octopuses (Families Octopodidae, Eledonidae, Enteroctopodidae, Megaleledonidae, and Bathypolypodidae;D), and cephalopods (sum of all groups;E).
andParravicini et al. (2013) found similar trends, but far less pronounced, with tropical fish richness decreasing with distance away from the IAA toward the east. Cephalopod EIP values are even lower than those found in the polar regions (cf.Figure 2).
Such a sharp longitudinal shift in cephalopod species richness reveals that speciation and dispersal from the CIP (and the IAA) played a negligible role in assembling cephalopod communities in the eastern (isolated) central Pacific archipelagos and identifies them as evolutionary dead ends. Yet, such trend may also be a function of the narrow continental shelves in the eastern Pacific.
Nonetheless, this result supports the Center of Speciation model and goes against the Center of Accumulation and/or Overlap theories because the latter, in particular, advocates that oceanic islands (e.g., the Hawaiian archipelago) may constitute engines for biodiversity production (see examples inBowen et al., 2013).
The TEP and EIP alignment in the cephalopod cluster analyses (Figure 7) reflects the isolation of the East Pacific regions from the Indo-Pacific during the Eocene and Oligocene (Cowman and Bellwood, 2013). Yet, there are studies showing that some TEP invertebrate and fish fauna are derived from the EIP, and vice- versa, implying instances of successful crossing of the “world’s most potent marine biogeographic barrier” (Lessios et al., 1998;
Lessios and Robertson, 2006).
Hotspots, Endemism, and Biogeographic Barriers in the Atlantic Ocean
Among the most speciose groups, and in contrast to octopuses and squids, bobtails have their maximum species richness values in the Mediterranean Sea (Figure 5, middle panel). This pattern may be associated with isolation of the Mediterranean Sea from the Atlantic (about 5.5 Mya), with the consequent boost in salinity (the “Messinian salinity crisis”), extinction of stenohaline species and origin of endemisms (Rosa et al., 2008a;Bello, 2017).
At the other Atlantic margin, the most conspicuous feature is the absence of cuttlefishes (Khromov, 1998). Presently, the Caribbean area is well-known as a marine biodiversity hotspot of other faunal groups (Briggs and Bowen, 2013;Cowman and Bellwood, 2013), but for the cephalopods it seems to have only moderately elevated diversity on a global scale (Figures 4–6).
Closure of the Isthmus of Panama (about 3.1 My; Emiliani, 1966;Coates and Obando, 1996) led to the isolation of octopus and squid populations by vicariance and thence to allopatric speciation (Voight, 1988; Gleadall, 2013; Ibáñez et al., 2016;
Ulloa et al., 2017). This geological event and accompanying historical sea-level changes and formation of refugia (cf.
Vermeij, 1993; Lessios, 2008) explain the greater richness in that tropical ecoregion in comparison to adjacent ones (e.g., the North Brazil Shelf). The presence of the Amazon/Orinoco freshwater outflow-related biogeographic barrier (established around 11 Mya;Hoorn et al., 1995) is also evident with: (i) the
Frontiers in Marine Science | www.frontiersin.org 12 August 2019 | Volume 6 | Article 469
reduced sepiolid fauna (Figure 5) and (ii) enhanced squid and octopod species richness changes in the Amazonia and Guyanan ecoregions (Figure 6). Another barrier-induced species turnover on the other side of the Atlantic is found in the Namib and Namaqua ecoregions (Figures 5,6) due to action (for at least 2 Mya) of the cold Benguela Current (i.e., the Benguela barrier:
Marlow et al., 2000;Floeter et al., 2008).
Polar Endemisms and Shared Richness
Cephalopods show higher endemism in the SO (87%) and lower in the Arctic (25%; Figure 7E; see also Supplementary Table S2). Such a distinct pattern reflects the younger age of the Arctic fauna: the respective shelf became ice-free only after the Pleistocene (Xavier et al., 2018). Moreover, it may also reflect the invasion of the Arctic by Atlantic species linked to climate change, i.e., the “Atlantification of the Arctic” (Jørgensen et al., 2016). In contrast, Antarctic waters have an old fauna and a well-known high level of endemism (Dayton et al., 1994), for cephalopods driven exclusively by the coastal (shelf) octopus fauna. The Antarctic is assumed to be another center of origin of some deep-water fauna, including some groups of octopuses (Collins and Rodhouse, 2006; Strugnell et al., 2008; Xavier et al., 2018). The high endemism of benthic octopuses in this continent was supported by the evolution toward a holobenthic development that has influencedin situspeciation (Ibáñez et al., 2018).The historical causes entail isolation of the Antarctic fauna by (i) separation of the Antarctic continent from South America and Australia; and (ii) subsequent formation of the Antarctic Circumpolar Current, as the Drake Passage and Tasman gateway opened up around 30 Mya ago (Livermore et al., 2005; Scher et al., 2015).Strugnell et al. (2008)estimated that the lineage of Antarctic (and deep-sea) octopuses diverged around 33 Mya (and radiated at 15 Mya). Yet, calibrations based on closure of the Atrato Seaway and subspecies vicariance during the Last Glacial Maximum (Gleadall, 2013) suggest that octopus divergence may have been more recent and more rapid. Griffiths et al. (2009) found closer faunal affinity between South America (here termed the TSA realm) and the SO, than between SO and Australia (TAUS). However, for the octopus fauna the present study found the opposite, and SO was clustered with TAUS (seeFigure 3).
Interestingly, TAUS was the realm with the second highest level of endemism (77%). Such a feature has been described also for other mollusks, e.g., gastropods and bivalves, in both the New Zealand region and the Tasmanian Province (Griffiths et al., 2009).
CONCLUSION
Acknowledging the database limitations, this is the first global assessment of coastal cephalopod richness hotspots and reveals that the most diverse realm is the Central Indo-Pacific (CIP), followed by the TNP and WIP. Concomitantly, the present study points out that the regional (eco-region) hotspots vary greatly among cephalopod groups, highlighting distinct (historical) dispersal processes and mechanisms of speciation. For instance, the major hotspots of octopuses and cuttlefishes are outside the Coral Triangle (a region known as the “cradle of marine life”
on the planet), probably evidence of a dispersal stage associated with the subtropical gyre of predominant currents running from that tropical region. In contrast, inshore squids show their major hotspots within the Coral Triangle, in ecoregions that suffered from Pleistocene sea-level fluctuations with a concomitant formation of land bridges during low sea levels. Moreover, our findings reveal a sharp longitudinal shift in cephalopod richness from the Coral Triangle eastwards, suggesting that speciation and dispersal were weak in the isolated central Pacific archipelagos (i.e., evolutionary dead ends).
We argue that the combination of such spatial information (e.g., at the ecoregion level) with climate change projections may be of paramount importance to identify key diversity areas and to prioritize them for conservation purposes (Ramirez et al., 2017).
According to Hobday and Pecl (2014), regions more prone to be impacted by climate change may be considered key areas for adaptation measures for marine ecosystems and respective ocean uses, especially fisheries. Yet, the abundance of the most commercially-important cephalopod species has been increasing on a global scale and, therefore, somehow, they are benefiting from the changing ocean environment (Doubleday et al., 2016).
The fact that they “live fast and die young” (O’ Dor and Webber, 1991) may allow them to adapt to future global warming more quickly than their fish competitors and predators. There are already several documented instances of poleward shifts in species distributions associated with climate forcing, in octopus (e.g.,Galil, 2007;Domínguez-Contreras et al., 2013;Osman et al., 2014; Ramos et al., 2014), squid (e.g., Zeidberg and Robison, 2007;Golikov et al., 2013, 2014), and sepiolid faunas (Quetglas et al., 2013; Golikov et al., 2014). It is also important to note that most of these shifts are occurring outside the tropics, where the marine ecosystems are warming twice as fast as the global mean (Hoegh-Guldberg and Bruno, 2010;Fossheim et al., 2015).
Thus, enhanced borealization of cephalopod communities into the Arctic is expected during this century (Xavier et al., 2016a).
DATA AVAILABILITY
All datasets generated for this study are included in the manuscript and/or theSupplementary Files.
AUTHOR CONTRIBUTIONS
RR designed the study. RR, VP, LM, and FB collated and analyzed the data. All authors contributed to and checked the database, and wrote the manuscript.
FUNDING
This study was supported by the Fundação para a Ciência e Tecnologia (FCT), through the strategic project UID/MAR/04292/2019 granted to MARE, the IF Development grant awarded to RR (IF/01373/2013). IG was supported by a grant from the Japan Science and Technology Agency (J130000263). RV was supported by the Spanish Ministries of
fmars-06-00469 August 1, 2019 Time: 18:37 # 14
Rosa et al. Global Biogeography of Coastal Cephalopods
Education and Culture (Grant No. PRX17/00090) and Science (OCTOSET Project RTI2018-097908-B-I00). This study was also supported by the Portuguese Program MAR2020 – project VALPRAD (MAR-01.04.02-FEAMP-0007).
ACKNOWLEDGMENTS
This paper arose as a result of a workshop on cephalopod biogeography and phylogeny at the Cephalopod International
Advisory Council Conference in Hakodate, Japan, 8 and 9 November, 2015, organized by Ian Gleadall, Jaruwat Nabhitabhata, and Rigoberto Rosas Luis.
SUPPLEMENTARY MATERIAL
The Supplementary Material for this article can be found online at: https://www.frontiersin.org/articles/10.3389/fmars.
2019.00469/full#supplementary-material
REFERENCES
Allcock, A. L., Barratt, I., Eléaume, M., Linse, K., Norman, M. D., Smith, P. J., et al. (2011). Cryptic speciation and the circumpolarity debate: a case study on endemic Southern Ocean octopuses using the COI barcode of life.Deep Sea Res. Part II Top. Stud. Oceanogr.58, 242–249. doi: 10.1016/j.dsr2.2010.
05.016
Alon, S., Garrett, S. C., Levanon, E. Y., Olson, S., Graveley, B. R., Rosenthal, J. J. C., et al. (2015). The majority of transcripts in the squid nervous system are extensively recoded by A-to-I RNA editing.eLife4:e05198. doi: 10.7554/eLife.
05198
Amor, M. D., Laptikhovsky, V., Norman, M. D., and Strugnell, J. M. (2015).
Genetic evidence extends the known distribution ofOctopus insularisto the mid-Atlantic islands Ascension and St Helena.J. Mar. Biol. Assoc. U. K.97, 753–758. doi: 10.1017/s0025315415000958
Amor, M. D., Norman, M. D., Cameron, H. E., and Strugnell, J. M. (2014).
Allopatric speciation within a cryptic species complex of Australasian octopuses.PLoS One9:e98982. doi: 10.1371/journal.pone.0098982
Amor, M. D., Norman, M. D., Roura, R., Leite, T. S., Gleadall, I. G., Reid, A., et al. (2017). Morphological assessment of theOctopus vulgarisspecies complex evaluated in light of molecular-based phylogenetic inferences.Zool. Scrip.46, 275–288. doi: 10.1111/zsc.12207
Anderson, F. E., Engelke, R., Jarrett, K., Valinassab, T., Mohamed, K. S., Asokan, P. K., et al. (2011). Phylogeny of the Sepia pharaonis species complex (Cephalopoda: Sepiida) based on analyses of mitochondrial and nuclear DNA sequence data. J. Molluscan Stud. 77, 65–75. doi: 10.1093/mollus/
eyq034
Barber, P. H., Palumbi, S. R., Erdmann, M. V., and Moosa, M. K. (2000). A marine Wallace’s line?Nature406, 406–407.
Barnosky, A. D., Hadly, E. A., Bascompte, J., Berlow, E. L., Brown, J. H., Fortelius, M., et al. (2012). Approaching a state shift in Earth’s biosphere.Nature486, 52–58. doi: 10.1038/nature11018
Bello, G. (2017). The mediterranean sepiolidae (Mollusca: Cephalopoda) diversity.
Bull. Entomol. Soc. Malta9:128. Available at: https://www.um.edu.mt/library/
oar/handle/123456789/23820
Bellwood, D. R., Goatley, C. H. R., Cowman, P. F., and Bellwood, O. (2015). “The evolution of fishes on coral reefs: fossils, phylogenies and functions,” inEcology of Fishes on Coral Reefs, ed. C. Mora (Cambridge: Cambridge University Press), 55–63. doi: 10.1017/cbo9781316105412.008
Bellwood, D. R., and Wainwright, P. C. (2002). “The history and biogeography of fishes on coral reefs,” in Coral Reef Fishes. Dynamics and Diversity in a Complex Ecosystem, ed. P. F. Sale (San Diego, CA: Academic Press), 5–32.
doi: 10.1016/b978-012615185-5/50003-7
Bowen, B. W., Rocha, L. A., Toonen, R. J., Karl, S. A., and Lab, T. (2013). The origins of tropical marine biodiversity.Trends Ecol. Evol.28, 359–366. doi:
10.1016/j.tree.2013.01.018
Boyle, P., and Rodhouse, P. (2005).Cephalopods. Ecology and Fisheries. Oxford:
Blackwell Publishing.
Boyle, P. R., and Boletzky, S. (1996). Cephalopod populations: definition and dynamics.Philos. Trans. R. Soc. Lond. B351, 985–1002.
Briggs, J. C. (1994). Species diversity: land and sea compared. Syst. Biol.43, 130–135. doi: 10.1093/sysbio/43.1.130
Briggs, J. C., and Bowen, B. W. (2013). Marine shelf habitat: biogeography and evolution.J. Biogeogr.40, 1023–1035. doi: 10.1111/jbi.12082
Cardinale, B. J., Duffy, J. E., Gonzalez, A., Hooper, D. U., Perrings, C., Venail, P., et al. (2012). Biodiversity loss and its impact on humanity.Nature486, 59–67.
doi: 10.1038/nature11148
Cheng, S. H., Anderson, F. E., Bergman, A., Mahardika, G. N., Muchlisin, Z. A., Dang, B. T., et al. (2014). Molecular evidence for co-occurring cryptic lineages within theSepioteuthiscf. lessoniana species complex in the Indian and Indo- West Pacific Oceans.Hydrobiologia725, 165–188. doi: 10.1007/s10750-013- 1778-0
Coates, A. G., and Obando, J. A. (1996). “The geologic evolution of the Central American isthmus,” inEvolution and Environment in Tropical America, eds J.
Jackson, A. F. Budd, and A. G. Coates (Chicago: University of Chicago Press), 21–56.
Collins, M. A., and Rodhouse, P. G. (2006). Southern Ocean cephalopods.Adv.
Mar. Biol.50, 191–265. doi: 10.1016/s0065-2881(05)50003-8
Cowman, P. F., and Bellwood, D. R. (2013). The historical biogeography of coral reef fishes: global patterns of origination and dispersal.J. Biogeogr.40, 209–224.
doi: 10.1111/jbi.12003
Cowman, P. F., Parravicini, V., Kulbicki, M., and Floeter, S. R. (2017). The biogeography of tropical reef fishes: endemism and provinciality through time.
Biol. Rev.92, 2112–2130. doi: 10.1111/brv.12323
Dayton, P. K., Mordida, B. J., and Bacon, F. (1994). Marine communities.Am. Zool.
34, 90–99.
Domínguez-Contreras, J. F., Ceballos-Vázquez, B. P., Hochberg, F. G., and Arellano-Martínez, M. (2013). A new record in a well-established population of Octopus hubbsorum (Cephalopoda: Octopodidae) expands its known geographic distribution range and maximum size.Am. Malacol. Bull.31, 95–99.
doi: 10.4003/006.031.0122
Doubleday, Z. A., Prowse, T. A., Arkhipkin, A., Pierce, G. J., Semmens, J., Steer, M., et al. (2016). Global proliferation of cephalopods.Curr. Biol.26, R406–R407.
doi: 10.1016/j.cub.2016.04.002
Emiliani, C. (1966). Isotopic paleotemperatures.Science154, 851–857. doi: 10.
1126/science.154.3751.851
Floeter, S. R., Rocha, L. A., Robertson, D. R., Joyeux, J. C., Smith-Vaniz, W. F., Wirtz, P., et al. (2008). Atlantic reef fish biogeography and evolution.J. Biogeogr.
35, 22–47.
Fossheim, M., Primicerio, R., Johannesen, E., Ingvaldsen, R. B., Aschan, M. M., and Dolgov, A. V. (2015). Recent warming leads to a rapid borealization of fish communities in the Arctic.Nat. Clim. Change5:673. doi: 10.1038/nclimate2647 Gaither, M. R., and Rocha, L. A. (2013). Origins of species richness in the Indo-Malay-Philippine biodiversity hotspot: evidence for the centre of overlap hypothesis.J. Biogeogr.40, 1638–1648. doi: 10.1111/jbi.12126
Galil, B. S. (2007). Seeing red: alien species along the Mediterranean coast of Israel.
Aquat. Invasions2, 281–312. doi: 10.3391/ai.2007.2.4.2
Gleadall, I. G. (2013). A molecular sequence proxy forMuusoctopus januariiand calibration of recent divergence among a group of mesobenthic octopuses.
J. Exp. Mar. Biol. Ecol.447, 106–122. doi: 10.1016/j.jembe.2013.02.017 Gleadall, I. G. (2016). Octopus sinensis d’Orbigny, 1841 (Cephalopoda:
Octopodidae): valid species name for the commercially valuable East Asian common octopus.Species Divers.21, 31–42. doi: 10.12782/sd.21.1.031 Golikov, A. V., Sabirov, R. M., Lubin, P. A., and Jørgensen, L. L. (2013). Changes in
distribution and range structure of Arctic cephalopods due to climatic changes of the last decades.Biodiversity14, 24–35.
Golikov, A. V., Sabirov, R. M., Lubin, P. A., Jørgensen, L. L., and Beck, I.-M. (2014).
The northernmost record ofSepietta oweniana(Cephalopoda: Sepiolidae) and
Frontiers in Marine Science | www.frontiersin.org 14 August 2019 | Volume 6 | Article 469
comments on boreo-subtropical cephalopod species occurrence in the Arctic.
Mar. Biodivers. Records7:e58.
González-Gómez, R., Barriga, I., Pliego-Cárdenas, R., and Morillo-Velarde, P. S.
(2018). An integrative taxonomic approach revealsOctopus insularisas the dominant species in the Veracruz Reef System (southwestern Gulf of Mexico).
PeerJ6:e6015. doi: 10.7717/peerj.6015
Gray, J. S. (2000). The measurement of marine species diversity, with an application to the benthic fauna of the Norwegian continental shelf.J. Exp. Mar. Biol. Ecol.
250, 23–49. doi: 10.1016/s0022-0981(00)00178-7
Griffiths, H. W., Barnes, D. K. A., and Linse, K. (2009). Towards a generalized biogeography of the Southern Ocean benthos.J. Biogeogr.6, 162–177. doi:
10.1111/j.1365-2699.2008.01979.x
Hammer, Ø, Harper, D. A. T., and Ryan, P. D. (2001). PAST: paleontological statistics software package for education and data analysis.Palaentol. Electron.
4, 1–9.
Hanlon, R., Vecchione, M., and Allcock, A. L. (2018).Octopus, Squid and Cuttlefish:
a Visual Scientific Guide. London: Ivy Press.
Hanlon, R. T., and Messenger, J. B. (2018). Cephalopod Behaviour, 2nd Edn.
Cambridge: Cambridge University Press.
Hobday, A. J., and Pecl, G. T. (2014). Identification of global marine hotspots:
sentinels for change and vanguards for adaptation action.Rev. Fish Biol. Fish.
24, 415–425. doi: 10.1007/s11160-013-9326-6
Hoegh-Guldberg, O., and Bruno, J. F. (2010). The impact of climate change on the world’s marine ecosystems.Science328, 1523–1528. doi: 10.1126/science.
1189930
Hoekstra, J. M., Boucher, T. M., Ricketts, T. H., and Roberts, C. (2005). Confronting a biome crisis: global disparities of habitat loss and protection.Ecol. Lett.8, 23–29. doi: 10.1111/j.1461-0248.2004.00686.x
Hooper, D. U., Adair, E. C., Cardinale, B. J., Byrnes, J. E. K., Hungate, B. A., Matulich, K. L., et al. (2012). A global synthesis reveals biodiversity loss as a major driver of ecosystem change.Nature 486, 105–U129. doi: 10.1038/
nature11118
Hoorn, C., Guerrero, J., Sarmiento, G. A., and Lorente, M. A. (1995). Andean tectonics as a cause for changing drainage patterns in Miocene northern South America.Geology23, 237–240.
Hughes, T. P., Bellwood, D. R., and Connolly, S. R. (2002). Biodiversity hotspots, centres of endemicity, and the conservation of coral reefs.Ecol. Lett.5, 775–784.
doi: 10.1046/j.1461-0248.2002.00383.x
Ibáñez, C. M., Braid, H., Carrasco, S. A., López-Córdova, D., Torretti, G., and Camus, P. A. (2019). Zoogeographic patterns of pelagic oceanic cephalopods along the eastern Pacific Ocean.J. Biogeogr.46, 1260–1273. doi: 10.1111/jbi.
13588
Ibáñez, C. M., Camus, P. A., and Rocha, F. (2009). Diversity and distribution of cephalopod species of the coast off Chile.Mar. Biol. Res.5, 374–384. doi:
10.1080/17451000802534873
Ibáñez, C. M., Pardo-Gandarillas, M. C., Peña, F., Gleadall, I. G., Poulin, E., and Sellanes, J. (2016). Phylogeny and biogeography ofMuusoctopus(Cephalopoda:
Enteroctopodidae).Zool. Scrip.45, 494–503. doi: 10.1111/zsc.12171 Ibáñez, C. M., Rezende, E., Sepúlveda, R. D., Avaria-Llautureo, J., Hernández,
C. E., Sellanes, J., et al. (2018). Thorson’s rule, life history evolution and diversification of benthic octopuses (Cephalopoda: Octopodoidea).Evolution 72-9, 1829–1839. doi: 10.1111/evo.13559
Jereb, P., and Roper, C. F. E. (eds) (2005). “Cephalopods of the world.
An annotated and illustrated catalogue of cephalopod species known to date,” inChambered Nautiluses and Sepioids (Nautilidae, Sepiidae, Sepiolidae, Sepiadariidae, Idiosepiidae and Spirulidae), Vol. 1, (Rome: FAO), 262.
Jereb, P., and Roper, C. F. E. (eds) (2010). “Cephalopods of the world. An annotated and illustrated catalogue of cephalopod species known to date,” inMyopsid and Oegopsid Squids, Vol. 2, (Rome: FAO), 605.
Jereb, P., Roper, C. F. E., Norman, M. D., and Finn, J. K. (eds) (2014). “Cephalopods of the world. An annotated and illustrated catalogue of cephalopod species known to date,” inOctopods and Vampire Squids, Vol. 3, (Rome: FAO).
Jørgensen, L. L., Archambault, P., Armstrong, C., Dolgov, A., Edinger, E., Gaston, T., et al. (2016). “Arctic marine biodiversity,” inProceedings of the 1st Global Integrated Marine Assessment, World Ocean Assessment I, (New York, NY), 47.
Judkins, H. L., Vecchione, M., Roper, C. F. E., and Torres, J. (2010). Cephalopod species richness in the wider Caribbean region.ICES J. Mar. Sci.67, 1392–1400.
Khromov, D. N. (1998). Distribution patterns of Sepiidae.Smithson. Contrib. Zool.
586, 191–206.
Leite, T. S., Haimovici, M., Molina, W., and Warnke, K. (2008). Morphological and genetic description ofOctopus insularis, a new cryptic species in theOctopus vulgariscomplex (Cephalopoda: Octopodidae) from the tropical southwestern Atlantic.J. Molluscan Stud.74, 63–74. doi: 10.1093/mollus/eym050
Lessios, H. A. (2008). The great American schism: divergence of marine organisms after the rise of the Central American Isthmus.Annu. Rev. Ecol. Evol. Syst.39, 63–91. doi: 10.1146/annurev.ecolsys.38.091206.095815
Lessios, H. A., Kessing, B. D., and Robertson, D. R. (1998). Massive gene flow across the world’s most potent marine biogeographic barrier.Proc. R. Soc. Lond. Ser. B 265, 583–588. doi: 10.1098/rspb.1998.0334
Lessios, H. A., and Robertson, D. R. (2006). Crossing the impassable: genetic connections in 20 reef fishes across the eastern Pacific barrier.Proc. R. Soc. Lond.
Ser. B273, 2201–2208. doi: 10.1098/rspb.2006.3543
Liscovitch-Brauer, N., Alon, S., Porath, H. T., Elstein, B., Unger, R., Ziv, T., et al.
(2017). Trade-off between transcriptome plasticity and genome evolution in cephalopods.Cell169, 191–202. doi: 10.1016/j.cell.2017.03.025
Livermore, R., Nankivell, A., Eagles, G., and Morris, P. (2005). Paleogene opening of Drake passage.Earth Planet Lett.236, 459–470. doi: 10.1016/j.epsl.2005.
03.027
Marchese, C. (2015). Biodiversity hotspots: a shortcut for a more complicated concept.Glob. Ecol. Conserv.3, 297–309. doi: 10.1016/j.gecco.2014.12.008 Marlow, J. R., Lange, C. B., Wefer, G., and Rosell-Mele, A. (2000). Upwelling
intensification as part of the Pliocene-Pleistocene climate transition.Science 290, 2288–2291.
McManus, J. W. (1985). “Marine speciation, tectonics, and sea-level changes in south-east Asia,” inProceedings of the 5th International Coral Reef Symposium, Vol. 4, (Tahiti), 133–138.
Mironov, A. N. (2006). Centers of marine fauna redistribution.Entomol. Rev.86, S32–S44.
Mittermeier, R. A., Turner, W. R., Larsen, F. W., Brooks, T. M., and Gascon, C. (2011). “Global biodiversity conservation: the critical role of hotspots,” in Biodiversity Hotspots, eds F. E. Zachos and J. C. Habel (London: Springer Publishers), 3–22. doi: 10.1007/978-3-642-20992-5_1
Mora, C., Chittaro, P. M., Sale, P. F., Kritzer, J. P., and Ludsin, S. A. (2003).
Patterns and processes in reef fish diversity.Nature421, 933–936. doi: 10.1038/
nature01393
Myers, N. (1988). Threatened biotas: "Hot spots" in tropical forests.
Environmentalist8, 187–208. doi: 10.1007/bf02240252
Myers, N. (2003). Biodiversity hotspots revisited.Bioscience53, 916–917.
O’ Dor, R. K., and Webber, D. M. (1991). Invertebrate athletes: trade-offs between transport efficiency and power density in cephalopod evolution.J. Exp. Biol.
160, 93–112.
Osman, I. H., Gabr, H. R., El-Etreby, S., and Mohammed, S. Z. (2014). Feeding biology and biochemical composition of the lessepsian migrantOctopus aegina (Cephalopoda: Octopodidae).Egypt. J. Aquat. Biol. Fish.18, 15–27. doi: 10.
12816/0011073
Parravicini, V., Kulbicki, M., Bellwood, D. R., Friedlander, A. M., Arias-Gonzalez, J. E., Chabanet, P., et al. (2013). Global patterns and predictors of tropical reef fish species richness.Ecography36, 001–009.
Poloczanska, E. S., Brown, C. J., Sydeman, W. J., Kiessling, W., Schoeman, D. S., Moore, P. J., et al. (2013). Global imprint of climate change on marine life.Nat.
Clim. Change3, 919–925. doi: 10.1038/nclimate1958
Quetglas, A., Ordines, F., Gonzalez, M., Zaragoza, N., and Mallol, S. (2013).
Uncommon pelagic and deep-sea cephalopods in the Mediterranean: new data and literature review.Mediterr. Mar. Sci.14, 69–85.
Rabosky, D. L., Chang, J., Title, P. O., Cowman, P. F., Sallan, L., Friedman, M., et al. (2018). An inverse latitudinal gradient in speciation rate for marine fishes.
Nature559, 392–395. doi: 10.1038/s41586-018-0273-1
Ramirez, F., Afan, I., Davis, L. S., and Chiaradia, A. (2017). Climate impacts on global hot spots of marine biodiversity.Sci. Adv.3:e1601198. doi: 10.1126/
sciadv.1601198
Ramos, J. E., Pecl, G. T., Moltschaniwskyj, N. A., Strugnell, J. M., León, R. I., and Semmens, J. M. (2014). Body size, growth and life span: implications for the polewards range shift ofOctopus tetricusin south-eastern Australia.PLoS One 9:e103480. doi: 10.1371/journal.pone.0103480