ORIGINAL ARTICLE
Naturally Occurring Stable Calcium Isotope Ratios in
Body Compartments Provide a Novel Biomarker of Bone Mineral Balance in Children and Young Adults
Rukshana Shroff,
1Mary Fewtrell,
2,3Alexander Heuser,
4Ana Kolevica,
4Alexander Lalayiannis,
1Louise McAlister,
5Selmy Silva,
1Nadine Goodman,
1Claus P Schmitt,
6Lorenzo Biassoni,
2Anja Rahn,
7Dagmar-Christiane Fischer,
7and Anton Eisenhauer
41Renal Unit, UCL Great Ormond Street Hospital for Children NHS Foundation Trust and Institute of Child Health, London, UK
2Radiology Department, UCL Great Ormond Street Hospital for Children NHS Foundation Trust, London, UK
3Childhood Nutrition Research Centre, UCL Great Ormond Street Institute of Child Health, London, UK
4GEOMAR Helmholtz Centre for Ocean Research Kiel, Kiel, Germany
5Dietetics Department, UCL Great Ormond Street Hospital for Children NHS Foundation Trust, London, UK
6Center for Pediatric and Adolescent Medicine, University of Heidelberg, Heidelberg, Germany
7Department of Pediatrics, Rostock University Medical Centre, Rostock, Germany
ABSTRACT
Serum calcium (Ca), bone biomarkers, and radiological imaging do not allow accurate evaluation of bone mineral balance (BMB), a key determinant of bone mineral density (BMD) and fracture risk. We studied naturally occurring stable (non-radioactive) Ca isotopes in different body pools as a potential biomarker of BMB.42Ca and44Ca are absorbed from our diet and sequestered into different body compartments following kinetic principles of isotope fractionation; isotopically light42Ca is preferentially incorporated into bone, whereas heavier44Ca preferentially remains in blood and is excreted in urine and feces. Their ratio (δ44/42Ca) in serum and urine increases during bone formation and decreases with bone resorption. In 117 healthy participants, we measured Ca isotopes, bio- markers, and BMD by dual-energy X-ray absorptiometry (DXA) and tibial peripheral quantitative CT (pQCT).44Ca and42Ca were mea- sured by multi-collector ionization-coupled plasma mass-spectrometry in serum, urine, and feces. The relationship between bone Ca gain and loss was calculated using a compartment model.δ44/42Caserumandδ44/42Caurinewere higher in children (n= 66, median age 13 years) compared with adults (n= 51, median age 28 years;p< 0.0001 andp= 0.008, respectively).δ44/42Caserumincreased with height in boys (p< 0.001, R2= 0.65) and was greatest at Tanner stage 4.δ44/42Caserumcorrelated positively with biomarkers of bone formation (25-hydroxyvitaminD [p< 0.0001, R2= 0.37] and alkaline phosphatase [p= 0.009, R2= 0.18]) and negatively with bone resorption marker parathyroid hormone (PTH;p= 0.03, R2= 0.13).δ44/42Caserumstrongly positively correlated with tibial cortical BMDZ-score (n= 62;p< 0.001, R2= 0.39) but not DXA. Independent predictors of tibial cortical BMDZ-score wereδ44/42Caserum
(p= 0.004,β= 0.37), 25-hydroxyvitaminD (p= 0.04,β= 0.19) and PTH (p= 0.03,β=−0.13), together predicting 76% of variability.
In conclusion, naturally occurring Ca isotope ratios in different body compartments may provide a novel, non-invasive method of asses- sing bone mineralization. Defining an accurate biomarker of BMB could form the basis of future studies investigating Ca dynamics in disease states and the impact of treatments that affect bone homeostasis. © 2020 The Authors.Journal of Bone and Mineral Research published by Wiley Periodicals LLC on behalf of American Society for Bone and Mineral Research (ASBMR).
KEY WORDS:BONE MINERAL BALANCE; BONE MINERAL DENSITY; CALCIUM; ISOTOPES; PERIPHERAL QUANTITATIVE CT SCAN
Introduction
C
alcium (Ca) is essential for skeletal growth and mineraliza- tion, and the skeleton holds >99% of the body’s totalCa.(1,2) Phases of rapid growth in childhood and adolescence are critical periods for bone mass accrual.(3)Thereafter, Ca accu- mulation in the skeleton continues at a slower pace until peak bone mass is reached(4,5)when bone formation and resorption
This is an open access article under the terms of the Creative Commons Attribution License, which permits use, distribution and reproduction in any medium, provided the original work is properly cited.
Received in original form June 14, 2020; revised form July 29, 2020; accepted August 2, 2020. Accepted manuscript online August 12, 2020.
Address correspondence to: Rukshana Shroff, PhD, Renal Unit, University College London Great Ormond Street Hospital for Children NHS Foundation Trust and Institute of Child Health, London WC1N 3JH, UK. E-mail: rukshana.shroff@gosh.nhs.uk
Additional Supporting Information may be found in the online version of this article.
Journal of Bone and Mineral Research, Vol. 36, No. 1, January 2021, pp 133–142.
DOI: 10.1002/jbmr.4158
© 2020 The Authors.Journal of Bone and Mineral Researchpublished by Wiley Periodicals LLC on behalf of American Society for Bone and Mineral Research (ASBMR)
133
n
are equal. In older adults, bone resorption predominates. This homeostatic balance between bone formation and resorption at different ages results in changes in the bone mineral balance (BMB) throughout life.(2)
In current clinical practice, serum Ca levels are our only tool for estimating BMB. However, serum Ca accounts for <0.1% of total body Ca, and due to tight negative feedback control, it cannot reflect the total body Ca.(1)Biomarkers lack specificity,(6)bone biopsies are highly invasive,(7)and radiological studies can take months or even years to show changes in bone mineral density (BMD).(8)Traditional Ca balance studies using radioisotopes or stable Ca isotopes have been performed but are highly demand- ing of participants and mainly limited to Ca absorption studies.(1,9–12)There is a need for markers of BMB that directly reflect changes in bone turnover, are easy to measure, safe, and reproducible. One such potential biomarker is natural Ca iso- tope fractions in serum and urine.
There are six naturally occurring stable (ie, non-radioactive) Ca isotopes (40Ca,42Ca,43Ca,44Ca,46Ca, and48Ca)(13–15)that are pre- sent in our diet, taken up in all parts of the body, and excreted in urine and feces.(16)Ca isotopes are sequestered in different body compartments at different rates depending on their atomic mass, following distinct rules of kinetic isotope fractionation;(17) fractionation refers to the physicochemical separation of heavier and lighter isotopes, which in turn results in the enrichment of one isotope relative to the other in at least two separate com- partments.(15)Isotopically light Ca is preferentially enriched dur- ing chemical transport reactions (for example, incorporation into bone), whereas the heavy isotope is preferentially excreted in urine and feces.(16,18–21)The ratio of Ca isotopes (for example, when studying42Ca and44Ca, the ratio would be expressed as δ44/42Ca) gives a direct function of the state of bone turnover.
Thus, when bone formation exceeds bone resorption and the net BMB is positive, theδ44/42Caserumisotope values are higher compared withδ44/42Caserumvalues measured under conditions when bone resorption is the predominant process. Ca isotope ratios in urine and feces reflect serum isotope values and are sim- ilarly high during bone formation and low during bone resorp- tion.(16,22) The relationship between Ca isotope fractions in serum and urine is described mathematically in a compartment model(16,18,19,21,23)
that in turn is used to quantitatively deter- mine net bone gain or loss of Ca.
As a proof-of-principle study, our group applied the natural Ca isotope fractionation technique in a healthy 4-year-old boy and a 60-year-old woman with osteoporosis.(18)The boy had a higher isotope ratio, indicating accumulation of isotopically light Ca in bones, whereas the older postmenopausal woman had a lower ratio, reflecting bone demineralization.(18) In a study in older women, those with osteoporosis confirmed by dual-energy X-ray absorptiometry (DXA) scan had significantly lower δ44/42Caserum and δ44/42CaUrine values compared with age- matched controls without osteoporosis.(19)The sensitivity of nat- ural Ca isotope fractionation measures has been further studied in animal models(14,17,24) and healthy adults,(16,20,22,23,25–28)
whereδ44/42Ca in serum and urine closely reflected the interven- tions to alter bone homeostasis.
We hypothesize that the natural Ca isotope fractionation method is a sensitive measure of BMB. We correlatedδ44/42Caserum andδ44/42Caurinewith currently used imaging measures of BMD as well as biomarkers of bone formation and resorption to evaluate δ44/42Caserumandδ44/42Caurineas novel biomarkers of BMB. Identi- fying a reliable biomarker of BMB will form the basis of future stud- ies investigating Ca dynamics in disease states and in response to
treatments such as steroids and antiresorptive therapy that can alter bone homeostasis.
Materials and Methods
This is a prospective cross-sectional study performed at Great Ormond Street Hospital and Institute of Child Health, London, UK, and the GEOMAR Helmholtz Centre for Ocean Research Kiel, Kiel, Germany. Healthy children and adults younger than 40 years of age fulfilling all inclusion and exclusion criteria were recruited.
Inclusion and exclusion criteria
Inclusion criteria were children and young adults from birth to 40 years of age with normal renal function (estimated glomeru- lar filtration rate above 90 mL/min/1.73 m2 [calculated by the Schwartz formula(29)] in children >1 year of age and serum creat- inine <35 μMol/L in children <1 year) and weight, height, and body mass index (BMI) within 2 standard deviations (SDs) of nor- mal using World Health Organization (WHO) growth charts.
Exclusion criteria were subjects with any chronic illnesses, pre- existing bone disease (inherited or acquired), fractures in the preceding 6 months, any acute illness in the preceding 2 weeks (when the person is unable to maintain their usual diet or has bed rest) and those on glucocorticoid therapy (by any route) in the preceding year, or a lifetime cumulative steroid exposure of
≥6 months.
Recruitment
Pediatric participants were recruited from the siblings and friends of patients at Great Ormond Street Hospital and the chil- dren of staff members. In addition, otherwise healthy children who were undergoing minor surgical procedures for dermatol- ogy, ear/nose/throat, or plastic surgery were also included after careful screening for all inclusion and exclusion criteria. Young adults were recruited from the staff and their relatives and friends at University College London (n = 21) and women between 18 and 40 years who were part of the GeoOsteo-2016 study from Kiel (n= 30). Demographic details of the study popu- lation, their anthropometry, and biomarker profile is described in Supplemental Table S1. All participants and/or their caregivers provided informed written consent and assent as appropriate for their age. The study was approved by the local research ethics committees at both sites.
Study measures
Participants were asked to record a food-frequency question- naire before their study visit and bring in afirst morning urine sample and fecal sample on the day of the study visit. The study visit included anthropometric measures, blood sampling, and radiological tests.
Dietary Ca intake
Dietary Ca intake was assessed in a subgroup of 57 participants (30 young adults and 27 children and their parents/caregivers) who provided complete food diaries/questionnaires for assess- ment. There was no difference between the subjects in whom die- tary Ca intake was assessed versus those in whom it was not based on their age, sex, race, or anthropometric measures. Children com- pleted a prospective 3-day food diary as previously described,(30)
and Ca content was assessed with a software program (CompEat Pro Nutrition Systems; www.compeat.co.uk). A semiquantitative, self-administered food-frequency questionnaire was used to assess the dietary calcium intake of the adults.(31)
Anthropometry and Tanner staging
Height and weight were measured and expressed as absolute values as well as standard deviation score (SDS) for age and sex in participants under 18 years of age.(32)Pubertal staging was determined by the children or their caregivers with a self- reported Tanner staging questionnaire.(33)
Serum biomarkers
Ca isotopes, routine serum biomarkers, and markers of osteo- blastic and osteoclastic activity were measured. Samples were frozen at−80C, thawed only at the time of measurement, and all biomarkers were assayed in the same batch.
Ca isotope measurements
Approximately 250μL serum, 1000μL urine, and 100 mg feces were used for analysis. Full details of the Ca isotope measure- ments have been previously described(19)and are summarized in the Supplemental Materials and Methods.
Routine serum biomarkers
Total calcium, ionized calcium, phosphate, magnesium, bicar- bonate, alkaline phosphatase (ALK), intact parathyroid hormone (PTH; Immulite 2000, Siemens Healthcare Diagnostics, Camber- ley, UK) and 25-hydroxyvitamin D ([25OHD]; isotope-dilution liq- uid chromatography–tandem mass spectrometry, Waters Xevo TQ-S, Waters, UK) were measured in the Chemical Pathology lab at Great Ormond Street Hospital.
Bone biomarkers
Bone biomarkers of osteoblastic (bone-specific alkaline phos- phatase [BAP] and N-terminal propeptide of type I collagen [P1NP]) and osteoclastic (C-terminal telopeptide of type I colla- gen [CTX]) activity were measured by commercially available ELI- SAs per manufacturers’ instructions (details in Supplemental Materials and Methods). Because smaller volumes of serum were available for some children, a variable number of the different biomarkers were measured; details are provided in the respec- tive Figures as well as in Supplemental Table S1.
Radiological assessment
Radiological assessment was performed in a subgroup of chil- dren older than 5 years based on parental consent and ability to stay still for the procedure and 20/21 adults studied at Univer- sity College London. DXA and peripheral quantitative computed tomography (pQCT) were performed in 20 and 42 children, respectively. None of the participants in the GeoOsteo-2016 study from Kiel had any radiological imaging. There was no dif- ference between the subjects who underwent radiological imag- ing and those who did not in their age, sex, race, or anthropometric measures.
Dual-energy X-ray absorptiometry
DXA of hip and lumbar spine were performed on the Lunar Prod- igy Advance (GE Healthcare, Madison, WI, USA) by trained
radiographers according to the manufacturer’s protocol and International Society for Clinical Densitometry guidelines.(34) Lumbar spine areal BMD (aBMD) measurements obtained in g/cm2were corrected for growth and converted to bone mineral apparent density (BMAD) Z-scores for participants under 20 years old, providing age-, sex-, and race-specificZ-scores.(35) For the purposes of this analysis, lumbar spine BMADZ-scores for young adults were calculated assuming a maximum age of 20 years. There was no significant difference between reported aBMDZ-scores and BMADZ-scores for the young adults.
Peripheral quantitative computed tomography
pQCT scan of the nondominant tibia was performed using the XCT2000 (Stratec Medizintechnik GmbH, Pforzheim, Germany) scanner as previously described.(36,37)Images were acquired at the 3% metaphyseal and 38% diaphyseal site for trabecular and cortical volumetric BMD (g/cm3), and expressed as age-, height-, sex-, and race-adjustedZ-scores (cf. Denburg and col- leagues(38)). Tibial cortical BMD measured by pQCT was shown to predict fracture risk in children and young adults(39)and was used as the“gold standard”for assessing bone mineralization in this study.
Calculations for dietary Ca isotope content: Theδ44/42Cadiet values were calculated from the average Ca intake (in grams per day from the food diary or food-frequency questionnaire that the subjects reported), the relative contribution of dairy and non-dairy products, and published values of the Ca isotope fractions in different foods.(40,41)Dairy products show the highest Ca concentrations (~500 mgCa/100 g), hence are the main source for Ca in a regular European diet followed by vegetables (~100 mgCa/100 g), fruits (~20 mgCa/100 g), crop products (~35 mgCa/100 g), meat (~10 mgCa/100 g), fat (~7 mgCa/100 g), and water (~5 mgCa/100 g). The Ca isotopic composition (δ44/42Ca) of dairy and non-dairy products in the European diet were previ- ously estimated to be approximately −0.58‰ and−0.31‰, respectively.(40,41) Theδ44/42Cadietvalues were calculated from the weighted average of the daily consumption of dairy and non-dairy products as follows:
δ44/42Diet=Xδ44/42CaDairy+ (1−X)δ44/42CaNon−dairy (where X is the relative amount of dairy products in the daily diet; (1–X) is the daily amount of the non-dairy products).
Based on this equation, the medianδ44/42Cadietvalues were
−0.46 (−0.49 to −0.41)‰ in children and−0.40 (−0.45 to
−0.39)‰in adults (Supplemental Table S1), with higher values in adults reflecting their proportionately lower dairy intake.
Within our cohort, the Ca isotopic composition of the British and German adult subjects was comparable (p= 0.082), pointing to the low variations in the Ca isotope composition of the diet.
None of the participants were on any Ca supplements.
Statistical analysis: All variables were assessed for normality.
Continuous variables are presented as median and interquartile range (IQR) and categorical variables as frequency and percent- age. Comparisons of continuous variables between groups were performed using Mann–Whitney or Kruskal-Wallis tests as appro- priate. Independentttesting was used for between-group ana- lyses. Categorical variables were compared using chi-square or Fisher’s exactttest. The relationships between continuous vari- ables were assessed by linear regression. A stepwise multivari- able linear regression model was constructed with tibial cortical BMDZ-score on pQCT as the dependent variable, and covariates were included ifp< 0.15 on univariable analyses. A p value of <0.05 (two-sided) was considered statistically
Journal of Bone and Mineral Research CALCIUM ISOTOPE RATIOS IN BODY COMPARTMENTS 135
n
significant. Statistics were performed using SPSS 24.0 (IBM Corp., Armonk, NY, USA) and graphs constructed using GraphPad (La Jolla, CA, USA) Prism (version 8.3).
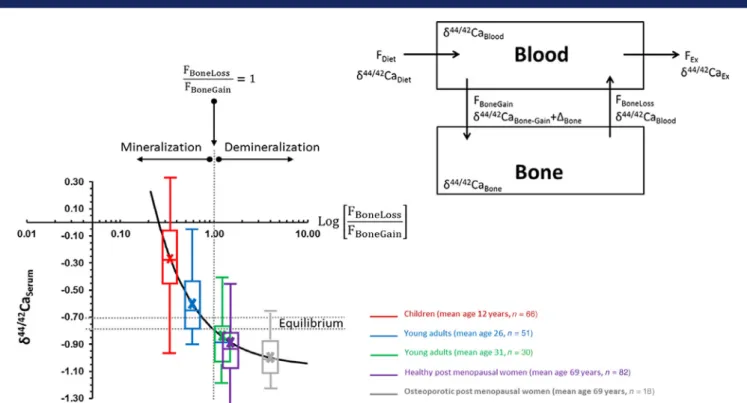
Ca isotope model: We interpret and discuss our data with ref- erence to a Ca isotope balance model(19)that is based on the simple and universal principles that all isotopes follow: immuta- bility of isotopes in natural systems, mass-dependent isotope fractionation, and the conservation of mass during chemical pro- cesses.(42,43)Isotope ratios only change as a function of variations in the balance between elemental input and output from a com- partment. In the Ca balance model (Fig. 5, inset), the parameters are: (i) FDietandδ44/42CaDiet, Caflux and isotope composition of dietary Ca entering the body; (ii) FBone-Gainandδ44/42CaBone-Gain, Caflux from the blood to the bone and its Ca isotope composi- tion; (iii) FBone-Lossandδ44/42CaBone-Loss, Caflux out of the bone and its isotope composition; (iv) Fexandδ44/42Caex, Caflux and isotope composition of the excreted Ca from the organism; and (v)ΔBone, which reflects the Ca isotope fractionation during Ca deposition in the bone during mineralization.ΔBonehas been shown to be fairly constant in the order of about−0.3‰in sev- eral different vertebrate species, including chickens, horses,
“Göttingen”mini-pigs, and humans, and is independent of the absolute Ca isotope values in blood and bone.(14,21,24,44)
The model (Fig. 5) shows a nonlinear relationship of theδ44/42CaBlood value to the Ca balance between bone absorption and resorption expressed by the ratio of skeletal Ca loss flux relative to the skeletal Ca gainflux (FBone-Loss/FBone-Gain). Importantly, the equilib- rium value for bone Ca absorption and resorption (FBone-Loss/ FBone-Gain= 1) can be estimated from basic mass balance princi- ples to correspond to the sum of the Ca isotope value of the diet (δ44/42CaDiet) and the isotope fractionation value between blood and bone (ΔBone):δ44/42CaDiet+ΔBone.
Results
Baseline characteristics
A total of 66 children (ages 0.7 to 17.8 years, median 13 years) and 51 adults (ages 18 to 40 years, median 28 years) participated in the study. Supplemental Table S1 describes their demo- graphics and anthropometry. None of the participants reported bone pain or fractures. Three adults used vitamin D supplements (all had normal 25OHD levels) and none of the participants took calcium supplements.
Dietary Ca intake
The median daily Ca intake and the relative contribution from dairy products was calculated (Supplemental Table S1). Estima- tion ofδ44/42Cadietis based on previously measured values of Ca isotope fractions in dairy and non-dairy products in the West- ern European diet.(18,40,41)The medianδ44/42Cadietvalues were
−0.46‰ in children (n = 27) and−0.40‰ in adults (n = 30;
p= 0.013; Fig. 1), with higher values in adults reflecting their pro- portionately lower dairy intake. From the known Ca isotope com- position, the Ca isotope equilibrium value between Ca absorption and resorption can then be calculated to be:
δ44/42CaDiet +ΔBone=−0.46‰+−0.3‰ = ~−0.76 ‰ based on theδ44/42CaDietof children or to be about−0.70‰based on the adultδ44/42CaDietvalue. Eleven participants who were vita- min D deficient (25OHD concentration below 25nMol/L) had the lowest δ44/42Caserum levels irrespective of their Ca intake.
There was no correlation between the Ca intake from dairy and serum or urineδ44/42Ca levels.
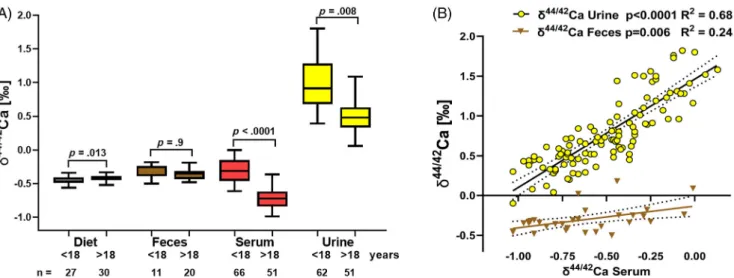
Ca isotope fractions in different body compartments The δ44/42Ca levels measured in serum (n = 66 children and 51 adults), urine (n = 62 children and 51 adults), and feces (n= 11 children and 20 adults) are shown in Fig. 1Aand Supple- mental Table S1, along with the calculated values forδ44/42Cadiet. Children had significantly higherδ44/42Ca levels in both serum and urine compared with adults (p < 0.0001 and p = 0.008, respectively). There was no difference inδ44/42Cafecesbetween children and adults (p= 0.9, Fig. 1A). There was a strong correla- tion between δ44/42Ca in serum and urine in all patients (p< 0.0001, R2= 0.68; Fig. 1B), suggesting that Ca isotope levels in serum and urine are closely interdependent. A significant but weaker correlation was found between δ44/42Ca in serum and feces (p= 0.006, R2= 0.24; Fig. 1B).
Ca isotope fractions and growth
To test our hypothesis thatδ44/42Ca levels in serum and urine are a sensitive measure of BMB, we explored the associations betweenδ44/42Ca levels and age, height, and Tanner stage as sur- rogate measures of bone growth in the pediatric population. In the overall cohort, there was a strong inverse correlation between age andδ44/42Caserum(p< 0.0001, R2= 0.43; Fig. 2A), which was more marked in females (p< 0.0001, R2= 0.53) com- pared with males (p = 0.02, R2 = 0.13). Similar findings were found betweenδ44/42Caurineand age (Supplemental Fig. S1).
When theδ44/42Caserumlevels were examined in children and adults separately, in children there was no association between age andδ44/42Caserum(p= 0.43), whereas an inverse correlation was found in adults (p = 0.0015; Supplemental Fig. S2A, B).
However, in children, a strong positive correlation was found between height Z-score and δ44/42Caserum in boys under 18 years (p< 0.001, R2= 0.65), but there was a non-significant trend in girls (p= 0.07, R2= 0.10; Fig. 2B). Given that children were of variable ages at the time of study and that peak height velocity is reached at different ages, we explored the association between Tanner stage and δ44/42Caserum. Both boys and girls showed significantly higherδ44/42Caserumat Tanner stage 4 com- pared with stage 5 (p= 0.01 andp= 0.03, respectively; Fig. 2C).
There was no significant correlation betweenδ44/42Caurineand height or Tanner stage.
Ca isotope fractions and biomarkers of bone formation and resorption
There was no correlation between total serum Ca or ionized Ca levels andδ44/42Caserum(p= 0.61 andp= 0.26, respectively). In contrast, serum 25OHD concentrations showed a strong positive correlation withδ44/42Caserum(p< 0.0001, R2= 0.37; Fig. 3A). An inverse correlation was found betweenδ44/42Caserumand PTH, p= 0.03, R2= 0.13; Fig. 3B). Biomarkers of bone formation (ALK [p= 0.009, R2= 0.06] and BAP [measured inn= 89;p< 0.0007, R2= 0.18]) positively correlated withδ44/42Caserum(Fig. 3C,D).
Similar correlations were found betweenδ44/42Caurineand ALK and PTH (Supplemental Fig. S3). There was no significant correla- tion betweenδ44/42Caserumand CTX or P1NP levels (measured in n= 89 each;p= 0.8 andp= 0.67, respectively) or the CTX/P1NP ratio (p= 0.08).
Ca isotope fractions and radiological measures
In children, DXA hip Z-score positively correlated with serum δ44/42Ca levels (n= 20;p= 0.02, R2= 0.18), but no significant cor- relation was found betweenδ44/42Caserumand any DXA measures in adults (n= 20;p= 0.23 andp= 0.07, respectively).
In children (n= 42) and adults (n= 20), both the tibial cortical and trabecular BMDZ-scores measured by pQCT showed a pos- itive correlation with δ44/42Caserum (p < 0.001, R2 = 0.39 and p= 0.003, R2= 0.16, respectively; Fig. 4A,B), indicating increasing bone mineral content. This was further confirmed by a positive correlation between the total bone mineral contentZ-score and δ44/42Caserum(p= 0.005, R2= 0.29; Fig. 4C), implying increasing BMD as bone Ca content increases. When these data were ana- lyzed separately for children and adults, the tibial cortical BMD Z-scores and total bone mineral contentZ-score remained signif- icantly positively correlated with δ44/42Caserum in children and
adults, but the trabecular BMDZ-scores showed only a weak pos- itive correlation in adults (Supplemental Table S2).δ44/42Caurine
levels showed a similar correlation with the trabecular BMD and total bone mineral contentZ-scores (Supplemental Fig. S4).
Multivariable linear regression analysis showed that signifi- cant and independent predictors of tibial cortical BMDZ-score wereδ44/42Caserum (p= 0.004, β= 0.37), 25-hydroxyvitamin D (p= 0.04,β= 0.19), and PTH (p= 0.03,β=−0.13). These variables together predicted 76% of the variability in tibial cortical BMDZ- score. There were no significant predictors of DXA hipZ-score on multivariable analysis.
Discussion
In this study, we have shown that the naturally occurring Ca iso- tope ratio in serum is a significant and independent predictor of Fig 1. (A) Ca isotope ratios expressed asδ44/42Ca (‰) in diet (calculated values) and feces, serum, and urine (measured values) in children (age range 5 to 18 years) and young adults (18 to 40 years of age). Boxes mark the 25th and 75th quartiles, the horizontal line marks the median, and whiskers mark the 1% and 99% limits of the data. Unpairedttests compare between-group differences, and significance values are shown on the graph.δ44/42Ca of serum and urine values of the <18 group is significantly higher than for the >18 group. (B)δ44/42Caserum(‰) shows a strong correlation withδ44/42Caurineand δ44/42Cafeces, indicating the close interdependency based on the Ca balance model (Fig. 5, inset). A similar but less pronounced correlation was found betweenδ44/42Caserumandδ44/42Cafeces. Dotted lines show 95% confidence intervals.
Fig 2. (A) In the overall cohort, there was an inverse association between age andδ44/42Caserumin both males and females. (B) In children, a positive correlation was found betweenδ44/42Caserumand heightZ-score that reached statistical significance in males only. (C) In both boys and girls,δ44/42Caserum
was highest at Tanner stage 4 compared with stage 5.
Journal of Bone and Mineral Research CALCIUM ISOTOPE RATIOS IN BODY COMPARTMENTS 137
n
BMB and may be a novel biomarker of bone mineralization in children and young adults. These data need to be evaluated in larger groups of children and adults with bone-related diseases
to determine the utility of Ca isotopic ratios as potential tools for the diagnosis, therapeutic monitoring, and prognosis of bone mineralization disorders.
Fig 3.Correlation ofδ44/42Caserum(‰) with biomarkers of bone formation (A) 25-hydroxyvitamin D [25(OH)D], (C) alkaline phosphatase (ALK), and (D) bone-specific alkaline phosphatase (BAP), and bone resorption (B) parathyroid hormone (PTH).
Fig 4. Correlation ofδ44/42Caserum(‰) with bone densitometry markers on peripheral quantitative computed tomography scan of the tibia in 62 partic- ipants (42 children older than 5 years and 20 adults). Tibial cortical densityZ-score (A), trabecular densityZ-score (B), and total bone mineral content Z-score (C) showed significant correlations withδ44/42Caserum, confirming an increase in bone mineral density as bone Ca content increases.
Ca balance in the human body is primarily controlled by the exchange of Ca between blood and bone and to a lesser extent by Ca isotope fractionation duringfiltration and reabsorption by the kidneys. Bone is a dynamic organ and continuously replaced through remodeling, resulting from the coupled actions of bone- forming cells (osteoblasts) and bone-resorbing cells (osteo- clasts). There are two critical Cafluxes, one from the blood to the bone (FBoneGain) and the other from bone to the blood (FBoneLoss; Fig. 5, inset). The precipitation of bone mineral is an incomplete kinetic reaction involving a preferential uptake of the lighter Ca isotope into bone, depleting blood of light Ca iso- tope. Bone resorption releases this isotopically light Ca back into the blood. Thus, when BMB is positive (ie, FBoneGain> FBoneLoss) δ44/42Caserum is relatively high, and when BMB is negative (FBone-Loss> FBone-Gain),δ44/42Caserumis relatively low. The Ca iso- tope composition of blood and bone always differs by about
−0.3‰across different animal species, so that δ44/42Caboneis reflected byδ44/42Caserum, just offset by−0.3‰; this value is sim- ilar throughout a number of vertebrate species and is a basic characteristic of bone mineral precipitation.(45)
The variations in Ca isotope fractions in the blood are reflected in urine as both are strongly interdependent. The Ca isotopic composition of urine reflects the separation (ie, fractionation) of light (42Ca) and heavy (44Ca) Ca isotopes during the process offiltration and reabsorption in the renal tubules. The Ca isotope fractionation occurs as the primary urine forms, is reabsorbed by tubules, and then againfiltered, with fraction between the reab- sorbed and excreted fraction (also called secondary urine). In contrast, the Ca isotopic composition of the feces is influenced
by the fractionation of Ca isotopes from the diet, with the lighter isotope (42Ca) absorbed into the blood and the heavier isotope (44Ca) excreted in the feces. In addition, the Ca content of diges- tivefluids, of yet unknown Ca isotope composition, which also go through cycles of secretion and reabsorption, may affect the Ca isotopic composition of the feces. Also, the Ca isotopic com- position of the diet does not have a significant influence on the serum δ44/42Caserum because only a small fraction (~20% to 30%) of dietary Ca is absorbed from the gastrointestinal tract, and this contributes only about 5% to the daily Ca turnover.
Based on these very different processes influencing the Ca isoto- pic composition of urine and feces, no correlation between die- tary, fecal, and urinary Ca isotopic compositions can be expected.
The above principles of Ca isotope fractionation are confirmed in our cohort of healthy children and young adults. We show that the growing skeleton of children avidly absorbs calcium with the highest δ44/42Ca serum and urine values in children under 18 years (Fig. 5). Phases of rapid growth in childhood and adoles- cence are critical periods for bone mineral accrual: In healthy individuals, the Ca content of the skeleton increases from
~25 g at birth to ~1000 to 1200 g in adults.(4,11)However, bone mineral accretion continues into the 30s, when peak bone mass (the amount of bone acquired at the end of skeletal develop- ment) is reached.(4)Thus, as shown in Fig. 5, the Ca isotope ratios show a significant inverse correlation with age, reflecting the rel- ative predominance of bone mineralization or demineralization at different ages. Based on compartment model calculations,(19) the relatively high Ca isotope values in young people are
Fig 5. In healthy individuals, the serum Ca isotope composition (δ44/42CaBlood) depends on age from childhood (mean age 12 years), young adulthood (mean ages 26 and 31 years in two cohorts), as well as healthy and postmenopausal women (mean ages 69 years for both). Modeling indicates an equi- librium value (FBoneLoss/FBoneGainratio) between 0.7 and 0.76‰(gray dotted lines). The more positive values of younger subjects are above the equilibrium value, indicating a positive Ca balance (FBoneLoss/FBoneGainratio > 1) and increasing skeletal mass. In contrast,δ44/42CaBloodvalues below the equilibrium values indicate a negative Ca balance (FBoneLoss/FBoneGainratio < 1) and skeletal demineralization with a net loss of bone mass.
Journal of Bone and Mineral Research CALCIUM ISOTOPE RATIOS IN BODY COMPARTMENTS 139
n
reflected by a FBoneLoss/FBoneGainratio of ~0.4, which means that 2.5 times more Ca is accumulated in the bones than lost by bone resorption. In contrast, as shown in our earlier work,(19)osteopo- rotic women show a FBoneLoss/FBoneGainratio of ~3, indicating that the Ca loss from bone is three times higher than the Ca uptake from the blood. Furthermore, Fig. 5 shows that at the age of about 30 years, the skeletal gain and loss of Ca are in equilibrium (FBoneLoss/FBoneGain~ 1), at aδ44/42Caserumvalue of about−0.8‰. This value, within statistical uncertainties, is in agreement with the estimated value of about 0.7 to 0.77‰based on the theoret- ical principles of isotope mass balance and simplified model assumptions described in Materials and Methods. From Fig. 5, it is shown that for the cohort of young adults, theδ44/42Caserum
value is in the range of−0.72 to−0.8‰, falling within the equi- librium range. This reflects the average age when peak bone mass is achieved(4)and there is no further net gain or loss of Ca from the skeleton. Lower values for δ44/42Caserum, as found in healthy and osteoporotic postmenopausal women, reflect grad- ual age-related bone resorption, leading to a net loss of Ca. In contrast, the higher values in children indicate net accumulation of Ca in the growing skeleton.
The rate of bone Ca accrual varies with age, pubertal status, linear growth, weight gain, and change in lean body mass. Our data show that children have a uniformly highδ44/42Ca serum and urine levels irrespective of age. Given that children in this cross-sectional study were of different pubertal stages and would have varying growth velocity,(46)we were able to show a stronger correlation ofδ44/42Caserumwith height, an indicator of skeletal size, as well as Tanner stage, rather than age. DXA studies have shown that the highest bone mineral accretion takes place in Tanner stages 4 or 5 when peak height velocity is reached(47):
~25% of total skeletal mass is laid down during the 2-year inter- val of attaining peak height velocity.(4)Given that the Ca isotope method is far more sensitive than X-ray densitometry,(8,19)we infer that during periods of very rapid bone growth, ie, in Tanner stage 5, there may be a lag between osteoid deposition and its mineralization.
Our study was designed to compare Ca isotope values against a wide range of currently available measures of bone mineral sta- tus, including bone densitometry and biomarkers in clinical and research practice. Of note, serum Ca and ionized Ca that are rou- tinely measured and used to assess Ca status and adjust medica- tion dosage did not show any correlation with δ44/42Caserum, implying that they do not reflect the bone turnover status. A poor correlation between DXA measures and δ44/42Caserum is explained by their different methodological approaches. DXA captures only a single area of the skeleton, cannot distinguish between cortical and trabecular bone and increased bone den- sity due to abnormal bone remodeling,(48) and radiological changes can take months to years to manifest a change.(8,49) pQCT provides a more sensitive measure of BMD—it provides volumetric density data in g/cm3and can distinguish between trabecular and cortical bone compartments independent of size of the subject.(49,50)pQCT is shown to predict fracture risk even in children.(38) We found thatδ44/42Caserum was a significant and independent predictor of tibial cortical BMDZ-score in children and young adults. However, pQCT is a research tool only—it requires expensive equipment that is not widely available, mea- surements are highly observer dependent, reference data are heterogenous,(49)and as with DXA, it provides information on only a single area of the skeleton. Biomarkers of osteoblastic and osteoclastic activity are easy to measure and relatively inex- pensive but can be affected by sex, age, body weight, circadian
rhythm, food intake, exercise, renal or liver function, and recent fractures.(51)Although these preliminary data show that Ca iso- tope ratios have a statistically significant correlation with bio- chemical markers, they have a minimal predictive value, perhaps because biomarkers are strongly influenced by pubertal stage. Thus, the predictive value of Ca isotope ratios at different stages of puberty needs to be studied in a larger cohort of healthy children. Importantly, bone mineralization is a dynamic process, but radiological and histological measures cannot pro- vide information on short-term changes in Ca status, such as with nutritional or pharmacological interventions. Ca isotope ratios give a “real-time” picture of the mineralization— demineralization fluxes of the whole skeleton, and serial mea- sures allow monitoring changes in response to a disease process or therapy.
Our data and inferences complete and extend earlier observa- tions that the Ca isotope ratio closely reflects the BMB. Heuser and colleagues induced pharmacological osteoporosis with glucocorticoids and vitamin D–deficient diets in Göttingen mini-pigs and showed that δ44/40Caurine closely reflected the interventions to change bone homeostasis.(24) In an effort to mimic bone demineralization in an anti-gravity environment, groups from NASA have studied healthy adult volunteers sub- jected to complete bed rest and showed a significant drop in δ44/42Ca in serum and urine starting by 10 days of initiating bed rest, correlating with markers of bone resorption.(21,22,28) Also, sensitivity of the Ca isotope fractionation technique in experiments comparing bed rest versus osteoclast inhibition with bisphosphonates has been shown.(16)Recently our group has shown that the Ca isotope composition of blood and urine of osteoporotic postmenopausal women is significantly lighter when compared with healthy postmenopausal women and corre- lated with DXA measures.(19)Finally, in a group of healthy young men, Rangarajan and colleagues showed an increase in Ca iso- tope ratios after 3 weeks of vitamin D supplementation.(27)Impor- tantly, these interventional studies have shown that Ca isotope ratios in blood and urine change within days in response to bone demineralization and therefore provide a sensitive tool to monitor disease processes or treatments that affect bone homeostasis.
Some limitations of our study must be acknowledged.
Because this is a cross-sectional study, we were unable to moni- tor height velocity and changes in Ca isotope ratios at different stages of growth. The numbers of subjects at each Tanner stage were very small, and self-reporting may have led to inaccuracies, particularly when distinguishing between Tanner stages 4 and 5. In addition, as bone turnover is closely related to sex hormones during puberty, further studies must include measures of sex hormones as part of the analysis. Different techniques for dietary Ca assessment were used for adults from Kiel as they formed part of a different study protocol; food-frequency questionnaire being retrospective in nature may underestimate or overesti- mate Ca intake.(30,52) We could not determine Ca absorption, which is strongly influenced by an individual’s vitamin D sta- tus.(53)Indeed, we found that participants who were 25OHD defi- cient had the lowestδ44/42Caserumlevels irrespective of Ca intake (confirmingfindings by Rangarajan and colleagues(27)); this may of course reflect 25OHD effects on bone, too,(54)and requires fur- ther study. The δ44/42Caurineshowed a significant albeit lower degree of correlation than with δ44/40Caserum with most mea- sures, likely due to individual changes in Ca isotope fractionation occurring in the kidneys as previously described.(18,22,55,56)
Importantly, our data suggest thatδ44/42Caserumis a more sensi- tive measure of BMB and must be measured in preference to
δ44/42Caurine, at least in children and young adults. Given that Ca isotope measures reflect real-time changes in bone homeostasis, repeated measurements have the potential to greatly improve monitoring the effects of medications on bone health compared with currently used X-ray densitometry or biomarkers; these studies are ongoing.
In summary, our data suggest that the naturally occurring sta- ble Ca isotope ratio in serum is a significant and independent predictor of BMB in children and young adults and are more accurate than currently used DXA or bone biomarkers in deter- mining BMD. Further studies are required to test the clinical util- ity of Ca isotopes as a novel biomarker in children and adults with diseases or treatments that affect bone health, such as renal failure, chronic childhood diseases affecting nutrition and growth, inherited bone diseases like osteogenesis imperfecta, physiological changes with age as with osteoporosis, effects of steroids, chemotherapy, and antiresorptive treatments, and prognostication of fracture risk in all of these conditions.
Disclosures
AE and AK part own Osteolabs company and receive an honorar- ium from Osteolabs. AE receives patent royalties from Geomar.
Acknowledgments
RS is funded by a National Institute for Health Research (NIHR), Career Development Fellowship for this research project. This publication presents independent research funded by the National Institute for Health Research (NIHR). The views expressed are those of the author(s) and not necessarily those of the NHS, the NIHR, or the Department of Health and Social Care.
A part of the work took place in the Biomedical Research Cen- tre at Great Ormond Street Hospital for Children NHS Foundation Trust and University College London.
AE acknowledges the support of the Helmholtz association and its“Helmholtz Impuls and Vernetzungsfond.”The GEOMAR Helmholtz Centre for Ocean Research, Kiel, Germany, is gratefully acknowledged forfinancial support.
Authors’ roles: Conceptualization: RS, AE, and CS. Funding acquisition: RS. Project administration: RS. Data curation: SS, AL, NG, and AR. Formal analysis: AK, AH, LM, DCF, MF, and LB. Supervision: RS and AE. Writing original draft: RS and AE. Writing review and editing: all authors.
Peer Review
The peer review history for this article is available at https://
publons.com/publon/10.1002/jbmr.4158.
References
1. Bushinsky DA. Contribution of intestine, bone, kidney, and dialysis to extracellularfluid calcium content. Clin J Am Soc Nephrol. 2010;5 (Suppl 1):S12–22.
2. Peacock M. Calcium metabolism in health and disease. Clin J Am Soc Nephrol. 2010;5(Suppl 1):S23–30.
3. Bailey DA, Martin AD, McKay HA, Whiting S, Mirwald R. Calcium accre- tion in girls and boys during puberty: a longitudinal analysis. J Bone Miner Res. 2000;15(11):2245–50.
4. Baxter-Jones AD, Faulkner RA, Forwood MR, Mirwald RL, Bailey DA.
Bone mineral accrual from 8 to 30 years of age: an estimation of peak bone mass. J Bone Miner Res. 2011;26(8):1729–39.
5. Teegarden D, Proulx WR, Martin BR, et al. Peak bone mass in young women. J Bone Miner Res. 1995;10(5):711–5.
6. Fischer DC, Mischek A, Wolf S, et al. Paediatric reference values for the C-terminal fragment offibroblast-growth factor-23, sclerostin, bone- specific alkaline phosphatase and isoform 5b of tartrate-resistant acid phosphatase. Ann Clin Biochem. 2012;49(Pt 6):546–53.
7. Bacchetta J, Harambat J, Cochat P, Salusky IB, Wesseling-Perry K. The consequences of chronic kidney disease on bone metabolism and growth in children. Nephrol Dial Transplant. 2012;27(8):3063–71.
8. Watts NB. Fundamentals and pitfalls of bone densitometry using dual-energy X-ray absorptiometry (DXA). Osteoporos Int. 2004;15 (11):847–54.
9. Abrams SA. Using stable isotopes to assess mineral absorption and utilization by children. Am J Clin Nutr. 1999;70(6):955–64.
10. Abrams SA. Calcium absorption in infants and small children:
methods of determination and recentfindings. Nutrients. 2010;2(4):
474–80.
11. Matkovic V, Heaney RP. Calcium balance during human growth: evi- dence for threshold behavior. Am J Clin Nutr. 1992;55(5):992–6.
12. O’Brien KO, Abrams SA. Using stable isotope tracers to study bone metabolism in children. J Physiol. 2019;597(5):1311–9.
13. DePaolo DJ. Calcium isotopic variations produced by biological, kinetic, radiogenic and nucleosynthetic processes. Rev Mineral Geo- chem. 2004;55(1):255–88.
14. Skulan J, DePaolo DJ. Calcium isotope fractionation between soft and mineralized tissues as a monitor of calcium use in vertebrates. Proc Natl Acad Sci U S A. 1999;96(24):13709–13.
15. Nielson LC, Yang W, Brown ST, DePaolo DJ. Calcium isotopes as tracers of biogeochemical processes. In Baskaran M, ed. Handbook of environmental isotope geochemistry. Berlin: Springer; 2011 pp 105–24.
16. Skulan J, Bullen T, Anbar AD, et al. Natural calcium isotopic composi- tion of urine as a marker of bone mineral balance. Clin Chem. 2007;53 (6):1155–8.
17. Reynard LM, Henderson GM, Hedges REM. Calcium isotope ratios in animal and human bone. Geochim Cosmochim Acta. 2010;74(13):
3735–50.
18. Heuser A, Eisenhauer A. A pilot study on the use of natural calcium isotope ((44)ca/ca-40) fractionation in urine as a proxy for the human body calcium balance. Bone. 2010;46(4):889–96.
19. Eisenhauer A, Muller M, Heuser A, et al. Calcium isotope ratios in blood and urine: a new biomarker for the diagnosis of osteoporosis.
Bone Rep. 2019;10:100200.
20. Morgan JLL, Skulan JL, Gordon GE, Romaniello SJ, Smith SM, Anbar AD. Using natural stable calcium isotopes to rapidly assess changes in bone mineral balance using a bed rest model to induce bone loss. FASEB J. 2012;26:244.1.
21. Morgan JLL, Skulan JL, Gordon GW, Romaniello SJ, Smith SM, Anbar AD. Rapidly assessing changes in bone mineral balance using natural stable calcium isotopes. Proc Natl Acad Sci USA. 2012;109(25):
9989–94.
22. Channon MB, Gordon GW, Morgan JLL, Skulan JL, Smith SM, Anbar AD. Using natural, stable calcium isotopes of human blood to detect and monitor changes in bone mineral balance. Bone.
2015;77:69–74.
23. Morgan JL, Zwart SR, Heer M, Ploutz-Snyder R, Ericson K, Smith SM.
Bone metabolism and nutritional status during 30-day head-down- tilt bed rest. J Appl Physiol. 2012;113(10):1519–29.
24. Heuser A, Eisenhauer A, Scholz-Ahrens KE, Schrezenmeir J. Biological fractionation of stable ca isotopes in Gottingen minipigs as a physio- logical model for ca homeostasis in humans. Isotopes Environ Health Stud. 2016;52(6):633–48.
25. Shackelford LC, LeBlanc AD, Driscoll TB, et al. Resistance exercise as a countermeasure to disuse-induced bone loss. J Appl Physiol. 1985;97 (1):119–29.
Journal of Bone and Mineral Research CALCIUM ISOTOPE RATIOS IN BODY COMPARTMENTS 141
n
26. Baecker N, Tomic A, Mika C, et al. Bone resorption is induced on the second day of bed rest: results of a controlled crossover trial. J Appl Physiol. 1985;95(3):977–82.
27. Rangarajan R, Mondal S, Thankachan P, Chakrabarti R, Kurpad AV.
Assessing bone mineral changes in response to vitamin D supple- mentation using natural variability in stable isotopes of calcium in urine. Sci Rep. 2018;8(1):16751.
28. Heuser A, Frings-Meuthen P, Rittweger J, Galer SJG. Calcium isotopes in human urine as a diagnostic tool for bone loss: additional evidence for time delays in bone response to experimental bed rest. Front Phy- siol. 2019;10:12.
29. Schwartz GJ, Munoz A, Schneider MF, et al. New equations to esti- mate GFR in children with CKD. J Am Soc Nephrol. 2009;20(3):629–37.
30. McAlister L, Pugh P, Greenbaum L, et al. The dietary management of calcium and phosphate in children with CKD stages 2–5 and on dialysis-clinical practice recommendation from the pediatric renal nutrition taskforce. Pediatr Nephrol. 2020;35(3):501–18.
31. Nothlings U, Hoffmann K, Bergmann MM, Boeing H. Fitting portion sizes in a self-administered food frequency questionnaire. J Nutr.
2007;137(12):2781–6.
32. Cole TJ. The LMS method for constructing normalized growth stan- dards. Eur J Clin Nutr. 1990;44(1):45–60.
33. Feingold D. Pediatric endocrinology. Atlas of pediatric physical diag- nosis. 2nd ed. Philadelphia: WB Saunders; 1992 pp 16–9.
34. ISCD. 2019 ISCD Official Positions—Pediatric. Available at: https://
www.iscd.org/official-positions/2019-iscd-official-positions- pediatric/. 2019. Accessed 2019 Dec 8.
35. Crabtree NJ, Shaw NJ, Bishop NJ, et al. Amalgamated reference data for size-adjusted bone densitometry measurements in 3598 children and young adults—the ALPHABET study. J Bone Miner Res. 2017;32 (1):172–80.
36. Binkley TL, Specker BL. pQCT measurement of bone parameters in young children: validation of technique. J Clin Densitom. 2000;3 (1):9–14.
37. Wetzsteon RJ, Kalkwarf HJ, Shults J, et al. Volumetric bone mineral density and bone structure in childhood chronic kidney disease.
J Bone Miner Res. 2011;26(9):2235–44.
38. Denburg MR, Tsampalieros AK, de Boer IH, et al. Mineral metabolism and cortical volumetric bone mineral density in childhood chronic kidney disease. J Clin Endocrinol Metab. 2013;98(5):1930–8.
39. Denburg MR, Kumar J, Jemielita T, et al. Fracture burden and risk fac- tors in childhood CKD: results from the CKiD cohort study. J Am Soc Nephrol. 2016;27(2):543–50.
40. Chu N, Henderson G, Hedges R. Ca isotope variations in modern die- tary systems and their potential to assess the importance of dairying in past cultures. Geophys Res Abstr. 2005;1:047426.
41. Chu NC, Henderson GM, Belshaw NS, Hedges REM. Establishing the potential of ca isotopes as proxy for consumption of dairy products.
Appl Geochem. 2006;21(10):1656–67.
42. Dauphas N, Schauble EA. Mass fractionation laws, mass-independent effects, and isotopic anomalies. Annu Rev Earth Planet Sci. 2016;44 (1):709–83.
43. Young ED, Galy A, Nagahara H. Kinetic and equilibrium mass- dependent isotope fractionation laws in nature and their geochemi- cal and cosmochemical significance. Geochim Cosmochim Acta.
2002;66(6):1095–40.
44. Skulan J, DePaolo DJ, Owens TL. Biological control of calcium isotopic abundances in the global calcium cycle. Geochim Cosmochim Acta.
1997;61(12):2505–10.
45. Bullen TD, Eisenhauer A. Metal stable isotopes in low-temperature systems: a primer. Elements. 2009;5(6):349–52.
46. Granados A, Gebremariam A, Lee JM. Relationship between timing of peak height velocity and pubertal staging in boys and girls. J Clin Res Pediatr Endocrinol. 2015;7(3):235–7.
47. Zemel BS, Kalkwarf HJ, Gilsanz V, et al. Revised reference curves for bone mineral content and areal bone mineral density according to age and sex for black and non-black children: results of the bone mineral density in childhood study. J Clin Endocrinol Metab. 2011;
96(10):3160–9.
48. Baim S, Wilson CR, Lewiecki EM, Luckey MM, Downs RW Jr, Lentle BC.
Precision assessment and radiation safety for dual-energy X-ray absorptiometry: position paper of the International Society for Clini- cal Densitometry. J Clin Densitom. 2005;8(4):371–8.
49. Lalayiannis AD, Crabtree NJ, Fewtrell M, et al. Assessing bone miner- alisation in children with chronic kidney disease: what clinical and research tools are available? Pediatr Nephrol. 2019;35(6):937–57.
50. Crabtree N, Ward K. Bone densitometry: current status and future perspective. Endocr Dev. 2015;28:72–83.
51. Eastell R, Pigott T, Gossiel F, Naylor KE, Walsh JS, Peel NFA. Diagnosis of endocrine disease: bone turnover markers: are they clinically use- ful? Eur J Endocrinol. 2018;178(1):R19–31.
52. Ortiz-Andrellucchi A, Henriquez-Sanchez P, Sanchez-Villegas A, Pena- Quintana L, Mendez M, Serra-Majem L. Dietary assessment methods for micronutrient intake in infants, children and adolescents: a sys- tematic review. Br J Nutr. 2009;102(Suppl 1):S87–117.
53. Shroff R, Wan M, Nagler EV, et al. Clinical practice recommendations for native vitamin D therapy in children with chronic kidney disease stages 2–5 and on dialysis. Nephrol Dial Transplant. 2017;32(7):
1098–113.
54. Shroff R, Knott C, Rees L. The virtues of vitamin D—but how much is too much? Pediatr Nephrol. 2010;25(9):1607–20.
55. Gussone N, Eisenhauer A, Heuser A, et al. Model for kinetic effects on calcium isotope fractionation (delta ca-44) in inorganic aragonite and cultured planktonic foraminifera. Geochim Cosmochim Acta. 2003;67 (7):1375–82.
56. Gussone N, Langer G, Thoms S, et al. Cellular calcium pathways and isotope fractionation in Emiliania huxleyi. Geology. 2006;34(8):625–8.
![Fig 3. Correlation of δ 44/42 Ca serum ( ‰ ) with biomarkers of bone formation (A) 25-hydroxyvitamin D [25(OH)D], (C) alkaline phosphatase (ALK), and (D) bone-speci fi c alkaline phosphatase (BAP), and bone resorption (B) parathyroid hormone (PTH).](https://thumb-eu.123doks.com/thumbv2/1library_info/5288804.1676741/7.892.126.759.82.624/correlation-biomarkers-formation-hydroxyvitamin-phosphatase-phosphatase-resorption-parathyroid.webp)