Pilot Study on Potential Impacts of Fisheries-Induced Changes in Zooplankton Mortality
on Marine Biogeochemistry
Julia Getzlaff1 and Andreas Oschlies1,2
1GEOMAR Helmholtz Centre for Ocean Research Kiel, Kiel, Germany,2Kiel University, Kiel, Germany
Abstract
In this pilot study we link the yield of industrial fisheries to changes in the zooplankton mortality in an idealized way accounting for different target species (planktivorous fish—decreased zooplankton mortality; large predators—increased zooplankton mortality). This indirect approach is used in a global coupled biogeochemistry circulation model to estimate the range of the potential impact of industrial fisheries on marine biogeochemistry. The simulated globally integrated response on phytoplankton and primary production is in line with expectations—a high (low) zooplankton mortality results in a decrease (increase) of zooplankton and an increase (decrease) of phytoplankton. In contrast, the local response of zooplankton and phytoplankton depends on the region under consideration:In nutrient-limited regions, an increase (decrease) in zooplankton mortality leads to a decrease (increase) in both zooplankton and phytoplankton biomass. In contrast, in nutrient-replete regions, such as upwelling regions, we find an opposing response: an increase (decrease) of the zooplankton mortality leads to an increase (decrease) in both zooplankton and phytoplankton biomass. The results are further evaluated by relating the potential fisheries-induced changes in zooplankton mortality to those driven by CO2emissions in a business-as-usual 21st century emission scenario. In our idealized case, the potential fisheries-induced impact can be of similar size as warming-induced changes in marine biogeochemistry.
1. Introduction
Over centuries higher trophic levels have been substantially depleted over large areas of the global ocean (e.g., whaling). This depletion of higher trophic levels has further intensified over the past decades via indus- trial fisheries. According to global fishery statistics maintained by the Food and Agriculture Organization of the United Nations (FAO), about 85 megatons (Mt) of fish are captured every year. However, it is known that this data set underestimates small-scale and subsistence fisheries (Zeller et al., 2015) and omits discarded by-catch (Zeller & Pauly, 2005), recreational fisheries, and otherwise unreported catches. Therefore, Pauly and Zeller (2016) suggest that these values may be substantially larger (up to 130 Mt). Overexploitation by fisheries has resulted in a drastic reduction of fish stocks and is also thought to have large impacts on biodiversity (Ellingsen et al., 2015). So far it is not clear whether this drastic modification of the upper end of the marine food chain has had, or will have, a significant impact on primary production and marine biogeochemistry.
A direct connection between fisheries and nutrient cycles is the removal of nutrients from the marine ecosystem. An annual removal of 85 Mt of fish corresponds to a removal of 2.3 Tg N per year from the ocean (Maranger et al., 2008), and the larger rate of 130 Mt of fish amounts to 3.4 Tg N per year. Estimated rates of nitrogen removal from the oceanic nutrient inventory via denitrification are 2 orders of magnitude larger.
The amount of phosphorus removed by commercial fisheries is small compared to the oceanic phosphorus inventory, but 0.05–0.07 Tmol P/y might be somewhat larger than the supply by weathering estimated, for example, by Wallmann (2010) as 0.03 Tmol P/y. Given the long residence time of several tens of thousands of years of phosphorus in the ocean, small changes in the sources and sinks have little impact on centennial time scales. Thus, the direct impact of fisheries on marine nutrient inventories is thought to be, so far, of minor importance.
Cascading effects in the ecosystem, on the other hand, do not only affect the composition of the zooplankton population, but may also affect lower trophic levels and eventually the nutrient cycles and thus biogeochem- istry. It has been suggested that a depletion of top predators can lead to reciprocal changes in the trophic
RESEARCH ARTICLE
10.1002/2017GB005721
Key Points:
• Potential fisheries-induced impact can be of similar size as warming-induced changes in marine biogeochemistry
• Globally integrated response is in line with a linear top-down control
• Regional response shows systematic differences depending on the local ecosystem dynamics
Correspondence to:
J. Getzlaff, jgetzlaff@geomar.de
Citation:
Getzlaff, J., & Oschlies, A. (2017), Pilot study on potential impacts of fisheries-induced changes in zooplankton mortality on marine biogeochemistry.Global Biogeo- chemical Cycles,31, 1656–1673.
https://doi.org/10.1002/2017GB005721
Received 18 MAY 2017 Accepted 10 OCT 2017
Accepted article online 18 OCT 2017 Published online 17 NOV 2017
©2017. American Geophysical Union.
All Rights Reserved.
layers below (Frank et al., 2005). Analysis of observations by Hutchings (2000) and Steele and Schumacher (2000) indicates that the time that is required for fish populations to recover is much longer than previously believed on the basis of single-trophic level biological parameters. This, in turn, indicates the existence of important feedback mechanisms (Bakun & Weeks, 2006). An example is the prey-to-predator loop, which describes the resulting ecosystem change after a decline of a top predator. Decreasing the predation pres- sure can result in an increase of the favored prey, which in turn often preys on the predator’s eggs and larvae (Bakun & Weeks, 2006). Myers and Worm (2003) show from observations that in the late 1990s the estimated amount of large predatory fish was only 10% of the preindustrial level.
While these observational studies focus on cascades within the upper trophic levels, model simulations allow a comprehensive assessment of a fisheries-induced ecosystem response. Fisheries models resolve interactions within the upper trophic levels, with zooplankton usually forming the lowest trophic level. Thus, interactions or feedback loops with the nutrient cycles are not generally included in such models. General biogeochemical circulation models, on the other hand, commonly comprise only the lower trophic levels in addition to bio- geochemical tracers. In these models, zooplankton represents the highest trophic level and generally includes one or two zooplankton compartments, which typically represent microzooplankton and mesozooplankton.
This simple approach neglects the explicit description of interactions with higher trophic levels as well as impacts of fishery pressure on lower trophic levels and, eventually, biogeochemical cycles. Still, the impact of the higher trophic levels is implicitly included in the closure term for energy and mass balance and is typically prescribed by a globally constant zooplankton mortality. These mortality terms are either linear, quadratic, or saturating with respect to the zooplankton biomass.
While zooplankton plays an essential role in linking phytoplankton and fish communities, it is a highly uncon- strained value. So far, most end-to-end model studies are only of regional nature (e.g., Ruzicka et al., 2016;
Travers-Trolet et al., 2014); thus, global-scale effects have generally been ignored. It is currently not clear how a global end-to-end approach should be built due to large regional ecosystem differences, although there are some ideas of how the zooplankton link could be configured to bridge the gap between marine biogeochemical and fisheries science for future scientific progress (Mitra et al., 2014).
To explore possible effects of fisheries on zooplankton and marine biogeochemistry in a global ocean bio- geochemistry circulation model, we choose an idealized approach by modulating the zooplankton mortality rate. The applied changes in this model parameter are derived from the observed fisheries yield. With this approach we are able to derive a first estimate of potential fisheries-induced impacts on marine biogeo- chemistry globally but avoid at the same time the as yet unresolved difficulties coming along with explicitly and mechanistically linking marine biogeochemistry with fisheries science in a global model. As models with multiple zooplankton compartments do not necessarily outperform models with single zooplankton compartments, even when zooplankton biomass data are assimilated (Friedrichs et al., 2007), we here use an Earth system model of intermediate complexity which contains a single zooplankton compartment.
To account for the large uncertainty in our understanding of possible fisheries-induced impacts on biogeo- chemistry, we mimic effects of fisheries targeting large predators as well as effects of fisheries targeting small (planktivorous) fish. Fishing pressure on large predators might result in a decrease of the feeding pressure on small (planktivorous) fish, which in turn can lead to an increase of the feeding pressure on zooplankton.
To mimic such a scenario, we increase the zooplankton mortality in experiment HIGH. On the other hand, fishing pressure on small fishes could result in a reduced feeding pressure on zooplankton. In experiment LOW, we mimic this scenario by decreasing the zooplankton mortality. To further assess the importance of potential impacts of fisheries-induced changes on marine biogeochemistry, we relate the results derived from changes in zooplankton mortality rates to effects resulting from impacts of global warming-induced circula- tion and stratification changes simulated in a business-as-usual Representative Concentration Pathway (RCP) 8.5 CO2emission scenario for the 21st century.
The paper is organized as follows: Section 2 describes the numerical model and the setup of the sensitivity studies. In section 3 we present the model results, and section 4 provides a summary and conclusions.
2. Model
In this paper we use the University of Victoria (UVic) Earth System Climate model (Weaver et al., 2001) version 2.9, which is an Earth system model of intermediate complexity. The model includes a three-dimensional primitive- equation global ocean model (Pacanowski, 1995), a single-layer atmospheric energy-moisture balance model
(based on Fanning & Weaver, 1996), a dynamic-thermodynamic sea ice model, a simple marine ecosystem model (Keller et al., 2012), and an active terrestrial vegetation and carbon cycle model. All model components use a horizontal resolution of 1.8∘latitude×3.6∘longitude. The vertical grid of the oceanic component has 19zlevels with a thickness of 50 m near the surface increasing to 500 m at depth.
The spin-up time is 11,000 years until equilibrium is reached under preindustrial atmospheric CO2. A detailed description of the model setup is given in Keller et al. (2012). The ocean model comprises isopycnal mixing with a globally constant isopycnal diffusion coefficient of 1,200 m2s−1and the Gent and McWilliams (1990) parameterization to include the effect of eddy-induced tracer transport. In all experiments reported here, we use the improved tropical ocean physics as described in Getzlaff and Dietze (2013) where the zonal isopycnal diffusion coefficient is increased by 50,000 m2s−1in the equatorial region between 5∘S and 5∘N in order to mimic the effect of the unresolved equatorial intermediate current system. The standard model configuration is forced by monthly climatological NCAR/NCEP wind stress fields.
2.1. The Biogeochemical Model
The biogeochemical model is a NPZD-type model with nutrients, phytoplankton, zooplankton, and detritus.
The model has two dissolved inorganic nutrient compartments, nitrate and phosphate. Fixed Redfield ratios are used to link nitrogen, carbon, oxygen, and phosphorus. The model comprises two phytoplankton compartments, one representing nitrogen-ixing phytoplankton (diazotrophs) and the other one represent- ing all non-nitrogen-fixing phytoplankton types. The former is not limited by nitrate, whereas the latter is limited by nitrate and phosphate. Iron limitation is simulated with a seasonally varying iron mask to con- strain the growth of diazotrophic and nondiazotrophic phytoplankton. The model has one zooplankton compartment, and zooplankton graze on phytoplankton, themselves, and detritus. The fraction of prey biomass that is converted into biomass, respired, excreted, or lost to detritus is determined by the growth and assimilation efficiency terms. Zooplankton mortality produces detritus and is described in this model by a quadratic mortality term (mz⋅Z2), whereZdenotes zooplankton andmzthe zooplankton mortality parameter [(mmol N/m3)−1d−1]. The full model equations including all sinks and sources are given in Keller et al. (2012).
2.2. Sensitivity Experiments
The zooplankton mortality parameter is a highly unconstrained parameter, which cannot easily be validated against observations. Hence, the variety of parameter values used in the literature is rather large with vari- ations of 1 order of magnitude or more. The zooplankton mortality mimics the impact of all higher trophic levels on zooplankton. In this model we use a quadratic mortality term (mz⋅Z2), and the mortality rate is given bymz⋅Z. As we focus on the possible top-down impact of fisheries on biogeochemistry, we estimate fisheries effects on zooplankton mortality and then assume that the model explicitly resolves the top-down effects on phytoplankton and biogeochemical tracers. So far the link between fisheries yield and zooplankton mortality is not fully understood. Models that could help to comprehensively resolve this link are to be developed.
Thus, we choose to follow an idealized approach in this pilot study: In general, the energy transfer between trophic levels is thought to be about 10% (Pauly & Christensen, 1995). Thus, considering a minimum impact of this energy transfer, we have to account for changes in the zooplankton biomass which are at least 10 times larger compared to the fishery yield of 2.3–3.4 Tg N/y; thus, the integrated change in zooplankton predation (F) should be of the order of 30 Tg N/y. According to the quadratic mortality term used in this model, changes in the zooplankton mortality parameter derived from the fishery yield are given by ΔmZ=F∕∑
i,j,k(Z2⋅Δx⋅Δy⋅Δz). We use the steady state three-dimensional zooplankton biomass field of the reference simulation for this estimate. A change in the zooplankton mortality parameter mz of 0.03 (mmol N/m3)−1d−1would in this case mimic a global fishery yield of about 3.4 Tg N, which is close to the observed estimate. Figure 1 gives an overview how the global fishery yield is distributed by showing the estimated change in the zooplankton mortality rate in the surface layer for (a) the winter months (December–February) and (b) the summer months (June–August). These maps can only be used as a first plausibility test, as a complete validation is, so far, not possible due to the lack of global maps of the fisheries yield. Areas of largest change in simulated zooplankton mortality roughly represent the areas of intense fishing, such as the equatorial upwelling regions, the North Atlantic, and the upwelling regions in the Southern Ocean.
To assess the possible biogeochemical implications resulting from commercial fisheries, we compare different formulations to account for possible impacts of changes in fishing pressure on zooplankton mortality: (i) REF starts in year 0 with constant preindustrial atmospheric CO2concentrations, and the zooplankton mortality
0°E 60° 120° 180° 120° 60°W 60°S
30°
0°
30°
60°N
0°E 60° 120° 180° 120° 60°W
60°S 30°
0°
30°
60°N
0 0.005 0.01 0.015 0.02 0.025 0.03 0.035 0.04
0 0.005 0.01 0.015 0.02 0.025 0.03 0.035
(a) (b) 0.04
day-1 day-1
Figure 1.Estimated change of the zooplankton mortality rate (day−1) in the surface layer: (a) average of the winter months (December–February) and (b) average of the summer months (June–August), experiment HIGH minus REF (see text).
parameter equals 0.06 (mmol N/m3)−1d−1. (ii) In HIGH we apply a sudden increase of the zooplankton mor- tality parameter to 0.09 (mmol N/m3)−1d−1in year 0 and constant thereafter; otherwise the setup is identical to REF. (iii) In LOW we set the zooplankton mortality parameter to 0.03 (mmol N/m3)−1d−1in year 0, which is the only change compared to REF (see also Table 1).
In a second set of experiments we assess the importance of possible fisheries-induced changes in the zooplankton mortality on biogeochemistry relative to impacts by warming-induced circulation and stratifi- cation changes driven by anthropogenic CO2emissions. In all emission experiments we start from steady state and apply anthropogenic CO2emissions according to the RCP 8.5 business-as-usual scenario from year 1800 to the end of the 21st century. In REFemit, the zooplankton mortality parameter is kept constant at 0.06 (mmol N/m3)−1d−1. In the two sensitivity experiments, HIGHemit and LOWemit, we further assume that the impact of fisheries in the nineteenth century is negligible but has significantly increased during the twentieth century and remains static afterward. The zooplankton mortality parameter in HIGHemit is kept constant at 0.06 (mmol N/m3)−1d−1between 1800 and 1900 and increases linearly between 1900 and 2000 from 0.06 (mmol N/m3)−1d−1 to 0.09 (mmol N/m3)−1 d−1. From 2000 onward the zooplankton mortality parameter is again kept constant at 0.09 (mmol N/m3)−1d−1. In LOWemit, the zooplankton mortality param- eter also stays constant at 0.06 (mmol N/m3)−1d−1between 1800 and 1900 but decreases linearly between 1900 and 2000 from 0.06 (mmol N/m3)−1d−1to 0.03 (mmol N/m3)−1d−1. From 2000 onward the zooplankton mortality parameter is kept constant at 0.03 (mmol N/m3)−1d−1. An overview of all simulations used in this study is given in Table 1.
With our pragmatic approach, we estimate the possible magnitude of the potential impact of industrial fisheries on marine biogeochemistry. The changes applied in this study are a simplification of very com- plex processes occurring in the oceanic ecosystem. Thus, there are several sources of uncertainty including insufficient information about global fisheries, the lack of numerical models representing higher trophic levels Table 1
Summary of All Model Simulations
Zooplankton mortality parameter
Simulation (mmol N/m3)−1d−1 Forcing
REF 0.06 PreindustrialpCO2, starts in year 0, climatological winds
HIGH 0.09 PreindustrialpCO2, starts in year 0, climatological winds
LOW 0.03 PreindustrialpCO2, starts in year 0, climatological winds
REFemit 0.06 RCP 8.5 CO2emissions (1800–2100, starts from spin-up),
climatological winds
HIGHemit 0.06 until 1900, linearly increasing to 0.09 until 2000, RCP 8.5 CO2emissions (1800–2100, starts from spin-up),
0.09 from 2000 onward climatological winds
LOWemit 0.06 until 1900, linearly decreasing to 0.03 until 2000, RCP 8.5 CO2emissions (1800–2100, starts from spin-up),
0.03 from 2000 onward climatological winds
0.255 0.26 0.265 0.27 0.275 0.28
EP [mol N m−2y−1]
2.08 2.1 2.12 2.14 2.16 2.18 2.2 2.22
remin. detritus [Gt N y−1]
50 100 150 200 250 300
90 92 94 96
zooplankton biomass [Tg N]
time [years]
50 100 150 200 250 300
time [years]
50 100 150 200 250 300
time [years]
50 100 150 200 250 300
time [years]
50 100 150 200 250 300
time [years]
(a) (b) (c)
(d) (e)
REF HIGH LOW
76 78 80 82 84
phytoplankton biomass [Tg N]
9 9.2 9.4 9.6 9.8
NPP [Gt N y−1]
Figure 2.Annual averages of the (a) globally integrated zooplankton biomass[Tg N], (b) globally integrated phytoplankton biomass [Tg N], (c) globally averaged export production across 125 m [mol N m−2y−1], (d) globally integrated remineralized detritus in the upper 125 m [Gt N y−1], and (e) globally integrated net primary production [Gt N y−1].
on a global scale, and the lack of knowledge about the link between fisheries and zooplankton mortality as well as possibly compensating effects among higher trophic levels. These uncertainties presently limit any comprehensive assessment of the potential impact of fisheries on marine biogeochemistry.
3. Results
3.1. Sensitivities of Global Plankton Stocks to Simulated Fisheries Impacts Under Preindustrial Conditions
The response of the globally integrated plankton stocks to our idealized simulation of fisheries impacts is shown in Figure 2. An increase of the zooplankton mortality rate in HIGH results in a decrease of the globally integrated zooplankton biomass (Figure 2a). This leads to a decrease of the feeding pressure on phytoplankton and, in turn, to an increase of the globally integrated phytoplankton biomass (Figure 2b). On the other hand, a decrease of the mortality rate in LOW results in an increase of the globally integrated zooplankton biomass and a decrease of the globally integrated phytoplankton biomass. To this end, the global response corresponds to the assumption of a linear food chain.
The changes in zooplankton biomass have further implications on the ecosystem: An increase of the zooplankton mortality rate in HIGH results in an initial increase of detritus in the surface layer and leads to an increase of the export production (decrease in LOW, Figure 2c). The initial increase of detritus in the surface layers in HIGH leads further to an initial increase in detritus remineralization in the upper 125 m (initial decrease in LOW, Figure 2d). This holds only for very few years. Detritus remineralization in HIGH decreases with time to values that are eventually lower than in experiment REF (higher for LOW). In line with the changes of the phytoplankton biomass we also find an initial increase of the globally integrated net primary production (NPP) of phytoplankton in HIGH and an initial decrease in LOW (Figure 2e). Already after 4 years, however, NPP in HIGH becomes lower than in REF (larger in LOW). Note that this temporal change of NPP is not proportional to the temporal change of phytoplankton biomass. This already indicates regional variations in the fisheries- induced changes in phytoplankton and hence productivity, which will be investigated below.
3.2. Regional Patterns of Simulated Fisheries-Induced Changes
In the preindustrial spun-up steady state of REF the globally integrated zooplankton biomass amounts to 92.9 Tg N, of which 41.3 Tg N can be found in the tropics (between 20∘S and 20∘N), 23.7 Tg N in the Southern Ocean (between 40∘S and 90∘S), 12.1 Tg N in the middle to high latitudes of the Northern Hemisphere (between 40∘N and 90∘N), 8.9 Tg N in the midlatitudes of the Southern Hemisphere (between 20∘N and 40∘N),
50 100 150 200 250 300 5.6
5.8 6 6.2 6.4
NPP [Gt N y−1]
time [years]
50 100 150 200 250 300
1.42 1.44 1.46 1.48 1.5 1.52 1.54 1.56
remin. detritus [Gt N y−1]
time [years]
50 100 150 200 250 300
0.295 0.3 0.305
EP [mol N m−2y−1]
time [years]
50 100 150 200 250 300
0.31 0.32 0.33 0.34 0.35 0.36 0.37 0.38
EP [mol N m−2y−1]
time [years]
50 100 150 200 250 300
39 40 41 42 43 44
zooplankton biomass [Tg N]
time [years]
50 100 150 200 250 300
0.23 0.24 0.25 0.26 0.27 0.28 0.29
remin. detritus [Gt N y−1]
time [years]
Southern Ocean Tropics
(a)
(b)
(c)
(d)
(e)
(f)
(g)
(h)
(i)
(j)
REF HIGH LOW
50 100 150 200 250 300
23 23.2 23.4 23.6 23.8 24 24.2 24.4
zooplankton biomass [Tg N]
time [years]
50 100 150 200 250 300
20 21 22 23 24 25
phytoplankton biomass [Tg N]
time [years]
50 100 150 200 250 300
1.3 1.35 1.4 1.45 1.5 1.55
NPP [Gt N y−1]
time [years]
50 100 150 200 250 300
34 34.5 35 35.5 36
phytoplankton biomass [Tg N]
time [years]
Figure 3.Southern Ocean (south of 40∘S) and the tropics (between 20∘S and 20∘N): (a, f ) integrated zooplankton biomass [Tg N]; (b, g) integrated phytoplankton biomass [Tg N]; (c, h) averaged export production across 125 m [Gt N y−1]; (d, i) globally integrated remineralized detritus in the upper 125 m [Gt N y−1]; and (e, j) globally integrated net primary production [Gt N y−1]. All curves show annual mean values.
and 6.8 Tg N in the midlatitudes of the Northern Hemisphere (between 20∘N and 40∘N). In the following we focus on the tropics and the Southern Ocean, as the impact of the northern hemispheric middle-latitude to high-latitude changes as well as changes in the midlatitudes is of minor importance with respect to the global integral.
3.2.1. Southern Ocean
Figures 3a–3e show the integrated response in the Southern Ocean to changes in the zooplankton mortality.
The adaptation time in the Southern Ocean to the applied changes is very short (<1 year). Although mortality- induced changes in the zooplankton biomass are small (∼3%, which amounts to 0.7 Tg N), the annual mean zooplankton biomass in the higher-mortality simulation HIGH is, somewhat counterintuitively, larger com- pared to REF (and vice versa in LOW) and stays constant with time after an initial adjustment period of a few months (Figure 3a). The increase of the zooplankton biomass in HIGH results in an increase of the export production (∼11%, Figure 3c) and an increase in the remineralization of detritus in the upper 125 m (∼13%, Figure 3d). Furthermore, we find an increase of phytoplankton biomass (∼10%, Figure 3b) in HIGH. This leads to an increase of NPP (∼9%, Figure 3e). In LOW the reduced zooplankton biomass decreases export produc- tion as well as the remineralizion of detritus in the upper layer. NPP in LOW is lower compared to REF, which is in line with the smaller phytoplankton biomass. Note that changes in zooplankton biomass are of opposite sign compared to the globally integrated response (Figure 2). Moreover, changes in zooplankton and phyto- plankton biomass have the same sign in the Southern Ocean (Figure 3b); that is, both increase in HIGH and both decrease in LOW.
To investigate the reasons for this response of enhanced plankton biomass resulting from an increase in zooplankton mortality, we start by examining the models ecosystem behavior right after the step change in mortality: Figures 4a–4c show the vertically integrated (a) zooplankton and (b) phytoplankton biomass directly after increasing the zooplankton mortality rate and Figures 4d–4f a month later. In the Southern Ocean we find, as we would expect, an initial decrease of the zooplankton biomass in HIGH (Figure 4a).
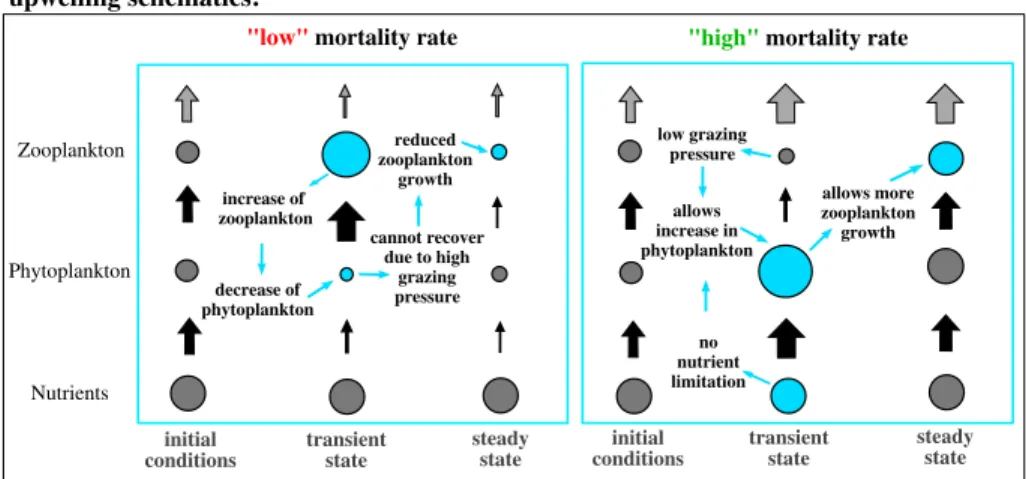
The increase in zooplankton mortality reduces the top-down pressure on phytoplankton. In the upwelling regions, where nutrient limitation is not an issue, this temporal release from grazing pressure allows the phytoplankton to bloom as described in Evans and Parslow (1985) and shown in Figure 4b. This expected linear food web response holds only during the first month. Only a few weeks later, we find also an increase in zooplankton biomass in response to increased food supply over wide areas of the Southern Ocean reaching values larger than in the reference simulation (Figure 4c). In addition, Figure 4d shows that phytoplankton biomass increases further, although there is enhanced zooplankton grazing pressure. In summary, the ini- tial increase in zooplankton mortality in HIGH is followed by an increase in phytoplankton biomass and a subsequent increase in zooplankton biomass, constituting a positive response.
Nutrient-rich areas, such as the equatorial upwelling regions or those in the Southern Ocean, are gen- erally characterized by persistently low phytoplankton stocks and high nutrient concentrations (see, e.g., Boyd, 2002). General phytoplankton limitation by iron and specific limitation of diatoms by silicate have been both hypothesized as regulating processes for new production in these areas (Coale, Fitzwater, et al., 1996; Coale, Johnson, et al., 1996; Dugdale & Wilkerson, 1998; Dugdale et al., 1995, 2007). While there is no consensus about these suggested limiting processes, there is consistent evidence that a close coupling of phytoplankton growth and grazing losses to zooplankton is necessary to regulate the community struc- ture (Dugdale et al., 2011; Frost & Franzen, 1992; Lundry et al., 1997; Morel et al., 1991), which has also been confirmed by observations (Landry et al., 2011). Figures 4c and 4d show the changes in the surface nitrate concentrations. Particularly in the Southern Ocean, the uptake of nitrate increases when phytoplankton increases. In our model simulations, nitrate is never depleted in the Southern Ocean; thus, it does not control phytoplankton growth.
The stepwise change in zooplankton mortality disrupts the top-down control of zooplankton grazing on phytoplankton growth. A decrease of the zooplankton mortality drives an initial increase of zooplankton which in turn triggers an increased grazing pressure on phytoplankton, thereby reducing phytoplankton con- centrations (for illustration see schematics in Figure 5, left). Once reduced, the lower phytoplankton fails to sustain the elevated zooplankton population which, as a consequence, declines. Eventually, this shifts the system into a state where zooplankton biomass is reduced because their food has become more sparse.
In contrast, an increase of the zooplankton mortality results in an initial decrease of the grazing pres- sure on phytoplankton and in turn to an increase of phytoplankton (Figure 5, right). This increase drives
60°S 30°
0°
30°
60°N
− 0.02
− 0.015
− 0.01
− 0.005 0 0.005 0.01 0.015 0.02
Phytoplankton 60°S
30°
0°
30°
60°N
− 0.01
− 0.005 0 0.005 0.01
Zooplankton
0°E 60° 120° 180° 120° 60°W
0°E 60° 120° 180° 120° 60°W
0°E 60° 120° 180° 120° 60°W
0°E 60° 120° 180° 120° 60°W
0°E 60° 120° 180° 120° 60°W
0°E 60° 120° 180° 120° 60°W
60°S 30°
0°
30°
60°N
− 0.01
− 0.005 0 0.005 0.01
Zooplankton
60°S 30°
0°
30°
60°N
− 0.01
− 0.005 0 0.005 0.01
Phytoplankton
(a)
(b)
(d)
8th of January, firstyear after mortaltity change 17th of February, first yearafter mortality change
HIGH-REF HIGH-REF
HIGH-REF HIGH-REF
60°S 30°
0°
30°
60°N
− 0.15
− 0.1
− 0.05 0 0.05 0.1 0.15
60°S 30°
0°
30°
60°N
− 1
− 0.5 0 0.5 1
(c)
(e)
(f)
HIGH-REF Nitrate HIGH-REF
Nitrate
Figure 4.Map of changes (HIGH-REF) of vertically integrated (a, d) zooplankton biomass [mmol N m−2], (b, e) phytoplankton biomass [mmol N m−2] for two different times, and of (c, f ) surface nutrients [mmol N m−3] 1 week (Figures 4a–4c) and 6 weeks (Figures 4d–4f ) after applying the mortality changes.
an increase in zooplankton, and the emerging state of the ecosystem is one with elevated zooplankton and phytoplankton biomass.
These results are supported theoretically in section A1 where we reduce the full three-dimensional ecosystem model used in UVic 2.9 to a simplified zero-dimensional model version representing the main aspects of nutrient-replete upwelling regions. The analytical solution of the biological model equations (Figure A1a) con- firms that in steady state zooplankton and phytoplankton biomass are elevated with increasing zooplankton mortality.
3.2.2. Tropics
Figures 3f–3j show the integrated response in the tropics to changes in the zooplankton mortality rate.
The integrated zooplankton biomass decreases in HIGH to 38 Tg N (−7%) and increases in LOW to 45 Tg N (+9%, Figure 3f ). After the initial increase in phytoplankton biomass in HIGH (Figure 3g), we find a monotonic decrease with time, and after 8 years the values become lower than those of REF. In experiment LOW, on the other hand, we find an initial decrease in phytoplankton biomass followed by a monotonic increase with time, with phytoplankton biomass eventually exceeding that of REF. Similar responses are found for the temporal change in export production (Figure 3h) and the remineralization of detritus (Figure 3i), with larger (lower)
Zooplankton
Phytoplankton
Nutrients
initial conditions
cannot recover due to high
grazing pressure
"low" mortality rate
steady state increase of
zooplankton
"high" mortality rate
decrease of phytoplankton
reduced zooplankton
growth
upwelling schematics:
transient state
steady state no
nutrient limitation allows increase in phytoplankton
allows more zooplankton
growth low grazing
pressure
transient state initial
conditions
Figure 5.Schematics of response to changes in the zooplankton mortality in nutrient-replete upwelling regions.
The size of circles represents biomass and black arrows the fluxes between the trophic levels. The gray arrows in the top level represent the measure of the top-down control capacity.
initial values in HIGH (LOW) compared to REF, decreasing with time to eventually reach values lower (higher) than those of REF after 8 (respectively 20) years. Changes in phytoplankton NPP (Figure 3j) are generally linked to changes in phytoplankton. The tropics are the region with the largest share of global NPP.
Although phytoplankton biomass in HIGH is, in the tropics, larger than REF during the first few years, NPP in HIGH decreases with time and is lower compared to REF throughout the whole simulation (Figure 3j). In LOW, on the other hand, we find an increase of NPP with time and larger values compared to REF. Figure 6 shows large regional differences in the near steady state response in the tropics to a change in zooplankton mortality in the model. In particular, the response in nutrient-limited regions has the opposite sign compared to that in the nutrient-replete upwelling regions and therefore partly cancel in the overall impact in the integrated response shown in Figure 3. These results indicate that the response in the nutrient-deplete tropics is trig- gered by a different feedback mechanism compared to the positive feedback of NPP and plankton biomass to enhanced zooplankton mortality identified for nutrient-replete upwelling regions.
In the nutrient-limited regions, a decrease of the zooplankton mortality results in an initial increase of zooplankton biomass (Figures 3f and 6b), simply because less zooplankton is dying. Furthermore, grazing on phytoplankton increases, which results in a reduction of phytoplankton biomass (Figures 3g and 6d).
Surprisingly, phytoplankton can recover, although we do not change the mortality pressure on zooplankton.
In the first years after the change, the increase in zooplankton biomass also results in a decrease of the rem- ineralized detritus in the upper layers (Figure 3i), and we further find a decrease in the export production (Figure 3h). This indicates that nutrients are trapped in the surface layer. In nutrient-limited regions an impor- tant nutrient source in the surface layers is provided by remineralization of organic matter (e.g., Eppley &
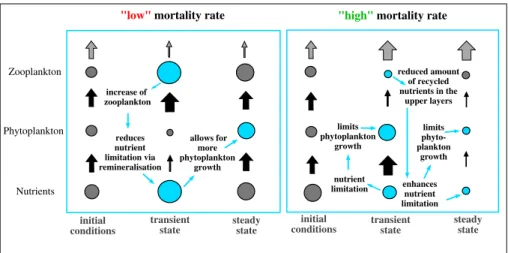
Bruce, 1979), which is the sum of detritus and excretion. An increase in zooplankton biomass also results in enhanced excretion, so that the amount of recycled nutrients, provided by remineralization of detritus and excretion by zooplankton, is larger compared to REF (Figure 7). This reduces the nutrient limitation (Figure 6f ) and in turn allows for an increase in phytoplankton growth (see also Figure 8, left) and further results in an increase of zooplankton biomass compared to REF (in the schematics in Figure 8 REF is represented by the initial conditions). An increase of the zooplankton mortality reduces the grazing pressure on phytoplankton.
As nutrients are limited in these regions phytoplankton growth is limited, although the grazing pressure is reduced. The reduction of zooplankton biomass reduces the amount of recycled nutrients in the upper layers (Figure 7) and thus enhances nutrient limitation in these regions and furthermore limits phytoplankton growth (Figure 8, right). In summary, the increase in zooplankton mortality in HIGH is followed by a decrease in zooplankton biomass, a decrease in nutrient recycling, and a decrease in phytoplankton biomass.
In section A2 we show the results for the simplified zero-dimensional model version, which has been derived from the full three-dimensional ecosystem model used in UVic 2.9 representing the main aspects of nutrient-limited regions and also showing a decline of phytoplankton and zooplankton biomass with increasing zooplankton mortality.
0°E 60° 120° 180° 120° 60°W
0°E 60° 120° 180° 120° 60°W
0°E 60° 120° 180° 120° 60°W
0°E 60° 120° 180° 120° 60°W
0°E 60° 120° 180° 120° 60°W
0°E 60° 120° 180° 120° 60°W
60°S 30°
0°
30°
60°N
−0.4
−0.3
−0.2
−0.1 0 0.1 0.2 0.3 0.4
Zooplankton
60°S 30°
0°
30°
60°N
−0.8
−0.6
−0.4
−0.2 0 0.2 0.4 0.6 0.8
Phytoplankton
60°S 30°
0°
30°
60°N
−0.4
−0.3
−0.2
−0.1 0 0.1 0.2 0.3 0.4
Zooplankton
60°S 30°
0°
30°
60°N
−0.8
−0.6
−0.4
−0.2 0 0.2 0.4 0.6 0.8
Phytoplankton HIGH-REF
HIGH-REF
LOW-REF
LOW-REF
(a) (b)
(c) (d)
60°S 30°
0°
30°
60°N
−3
−2
−1 0 1 2 3
60°S 30°
0°
30°
60°N
−30
−20
−10 0 10 20
(e) 30
HIGH-REF Nitrate
LOW-REF
(f)
Nitrate
Figure 6.Map of changes after 300 years. Vertically integrated annual mean zooplankton biomass [mmol N m−2]: (a) HIGH-REF and (b) LOW-REF. Vertically integrated annual mean phytoplankton biomass [mmol N m−2]: (c) HIGH-REF and (d) LOW-REF. Annual mean surface nitrate concentration [mmol N m−3]:
(e) HIGH-REF and (f ) LOW-REF.
The adaptation time in the tropics is much longer compared to the one in the Southern Ocean. The fast adap- tation timescale in the Southern Ocean is controlled by changes in the coupled pools of zooplankton and phytoplankton, as phytoplankton growth and zooplankton grazing need to be in balance to reach a new equilibrium. These changes are forced by a change in the top-down control (zooplankton mortality) and do not depend on transport or recycling processes (no nutrient limitation). The resulting response in phytoplankton growth and zooplankton grazing happen on very short timescales; hence, the adaptation time is short as well. In nutrient-limited regions the response is mainly determined by the recycling of nutrients, which is directly related to changes in the zooplankton biomass as well as to changes in the export production.
The initial changes in the amount of recycled nutrients are small with a decrease by−0.7% in HIGH and an increase by +0.6% in LOW compared to REF and slowly increase with time to−7.9% in HIGH and +10.1%
in LOW (after 300 years). Thus, in nutrient-limited regions the initial ecosystem response to these changes is small as well and increases slowly with time.
3.3. Response Under Climate Change Projection
To further evaluate the impact of the simulated effects of zooplankton mortality changes on the nutrient cycle, we relate the results to a warming-driven response by applying the RCP 8.5 business-as-usual CO2
50 100 150 200 250 300 4
4.1 4.2 4.3 4.4 4.5
4.6 REF
HIGH LOW
Figure 7.Annual averages of the globally integrated amount of recycled nutrients (remineralization of detritus and excretion) in the upper 125 m [Gt N y−1] in the tropics (between 20∘S and 20∘N).
emission scenario. Figure 9 (left column) shows a warming-induced declin- ing trend in the global integral of primary production, export production, and phytoplankton and zooplankton biomass in REFemit. Only the globally integrated remineralization of detritus reaches end-of-century values that are very close to those at the beginning of the century. On a regional scale we find that warming-induced changes in the tropics correspond to the decline of the globally integrated fields (Figure 9, right column), whereas all variables show an increasing trend under global warming in the Southern Ocean (Figure 9, middle column).
The results of experiments HIGHemit and LOWemit show further that changes in the zooplankton mortality rate can mask the warming-induced response in all variables until the present day. As long as the zooplank- ton mortality parameter changes with time according to our 21st century fisheries-informed estimate of changes in zooplankton losses, the impact of these changes on biomass (zooplankton and phytoplankton), export production, remineralized detritus, and NPP are larger than the simulated warming-induced changes. When the zooplankton mortality parameter is kept constant at levels corresponding to REF, HIGH, and LOW from the year 2000 onward, this relation changes, so that changes in biomass and export production are driven by the CO2-induced warming; therefore, the relative changes in REFemit, HIGHemit, and LOWemit during the 21st century are almost identical. The relative change (%) between preindustrial and present is summarized in Table 2 for all simulations.
3.4. Impact on Oxygen
Dissolved oceanic oxygen is important for marine life and furthermore a sensitive indicator for physical and biological processes in the ocean. Air-sea fluxes of oxygen are determined by essentially the same physical processes as for CO2, but in contrast to CO2, burning of fossil fuels induces only negligible changes in atmo- spheric concentrations that are 3 orders of magnitude larger than those of CO2. Thus, changes in marine oxygen concentration provide information about physical and/or biological processes such as ventilation, mode water formation, and upwelling or biological export and respiration. Although recent observational estimates show a declining trend of tropical oxygen levels during the past decades (Helm et al., 2011;
Schmidtko et al., 2017; Stramma et al., 2012), Earth system models in general fail in reproducing the observed trends in tropical oxygen levels (e.g., Cabré et al., 2015; Oschlies et al., 2017). In the following we investigate to what extent changes in top-down pressures can have an impact on global oxygen and the volume of oxygen-deficient waters, as well as on their evolution under global warming.
Zooplankton
Phytoplankton
Nutrients
nutrient-limited schematics:
initial conditions
allows for more phytoplankton
growth
"low" mortality rate
steady state increase of
zooplankton
reduces nutrient limitation via remineralisation
"high" mortality rate
nutrient limitation limits phytoplankton
growth
reduced amount of recycled nutrients in the
upper layers
enhances nutrient limitation limits phyto- plankton
growth
transient state
steady state transient
state initial
conditions
Figure 8.Schematics of response to an increase in the zooplankton mortality in nutrient-limited regions. The size of circles represents biomass and black arrows the fluxes between the trophic levels. The gray arrows in the top level represent the measure of the top-down control capacity.
1950 2000 2050 1.38
1.4 1.42 1.44 1.46 1.48 1.5
remin. detritus [Gt N y−1]
time
1950 2000 2050
0.24 0.245 0.25 0.255 0.26 0.265 0.27
EP [mol N m−2y−1]
time
1950 2000 2050
8.7 8.8 8.9 9 9.1 9.2 9.3 9.4
NPP [Gt N y−1]
time
1950 2000 2050
2.1 2.12 2.14 2.16 2.18
remin. detritus [Gt N y−1]
time
1950 2000 2050
74 75 76 77 78 79 80 81
phytoplankton biomass [Tg N]
time
1950 2000 2050
82 84 86 88 90 92 94
zooplankton biomass [Tg N]
time
Global Southern Ocean Tropics
a)
b)
c)
d)
e)
REFemit HIGHemit LOWemit
1950 2000 2050
23.5 24 24.5 25 25.5 26
zooplankton biomass [Tg N]
time
1950 2000 2050
21 22 23 24 25 26 27
phytoplankton biomass [Tg N]
time
1950 2000 2050
0.24 0.26 0.28 0.3 0.32 0.34
remin. detritus [Gt N y−1]
time
1950 2000 2050
1.4 1.5 1.6 1.7 1.8
NPP [Gt N y−1]
time
1950 2000 2050
0.32 0.34 0.36 0.38 0.4 0.42
EP [mol N m−2y−1]
time
1950 2000 2050
34 36 38 40 42
zooplankton biomass [Tg N]
time
1950 2000 2050
30 31 32 33 34
phytoplankton biomass [Tg N]
time
1950 2000 2050
0.24 0.25 0.26 0.27 0.28 0.29
EP [mol N m−2a−1]
time
1950 2000 2050
5.2 5.4 5.6 5.8 6
NPP [Gt N y−1]
time
Figure 9.Annual averages of the (a) integrated zooplankton biomass [Tg N] for the global ocean (left column), the Southern Ocean (middle column), and the tropics (right column), (b) integrated phytoplankton biomass [Tg N], (c) averaged export production across 125 m [mol N m−2y−1], (d) integrated remineralized detritus in the upper 125 m [Gt N y−1], and (e) integrated net primary production [Gt N y−1].
The Southern Ocean with its formation sites of deep, intermediate, and mode waters plays an important role in the oxygen supply to the global ocean (Downes et al., 2011; Getzlaff et al., 2016; Keller et al., 2016; Liu &
Wu, 2012). Changes in the surface boundary conditions, such as changes in the wind fields or CO2-induced changes in the surface buoyancy fluxes, affect the supply of oxygen. In addition, changes in remineralization and phytoplankton via photosynthesis have an impact on oxygen. As the circulation in all three sensitivity simulations is identical, changes in the global oxygen inventory simulated here result only from differences in the biology caused by the manipulated zooplankton mortality rate.
Table 2
Change (in %) Between Preindustrial (1800) and Present (2017)
Global Southern Ocean Tropics
REFemit HIGHemit LOWemit REFemit HIGHemit LOWemit REFemit HIGHemit LOWemit
Zooplankton −3% −6% 1% 2% 5% −1% −5% −10% 2%
Phytoplankton −2% 1% −5% 3% 15% −9% −4% −5% −1%
Export production −4% −1% −7% 3% 15% −9% −7% −8% −5%
Remineralized detritus −1% −1% 0.3% 6% 18% −7% −2% −4% 1%
NPP −2% −4% 2% 5% 14% −4% −3% −8% 3%
Figure 10a shows that the response in the global oxygen inventory to changes in the zooplankton mortality are very small (0.4%). The larger zooplankton and phytoplankton biomass in HIGH compared to REF in the Southern Ocean results in a larger export production, which drives a larger remineralization with an enhanced oxygen consumption. Although export and remineralization fluxes adjust on annual time scales and stay con- stant thereafter (Figure 3), the continuous production of deep and intermediate water masses in the Southern Ocean is responsible for the temporal decrease of the global oxygen inventory. In LOW the increase of the global oxygen inventory is driven by the lower export production compared to REF.
In response to the CO2-induced warming the globally integrated marine oxygen inventory of 256.6 Pmol decreases in REFemit by 4.8% (Figure 10b). This decrease is only 4.3% in LOWemit and reached 5.3% in HIGHemit. Note that for observed and estimated future increases in the southern hemispheric westerly winds, an earlier sensitivity study found a similar magnitude in the simulated change in marine oxygen inventory (Getzlaff et al., 2016) as the estimated fisheries-induced changes simulated by experiment LOWemit.
Local changes in export production can also have a significant impact on suboxic water volumes. Although the oxygen inventory is increasing in LOW, the suboxic volume, here defined as water hosting less than 10 mmol O2m−3, on timescales of>50 years, is larger (Figure 10b) compared to REF, whereas the suboxic vol- ume in HIGH is decreasing and lower. The initial response is opposite to the response on centennial timescales.
This is directly related to the changes of the amount of remineralized detritus in the suboxic volume.
0 50 100 150 200 250 300
5 5.2 5.4 5.6 5.8 6 6.2 6.4
suboxic volume [m3] x 1015
time [years]
REF HIGH LOW
50 100 150 200 250 300
256 256.5 257 257.5
O2 [Pmol]
time [years]
REF HIGH LOW
a)
1900 1950 2000 2050 2100
242 244 246 248 250 252 254 256
O2 [Pmol]
time [years]
REFemit HIGHemit LOWemit
1900 1950 2000 2050 2100
5 5.5 6 6.5 7 7.5 8
suboxic volume [m3] x 1015
time [years]
REFemit HIGHemit LOWemit
c)
b) d)
Figure 10.Globally integrated oxygen inventory [Pmol]: (a) steady state simulations and (b) climate change projection. Pacific suboxic volume, here defined as water hosting less than 10 mmol O2m−3: (c) steady state simulations and (d) climate change projection.
Figure 10d shows that the suboxic volume of the Pacific Ocean in HIGHemit is larger during most of the 21st century by about 10% compared to REFemit, whereas it is lower by a slightly larger amount in LOWemit.
4. Summary and Conclusions
In this study we examine possible effects of fisheries on phytoplankton, zooplankton, and nutrient cycles in a global biogeochemistry circulation model. So far, global coupled biogeochemical general circulation mod- els do not explicitly resolve interactions and cascading downscale effects driven by changes in higher trophic levels. Implicitly, such effects are generally included via the zooplankton mortality parameter. To mimic fish- eries effects, we modulate the zooplankton mortality parameter in a set of sensitivity simulations with the amplitude of the perturbation estimated from fisheries yields in a conservative way, that is, assuming short food chains and an efficient energy transfer from zooplankton to fish. Such an estimate is affected by various uncertainties. These include possible compensating effects among higher trophic levels, the lack of global fisheries information, and the lack of knowledge about the link between fisheries and zooplankton mortality.
The results of our idealized approach can serve as a first order-of-magnitude estimate of the potential impacts of fisheries on marine biogeochemistry. Our results also show that the closure term representing higher trophic levels in typical biogeochemical models should be treated carefully as relatively small vari- ations may lead to important and sometimes counterintuitive responses in the explicitly resolved lower trophic levels.
The results suggest that the impact of fisheries on marine plankton and biogeochemistry is, on a global scale, in line with a linear top-down control: An increase of the zooplankton mortality rate reduces the global inte- gral of the zooplankton biomass (up to 4%) and with this its feeding pressure on phytoplankton. This, in turn, leads to an increase of the globally integrated phytoplankton biomass (up to 5%) and an increase of the glob- ally integrated export production (up to 4%). Although these simulated changes are small, they are similar in magnitude to changes in biogeochemical properties that result from the simulated CO2-induced warm- ing from the preindustrial period until present (see Table 2). Already from this perspective, a more detailed investigation of fisheries impacts on marine biogeochemistry seems desirable.
A surprising finding of our study is that on a regional scale, the simulated changes are not uniform but show systematic differences depending on the local ecosystem dynamics. We find two different processes: (i) In nutrient-replete regions, such as the upwelling region in the Southern Ocean or in the tropical Pacific, we identified a positive response. The steady state analysis of the zero-dimensional model as well as the results of the full three-dimensional biogeochemical circulation model show that upon an increase in zooplankton mortality, both zooplankton and phytoplankton biomass increase as well (by 3% and 10%, respectively).
(ii) In nutrient-limited regions we found a negative response. Here an increase of the zooplankton mortality results in a decrease of zooplankton and phytoplankton biomass. In this nutrient-limited case, the recycling of nutrients is reduced by an enhanced export of detritus (due to the increased zooplankton mortality) in combination with a reduction of the zooplankton excretion. This process enhances nutrient limitation in the upper layers.
Independent of the region under consideration, the model results show that local changes in zooplankton and phytoplankton always have the same sign. This is in contrast to a classical linear food chain model that would imply alternating signs of changes in the trophic hierarchy. In addition, the response of the identi- fied processes have opposite signs in nutrient-replete and nutrient-limited regions, indicating the important role of nutrient supply and nutrient recycling in the response of the model ecosystem to changes in the closure term at the highest trophic level of the model. Opposite regional impacts partly cancel in the inte- grated response on a global scale. This further highlights that the weak global response does not imply that regional responses are also weak (see, e.g., Table 2). Both mechanisms also hold in sensitivity experiments, in which the quadratic zooplankton mortality used routinely in UVic 2.9 is replaced by a linear zooplankton mor- tality term. This illustrates that the response is not a specific feature of the particular model equations used but may be a generic response of planktonic systems to changes in the loss term of the highest trophic level.
The two identified processes for nutrient-replete and nutrient-limited regions, respectively, show large dif- ferences in the adaptation time required to reach a new equilibrium. The adaptation time found in nutrient- replete upwelling regions is very short (less than a month), whereas the full adaptation in nutrient-limited regions is very slow (centennial time scale). Our results further indicate that fisheries-induced changes in zooplankton mortality can have an effect on the export production and remineralization processes, which

![Figure 2. Annual averages of the (a) globally integrated zooplankton biomass[Tg N], (b) globally integrated phytoplankton biomass [Tg N], (c) globally averaged export production across 125 m [mol N m −2 y −1 ], (d) globally integrated remineralized detritu](https://thumb-eu.123doks.com/thumbv2/1library_info/5330523.1680689/5.918.92.825.137.468/averages-integrated-zooplankton-integrated-phytoplankton-production-integrated-remineralized.webp)
![Figure 3. Southern Ocean (south of 40 ∘ S) and the tropics (between 20 ∘ S and 20 ∘ N): (a, f ) integrated zooplankton biomass [Tg N]; (b, g) integrated phytoplankton biomass [Tg N]; (c, h) averaged export production across 125 m [Gt N y −1 ]; (d, i) globa](https://thumb-eu.123doks.com/thumbv2/1library_info/5330523.1680689/6.918.293.828.162.1015/figure-southern-integrated-zooplankton-integrated-phytoplankton-averaged-production.webp)
![Figure 4. Map of changes (HIGH-REF) of vertically integrated (a, d) zooplankton biomass [mmol N m −2 ], (b, e) phytoplankton biomass [mmol N m −2 ] for two different times, and of (c, f ) surface nutrients [mmol N m −3 ] 1 week (Figures 4a–4c) and 6 weeks (](https://thumb-eu.123doks.com/thumbv2/1library_info/5330523.1680689/8.918.145.776.132.765/figure-vertically-integrated-zooplankton-phytoplankton-different-nutrients-figures.webp)
![Figure 6. Map of changes after 300 years. Vertically integrated annual mean zooplankton biomass [mmol N m −2 ]: (a) HIGH-REF and (b) LOW-REF](https://thumb-eu.123doks.com/thumbv2/1library_info/5330523.1680689/10.918.143.778.131.774/figure-changes-years-vertically-integrated-annual-zooplankton-biomass.webp)
![Figure 9. Annual averages of the (a) integrated zooplankton biomass [Tg N] for the global ocean (left column), the Southern Ocean (middle column), and the tropics (right column), (b) integrated phytoplankton biomass [Tg N], (c) averaged export production a](https://thumb-eu.123doks.com/thumbv2/1library_info/5330523.1680689/12.918.92.836.132.913/averages-integrated-zooplankton-southern-integrated-phytoplankton-averaged-production.webp)


