SFB 649 Discussion Paper 2012-067
Can the market forecast the weather better than
meteorologists?
Matthias Ritter *
* Humboldt-Universität zu Berlin, Germany
S FB
6 4 9
E C O N O M I C
R I S K
B E R L I N
Can the market forecast the weather better than meteorologists? *
Matthias Ritter
abAbstract. Many companies depend on weather conditions, so they require reliable weather forecasts for production planning or risk hedging. In this article, we propose a new way of gaining weather forecasts by exploiting the forward-looking information included in the market prices of weather deriva- tives traded at the Chicago Mercantile Exchange (CME). For this purpose, the CME futures prices of two monthly temperature indices relevant for the energy sector are compared with index forecasts derived from meteorological temperature forecasts. It turns out that the market prices generally outper- form the meteorological forecasts in predicting the outcome of the monthly index. Hence, companies whose prot strongly depends on these indices, such as energy companies, can prot from this additional information source about future weather.
Keywords: Weather derivatives, weather forecasts, CME, energy sector JEL classication: G15, G17, Q41, Q47
1 Introduction
Weather risk plays an important role in many economic sectors. For example, the beverage industry sells less drinks if a summer is colder and wetter than expected,
*The nancial support from the German Research Foundation via the CRC 649 `Economic Risk', Humboldt-University Berlin, is gratefully acknowledged.
aDepartment of Agricultural Economics and Rural Development, Georg-August-Universität Göttingen, Platz der Göttinger Sieben 5, 37073 Göttingen, Germany
bDepartment of Agricultural Economics, Humboldt-Universität zu Berlin, Philippstraÿe 13 Building 12a, 10115 Berlin, Germany.
E-mail: Matthias.Ritter@agrar.hu-berlin.de
whereas farmers get less prot in a hot and dry summer. One of the most weather sensitive sectors is the energy sector as energy demand strongly depends on weather conditions. Consequently, reliable meteorological weather forecasts are necessary for production planning and risk hedging.
Weather derivatives based on dierent temperature indices are traded at the CME (Chicago Mercantile Exchange) and oered for 24 cities in the USA. If the traded asset is somehow weather related, its price depends on meteorological weather forecasts because all market participants are aware of this information and use it to adjust the bid and ask prices to the expected weather outcome. Roll (1984) has found a strong correlation between futures prices of frozen orange juice and weather forecasts; Doreitner and Wimmer (2010) and Ritter et al. (2011) demonstrate that the prices of temperature futures are clearly inuenced by meteorological weather forecasts. From historical data for Chicago and New York, Kulkarni (2003) has discovered a linear dependence between natural gas consumption in winter and the monthly Heating Degree Day (HDD) index and has shown that the market prices of HDD futures can be used for forecasting gas consumption in winter. He neglects, however, if this result really comes from the weather forecasting ability of the market prices or from the natural seasonality of temperature, which is reected in the HDD futures price as well. It is not veried if similar results could be obtained with historical averages of the temperature or with meteorological temperature forecasts.
In this study, it is analyzed if the market price of weather futures really contains more information about the future weather than usual meteorological forecasts from an atmo- spheric model and can thus be used as a weather forecast itself. For this purpose, the CME futures prices of two temperature indices relevant for the energy sector, namely, monthly HDD and CDD (Cooling Degree Day), are compared with an index forecast
tion period ends. The results show that in most cases, the HDD/CDD market prices signicantly outperform the HDD/CDD forecasts derived from meteorological forecasts in predicting the index outcome at the end of the month. Hence, companies whose prot strongly depends on the HDD/CDD index evolution, such as energy companies, can exploit this additional information for forecasting the short-term energy demand.
The paper is organized as follows: In the next section, it is explained in detail how the market prices are compared with the meteorological temperature forecasts. Furthermore, a benchmark model based on historical data, as well as the market price data and the meteorological forecast data, are introduced. In Section 3, the performance of the dierent approaches in predicting the index outcome is compared. Further discussion on the applicability of the results and conclusions are provided in the last section.
2 Methods and data
2.1 Denitions
The two indices traded at the CME and used in this study are both based on the Daily Average Temperature (DAT) Tt, which is dened as the average of the minimal and the maximal temperature on day t. From the DAT, the indices are derived as follows:
The (cumulative) HDD index over a period [τ1, τ2], τ1, τ2 ∈ N, τ1 ≤τ2, with threshold K (usually 18◦C/65◦F) is dened as the sum of the daily heating degree days in the period, i. e.,
HDD(τ1, τ2) =
τ2
X
t=τ1
HDDt =
τ2
X
t=τ1
max(0, K−Tt). (1)
Hence, the HDD index measures the dierence of the temperature to 65◦F if the temper- ature is lower than 65◦F and heating is needed. The CDD index, however, measures the
dierence of the temperature to 65◦F if the temperature is higher than 65◦F and cooling is needed. The (cumulative) CDD index over a period [τ1, τ2], τ1, τ2 ∈ N, τ1 ≤ τ2, with thresholdK (usually 18◦C/65◦F) is dened as the sum of the daily cooling degree days in the period, i. e.
CDD(τ1, τ2) =
τ2
X
t=τ1
CDDt=
τ2
X
t=τ1
max(0, Tt−K). (2)
HDD and CDD contracts are oered on a monthly and seasonal basis at the CME, but for the most traded contracts, the accumulation period [τ1, τ2] is one calendar month.
The prices are reported in index points and after the end of the contract, the tick size (20 $ per index point for US cities) converts the index outcome into a monetary amount.
2.2 Approaches
In this article, we compare three dierent ways of predicting the actual index outcome Ii of an HDD/CDD futures contract i with accumulation period [τ1i, τ2i] (one calendar month). The prediction of Ii takes place k days before the end of the contract and is denoted by Iˆk,i. Here,k describes the number of missing days that have to be predicted and ranges from 1 to 14 in this study.
The rst approach is using the current market price of weather futures, which is reported at the CME. As it contains the payo expectation of all traders, it can be seen as a prediction of the index outcome. The predicted payo for contract i with accumulation period [τ1i, τ2i] and k missing days to be predicted is given by the market price at timet=τ2i−k+ 1 (see Fig. 1):
Iˆk,iMarket=F(τ2i−k+ 1;τ1i, τ2i), (3)
t=τi2-k+1
TemperatureIndex
Past
τi2
τi1
Today
Forecasts
Future Payoff prediction
Îk,iMeteo Market
Market price
Îk,i Ii
Figure 1: Payo predictionk days before the end of the contract by the market and the meteorological forecasts approach
with F(t;τ1, τ2) indicating the market price at time t of a contract with accumulation period[τ1, τ2].
The second approach is based on meteorological temperature forecasts. As they are usually not available one month in advance, we compare the approaches only on those days where meteorological forecasts are available for the rest of the accumulation period.
The rst part of the accumulation period until the previous day is already observed, leading to a certain HDD/CDD index value (see Fig. 1). Then, the HDD/CDD forecast derived from the temperature forecast for the rest of the period is added to the already observed value. This results in one value which is the predicted index outcome for the calendar month. The closer to the end of the contract, the lower the portion of predicted, unobserved values.
Iˆk,iMeteo =HDD(τ1i, τ2i−k) +
τ2i
X
t=τ2i−k+1
max(0, K −TˆtMeteo) (4)
The prediction for a CDD contract is calculated analogously.
The third approach used as a benchmark is based on the historical temperature evo- lution. Here, the missing future index values are derived from the historical average temperaturesT¯tHist. Consequently, this approach does not consider any forward-looking information, but considers the typical long-term behaviour of the temperature.
Iˆk,iHist =HDD(τ1i, τ2i−k) +
τ2i
X
t=τ2i−k+1
max(0, K −T¯tHist) (5)
The prediction for a CDD contract is calculated analogously.
To keep the approaches comparable, they are all based on the same day's data. If the market price is reported on day t, historical temperature data, and thereby historical HDD/CDD index values, are observed until dayt−1. Hence, the meteorological forecasts calculated on dayt predict the temperature (index) for day t and the subsequent days.
The historical approach predicts the index on the missing dayst,t+ 1,. . . by averaging the historical temperatures on these days in the previous years and calculating the index.
The accuracy of the prediction is evaluated for each approach through the Root Mean Squared Error (RMSE), dened as:
RMSE(k) = v u u t
1 N ·
N
X
i=1
Iˆk,i−Ii
2
wherekdescribes the forecast horizon, i. e., how many days before the end of the contract the index outcome is predicted. Iˆk,i is the predicted index outcome of the ith contract k days before the end of the contract, whereas Ii is the actual index outcome. The quadratic deviation of the predicted index outcome from the actual one is averaged for allN contracts.
City Type Months Number Total volume New York City HDD/CDD Jan09Mar12 40 77 431 Minneapolis HDD/CDD Jan09Mar12 39 15 970 Cincinnati HDD/CDD Jan09Mar12 41 12 517 Houston HDD/CDD Jan09Mar12 40 11 557 Kansas City HDD/CDD Jan09Mar12 39 11 950
Portland HDD/CDD Feb10Mar12 24 800
Table 1: Decription of the monthly contracts used in this study
2.3 Data
This study is based on the monthly HDD/CDD contracts from January 2009 to March 2012, i. e., around 40 contracts for each city. The considered reference stations are New York City (LaGuardia Airport), Minneapolis (Saint Paul International Airport), Cincinnati (Northern Kentucky International Airport), Houston (Bush Intercontinental Airport), Kansas City (International Airport) and Portland (International Airport). The HDD contracts are oered in the winter months, OctoberMarch, whereas the CDD contracts, AprilSeptember. For some cities, both HDD and CDD contracts are oered for April and October. Details about the contracts for the six cities used in this study are depicted in Table 1.
For all these contracts, CME market prices are available for every weekday in the trading period. They are obtained from Bloomberg via the Research Data Center (RDC) of the Collaborative Research Center (CRC) 649 `Economic Risk'.
Furthermore, meteorological point forecasts derived from WeatherOnline1 for the pe- riod January 2009March 2012 for all cities except Portland are used. The forecast data for Portland start from February, 2010, so that the analysis for this city starts with the HDD contract February 2010. The dataset consists of forecasted minimum and maxi- mum temperatures from 0 to 13 days in advance, that is, 14 days. Please note that only
1The author cordially thanks H. Werner and U. Römer from WeatherOnline for providing meteoro- logical forecast data.
1 2 3 4 5 6 7 8 9 10 11 12 13 0
1 2 3 4 5 6 7 8 9 10
RMSE (°F)
Forecast Horizon
New York Minneapolis Cincinnati Houston Kansas City Portland
Figure 2: RMSE of the meteorological forecasts compared with the realized temperatures in dependence of the forecast horizon, data 01/01/200931/03/2012
the forecasts calculated on the last 14 days of each month are needed in this study. For the benchmark approach, historical temperature data are provided for each city since 1997 by the CME. To avoid bias in the analysis, all missing days in the datasets are linearly interpolated.
3 Results
3.1 Meteorological forecasts
At rst, we analyze the quality of the meteorological forecast data. Therefore, the mete- orological forecast data for the daily average temperature are compared with the realized temperatures from 01/01/20092 to 31/03/2012. Fig. 2 shows similar and unsurprising results for all six cities: The further the forecast horizon, the less reliable the meteo- rological forecasts. This emphasizes the diculty of obtaining good mid-term forecast data.
3.2 Payo prediction
In this section, we investigate if the market price includes more information about the future weather than the meteorological forecast and the historical forecast. For each city and each contract, the dierence between the realized outcome of the HDD/CDD index and the outcome forecasted up to 14 days before the end of the contract is calculated.
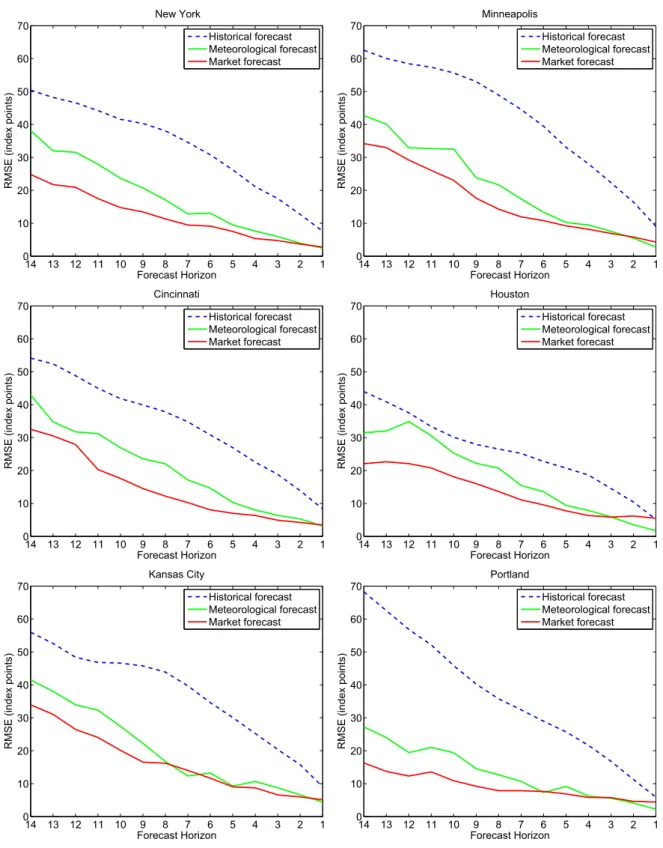
For forecasting the outcome, the three approaches from Section 2.2 are used: historical forecast, meteorological forecast and market forecast. Then, the RMSE for all contracts is calculated separately for each city and each forecast horizon. Hence, each value of the RMSE is based on around 40 values (the number of contracts), and the calculation is repeated for the three approaches, the six cities and the 14 dierent forecast horizons.
The results in Fig. 3 depict a similar behaviour for all six cities: First, the RMSE for all forecast approaches decreases with decreasing forecast horizon. This is not surprising as with approaching the end of the contract, more and more days are already observed and the uncertainty reduces. Second, the approach based on historical data is always outperformed by the other two approaches, including forward-looking information.
Third, the market forecast approach always outperforms the meteorological forecast approach for a longer forecast horizon: If the end of the contract is at least eight days away, the RMSE for the market forecast is the lowest for all six cities. This dierence, however, vanishes if the forecast horizon decreases. This is in accordance with the ndings from Section 3.1, that the meteorological forecasts improve for a shorter forecast horizon.
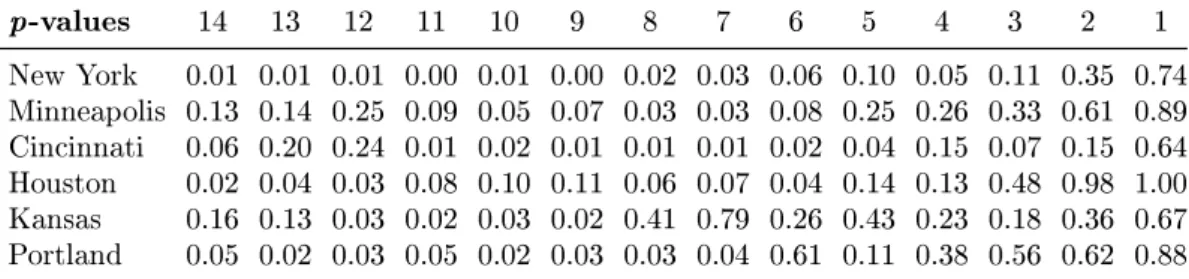
Table 2 shows the results of a one-tailed two-sample t-test with unequal variances to nd out if the deviations of the meteorological forecast approach and the market forecast approach are signicantly dierent. At the 5 % signicance level, the dierence is signicant in 31/48 cases (65%) for a forecast horizon of at least seven days. At the 10 %
p-values 14 13 12 11 10 9 8 7 6 5 4 3 2 1 New York 0.01 0.01 0.01 0.00 0.01 0.00 0.02 0.03 0.06 0.10 0.05 0.11 0.35 0.74 Minneapolis 0.13 0.14 0.25 0.09 0.05 0.07 0.03 0.03 0.08 0.25 0.26 0.33 0.61 0.89 Cincinnati 0.06 0.20 0.24 0.01 0.02 0.01 0.01 0.01 0.02 0.04 0.15 0.07 0.15 0.64 Houston 0.02 0.04 0.03 0.08 0.10 0.11 0.06 0.07 0.04 0.14 0.13 0.48 0.98 1.00 Kansas 0.16 0.13 0.03 0.02 0.03 0.02 0.41 0.79 0.26 0.43 0.23 0.18 0.36 0.67 Portland 0.05 0.02 0.03 0.05 0.02 0.03 0.03 0.04 0.61 0.11 0.38 0.56 0.62 0.88
Table 2: p-values of a one-tailed two-samplet-test for signicant deviations signicance level, this number increases to 38/48 cases (79%). Hence, the market price clearly includes better forward-looking information than the meteorological forecasts.
4 Discussion and conclusion
In this article, the performance of dierent approaches in predicting the outcome or payo of certain temperature indices was compared. The historical forecast approach performed poorly for all cities, so that one could think of applying a more sophisticated time series model based on historical temperatures such as the ARMA-GARCH model by Campbell and Diebold (2005). This article, however, focusses on a comparison of the market forecast and the meteorological forecast, so that the benchmark model is kept as simple as possible.
For the other approaches, it turned out that the market price generally includes better forward-looking information than meteorological weather forecasts. As market partici- pants have access to meteorological forecasts provided by many dierent meteorological services, they are all incorporated in the market price. Hence, the market price is a mix- ture of all forward-looking information and thus can outperform meteorological forecasts derived from a single weather service.
Naturally, this result is restricted to the specic indices and cannot be used to forecast the temperature on single days. If a company's prot, however, has a strong relation
14 13 12 11 10 9 8 7 6 5 4 3 2 1 0
10 20 30 40 50 60
70 New York
RMSE (index points)
Forecast Horizon
Historical forecast Meteorological forecast Market forecast
14 13 12 11 10 9 8 7 6 5 4 3 2 1
0 10 20 30 40 50 60
70 Minneapolis
RMSE (index points)
Forecast Horizon
Historical forecast Meteorological forecast Market forecast
14 13 12 11 10 9 8 7 6 5 4 3 2 1
0 10 20 30 40 50 60
70 Cincinnati
RMSE (index points)
Forecast Horizon
Historical forecast Meteorological forecast Market forecast
14 13 12 11 10 9 8 7 6 5 4 3 2 1
0 10 20 30 40 50 60
70 Houston
RMSE (index points)
Forecast Horizon
Historical forecast Meteorological forecast Market forecast
14 13 12 11 10 9 8 7 6 5 4 3 2 1
0 10 20 30 40 50 60
70 Kansas City
RMSE (index points)
Forecast Horizon
Historical forecast Meteorological forecast Market forecast
14 13 12 11 10 9 8 7 6 5 4 3 2 1
0 10 20 30 40 50 60
70 Portland
RMSE (index points)
Forecast Horizon
Historical forecast Meteorological forecast Market forecast
Figure 3: RMSE of the predicted index outcome compared to the real outcome, HDD/CDD contracts 01/200903/2012
the index outcome. Energy demand, for example, strongly depends on temperature, or derived temperature indices, such as the monthly HDD and CDD indices, traded at the CME (Fischer, 2010; Pardo et al., 2002; Sailor and Muñoz, 1997). Kulkarni (2003), for example, showed that a linear function of the monthly HDD index is a good approxi- mation of the natural gas consumption in winter. Those indices are especially designed for the energy sector as energy demand increases if temperatures are low (heating) or high (cooling) (Mirasgedis et al., 2006; Svec and Stevenson, 2007). Hence, the forward- looking information included in the monthly HDD/CDD market prices can be exploited by energy companies, that require short-term and mid-term load forecasts, and there- fore, weather forecasts to manage production, transmission and distribution of electricity (Soares and Medeiros, 2008).
The maximal forecast horizon was 14 days in this study because of the length of the meteorological forecast data. Further studies are needed to nd out if the results can be generalized to longer forecast horizons. Moreover, the analysis should be repeated for other contracts traded at the CME, especially for CAT (Cumulated Average Temper- ature) and weekly contracts, to nd out if they also include usable information about future weather.
References
Campbell, S. D. and Diebold, F. X. (2005). Weather forecasting for weather derivatives.
Journal of the American Statistical Association, 100:616.
Doreitner, G. and Wimmer, M. (2010). The pricing of temperature futures at the Chicago Mercantile Exchange. Journal of Banking & Finance, 34(6):13601370.
Fischer, M. (2010). Modelling and forecasting energy demand: Principles and dicul-
Industry, NATO Science for Peace and Security Series C: Environmental Security, pages 207226. Springer Netherlands.
Kulkarni, V. (2003). Using weather futures as weather forecasts. CME Sponsored Series, www.cmegroup.com/trading/weather/files/WEA_wtfutures_as_wtforecast.pdf.
Mirasgedis, S., Saradis, Y., Georgopoulou, E., Lalas, D., Moschovits, M., Karagian- nis, F., and Papakonstantinou, D. (2006). Models for mid-term electricity demand forecasting incorporating weather inuences. Energy, 31(23):208227.
Pardo, A., Meneu, V., and Valor, E. (2002). Temperature and seasonality inuences on Spanish electricity load. Energy Economics, 24(1):5570.
Ritter, M., Muÿho, O., and Odening, M. (2011). Meteorological forecasts and the pricing of temperature futures. The Journal of Derivatives, 19(2):4560.
Roll, R. (1984). Orange juice and weather. The American Economic Review, 74(5):861 880.
Sailor, D. J. and Muñoz, J. (1997). Sensitivity of electricity and natural gas consump- tion to climate in the U.S.A. Methodology and results for eight states. Energy, 22(10):987998.
Soares, L. J. and Medeiros, M. C. (2008). Modeling and forecasting short-term electricity load: A comparison of methods with an application to Brazilian data. International Journal of Forecasting, 24:630644.
Svec, J. and Stevenson, M. (2007). Modelling and forecasting temperature based weather derivatives. Global Finance Journal, 18(2):185204.
SFB 649 Discussion Paper Series 2012
For a complete list of Discussion Papers published by the SFB 649, please visit http://sfb649.wiwi.hu-berlin.de.
001 "HMM in dynamic HAC models" by Wolfgang Karl Härdle, Ostap Okhrin and Weining Wang, January 2012.
002 "Dynamic Activity Analysis Model Based Win-Win Development Forecasting Under the Environmental Regulation in China" by Shiyi Chen and Wolfgang Karl Härdle, January 2012.
003 "A Donsker Theorem for Lévy Measures" by Richard Nickl and Markus Reiß, January 2012.
004 "Computational Statistics (Journal)" by Wolfgang Karl Härdle, Yuichi Mori and Jürgen Symanzik, January 2012.
005 "Implementing quotas in university admissions: An experimental analysis" by Sebastian Braun, Nadja Dwenger, Dorothea Kübler and Alexander Westkamp, January 2012.
006 "Quantile Regression in Risk Calibration" by Shih-Kang Chao, Wolfgang Karl Härdle and Weining Wang, January 2012.
007 "Total Work and Gender: Facts and Possible Explanations" by Michael Burda, Daniel S. Hamermesh and Philippe Weil, February 2012.
008 "Does Basel II Pillar 3 Risk Exposure Data help to Identify Risky Banks?"
by Ralf Sabiwalsky, February 2012.
009 "Comparability Effects of Mandatory IFRS Adoption" by Stefano Cascino and Joachim Gassen, February 2012.
010 "Fair Value Reclassifications of Financial Assets during the Financial Crisis" by Jannis Bischof, Ulf Brüggemann and Holger Daske, February 2012.
011 "Intended and unintended consequences of mandatory IFRS adoption: A review of extant evidence and suggestions for future research" by Ulf Brüggemann, Jörg-Markus Hitz and Thorsten Sellhorn, February 2012.
012 "Confidence sets in nonparametric calibration of exponential Lévy models" by Jakob Söhl, February 2012.
013 "The Polarization of Employment in German Local Labor Markets" by Charlotte Senftleben and Hanna Wielandt, February 2012.
014 "On the Dark Side of the Market: Identifying and Analyzing Hidden Order Placements" by Nikolaus Hautsch and Ruihong Huang, February 2012.
015 "Existence and Uniqueness of Perturbation Solutions to DSGE Models" by Hong Lan and Alexander Meyer-Gohde, February 2012.
016 "Nonparametric adaptive estimation of linear functionals for low frequency observed Lévy processes" by Johanna Kappus, February 2012.
017 "Option calibration of exponential Lévy models: Implementation and empirical results" by Jakob Söhl und Mathias Trabs, February 2012.
018 "Managerial Overconfidence and Corporate Risk Management" by Tim R.
Adam, Chitru S. Fernando and Evgenia Golubeva, February 2012.
019 "Why Do Firms Engage in Selective Hedging?" by Tim R. Adam, Chitru S.
Fernando and Jesus M. Salas, February 2012.
020 "A Slab in the Face: Building Quality and Neighborhood Effects" by Rainer Schulz and Martin Wersing, February 2012.
021 "A Strategy Perspective on the Performance Relevance of the CFO" by Andreas Venus and Andreas Engelen, February 2012.
022 "Assessing the Anchoring of Inflation Expectations" by Till Strohsal and Lars Winkelmann, February 2012.
SFB 649 Discussion Paper Series 2012
For a complete list of Discussion Papers published by the SFB 649, please visit http://sfb649.wiwi.hu-berlin.de.
023 "Hidden Liquidity: Determinants and Impact" by Gökhan Cebiroglu and Ulrich Horst, March 2012.
024 "Bye Bye, G.I. - The Impact of the U.S. Military Drawdown on Local German Labor Markets" by Jan Peter aus dem Moore and Alexandra Spitz-Oener, March 2012.
025 "Is socially responsible investing just screening? Evidence from mutual funds" by Markus Hirschberger, Ralph E. Steuer, Sebastian Utz and Maximilian Wimmer, March 2012.
026 "Explaining regional unemployment differences in Germany: a spatial panel data analysis" by Franziska Lottmann, March 2012.
027 "Forecast based Pricing of Weather Derivatives" by Wolfgang Karl Härdle, Brenda López-Cabrera and Matthias Ritter, March 2012.
028 “Does umbrella branding really work? Investigating cross-category brand loyalty” by Nadja Silberhorn and Lutz Hildebrandt, April 2012.
029 “Statistical Modelling of Temperature Risk” by Zografia Anastasiadou, and Brenda López-Cabrera, April 2012.
030 “Support Vector Machines with Evolutionary Feature Selection for Default Prediction” by Wolfgang Karl Härdle, Dedy Dwi Prastyo and Christian Hafner, April 2012.
031 “Local Adaptive Multiplicative Error Models for High-Frequency Forecasts” by Wolfgang Karl Härdle, Nikolaus Hautsch and Andrija Mihoci, April 2012.
032 “Copula Dynamics in CDOs.” by Barbara Choroś-Tomczyk, Wolfgang Karl Härdle and Ludger Overbeck, May 2012.
033 “Simultaneous Statistical Inference in Dynamic Factor Models” by Thorsten Dickhaus, May 2012.
034 “Realized Copula” by Matthias R. Fengler and Ostap Okhrin, Mai 2012.
035 “Correlated Trades and Herd Behavior in the Stock Market” by Simon Jurkatis, Stephanie Kremer and Dieter Nautz, May 2012
036 “Hierarchical Archimedean Copulae: The HAC Package” by Ostap Okhrin and Alexander Ristig, May 2012.
037 “Do Japanese Stock Prices Reflect Macro Fundamentals?” by Wenjuan Chen and Anton Velinov, May 2012.
038 “The Aging Investor: Insights from Neuroeconomics” by Peter N. C. Mohr and Hauke R. Heekeren, May 2012.
039 “Volatility of price indices for heterogeneous goods” by Fabian Y.R.P.
Bocart and Christian M. Hafner, May 2012.
040 “Location, location, location: Extracting location value from house prices” by Jens Kolbe, Rainer Schulz, Martin Wersing and Axel Werwatz, May 2012.
041 “Multiple point hypothesis test problems and effective numbers of tests”
by Thorsten Dickhaus and Jens Stange, June 2012
042 “Generated Covariates in Nonparametric Estimation: A Short Review.”
by Enno Mammen, Christoph Rothe, and Melanie Schienle, June 2012.
043 “The Signal of Volatility” by Till Strohsal and Enzo Weber, June 2012.
044 “Copula-Based Dynamic Conditional Correlation Multiplicative Error Processes” by Taras Bodnar and Nikolaus Hautsch, July 2012
SFB 649, Spandauer Straße 1, D-10178 Berlin http://sfb649.wiwi.hu-berlin.de
SFB 649 Discussion Paper Series 2012
For a complete list of Discussion Papers published by the SFB 649, please visit http://sfb649.wiwi.hu-berlin.de.
045 "Additive Models: Extensions and Related Models." by Enno Mammen, Byeong U. Park and Melanie Schienle, July 2012.
046 "A uniform central limit theorem and efficiency for deconvolution estimators" by Jakob Söhl and Mathias Trabs, July 2012
047 "Nonparametric Kernel Density Estimation Near the Boundary" by Peter Malec and Melanie Schienle, August 2012
048 "Yield Curve Modeling and Forecasting using Semiparametric Factor Dynamics" by Wolfgang Karl Härdle and Piotr Majer, August 2012
049 "Simultaneous test procedures in terms of p-value copulae" by Thorsten Dickhaus and Jakob Gierl, August 2012
050 "Do Natural Resource Sectors Rely Less on External Finance than Manufacturing Sectors? " by Christian Hattendorff, August 2012
051 "Using transfer entropy to measure information flows between financial markets" by Thomas Dimpfl and Franziska J. Peter, August 2012
052 "Rethinking stock market integration: Globalization, valuation and convergence" by Pui Sun Tam and Pui I Tam, August 2012
053 "Financial Network Systemic Risk Contributions" by Nikolaus Hautsch, Julia Schaumburg and Melanie Schienle, August 2012
054 "Modeling Time-Varying Dependencies between Positive-Valued High- Frequency Time Series" by Nikolaus Hautsch, Ostap Okhrin and Alexander Ristig, September 2012
055 "Consumer Standards as a Strategic Device to Mitigate Ratchet Effects in Dynamic Regulation" by Raffaele Fiocco and Roland Strausz, September 2012
056 "Strategic Delegation Improves Cartel Stability" by Martijn A. Han, October 2012
057 "Short-Term Managerial Contracts and Cartels" by Martijn A. Han, October 2012
058 "Private and Public Control of Management" by Charles Angelucci and Martijn A. Han, October 2012
059 "Cartelization Through Buyer Groups" by Chris Doyle and Martijn A. Han, October 2012
060 "Modelling general dependence between commodity forward curves" by Mikhail Zolotko and Ostap Okhrin, October 2012
061 "Variable selection in Cox regression models with varying coefficients" by Toshio Honda and Wolfgang Karl Härdle, October 2012
062 "Brand equity – how is it affected by critical incidents and what moderates the effect" by Sven Tischer and Lutz Hildebrandt, October 2012
063 "Common factors in credit defaults swaps markets" by Yi-Hsuan Chen and Wolfgang Karl Härdle, October 2012
064 "Measuring the impact of critical incidents on brand personality" by Sven Tischer, October 2012
065 "Covered bonds, core markets, and financial stability" by Kartik Anand, James Chapman and Prasanna Gai, October 2012
066 "Implied Basket Correlation Dynamics" by Wolfgang Karl Härdle and Elena Silyakova, November 2012
SFB 649, Spandauer Straße 1, D-10178 Berlin http://sfb649.wiwi.hu-berlin.de
SFB 649 Discussion Paper Series 2012
For a complete list of Discussion Papers published by the SFB 649, please visit http://sfb649.wiwi.hu-berlin.de.
067 "Can the market forecast the weather better than meteorologists?" by Matthias Ritter, December 2012