R E S E A R C H A R T I C L E
Location and arrangement of campaniform sensilla in Drosophila melanogaster
Gesa F. Dinges | Alexander S. Chockley | Till Bockemühl | Kei Ito | Alexander Blanke | Ansgar Büschges
Institute of Zoology, University of Cologne, Cologne, Germany
Correspondence
Gesa F. Dinges and Ansgar Büschges, Institute of Zoology, University of Cologne, 50674 Cologne, Germany.
Email: g.dinges@uni-koeln.de (G. F. D.) and ansgar.bueschges@uni-koeln.de (A. B.)
Present address
Alexander S. Chockley, Neurobiology and Genetics, University of Würzburg Biocenter, Würzburg, Germany
Funding information
Deutsche Forschungsgemeinschaft, Grant/
Award Number: 233886668/GRK1960;
H2020 European Research Council, Grant/
Award Number: 754290
Abstract
Sensory systems provide input to motor networks on the state of the body and envi- ronment. One such sensory system in insects is the campaniform sensilla (CS), which detect deformations of the exoskeleton arising from resisted movements or external perturbations. When physical strain is applied to the cuticle, CS external structures are compressed, leading to transduction in an internal sensory neuron. In
Drosophila melanogaster, the distribution of CS on the exoskeleton has not been comprehen-sively described. To investigate CS number, location, spatial arrangement, and poten- tial differences between individuals, we compared the front, middle, and hind legs of multiple flies using scanning electron microscopy. Additionally, we imaged the entire body surface to confirm known CS locations. On the legs, the number and rela- tive arrangement of CS varied between individuals, and single CS of corresponding segments showed characteristic differences between legs. This knowledge is funda- mental for studying the relevance of cuticular strain information within the complex neuromuscular networks controlling posture and movement. This comprehensive account of all
D. melanogasterCS helps set the stage for experimental investigations into their responsivity, sensitivity, and roles in sensory acquisition and motor control in a light-weight model organism.
K E Y W O R D S
campaniform sensilla,Drosophila melanogaster, electron microscopy, mechanoreceptors, movement, posture, RRID: BDSC_8522, RRID: SCR_014235, RRID: SCR_001622, RRID:
SCR_014235, RRID:SCR_008606, RRID:SCR_012420, sensory receptors
1 | I N T R O D U C T I O N
Interactions between an organism and its environment must be pre- cise, robust, and dynamic, requiring the fine-tuning and modulation of executed movements. This modulation is enabled by feedback from sensory structures, activated by both external and internal stimuli.
Sensory organs in insects, ranging from the visual system to
proprioceptors, are highly diverse (North & Greenspan, 2007; Tuthill &
Wilson, 2016), reflecting the complexity of organism–environment relationships. Feedback signals from diverse sensors modulate the activity of neuromuscular networks; for example, functional locomo- tion in insects, such as walking and flying, depends on sensory feed- back from structures in the legs, body, and head (Laurent, 1991;
Orlovsky, Deliagina, & Grillner, 1999).
This is an open access article under the terms of the Creative Commons Attribution-NonCommercial License, which permits use, distribution and reproduction in any medium, provided the original work is properly cited and is not used for commercial purposes.
© 2020 The Authors.The Journal of Comparative Neurologypublished by Wiley Periodicals LLC.
J Comp Neurol.2020;1–21. wileyonlinelibrary.com/journal/cne 1
In the physical context of movements, animals encounter forces as structural load (forces applied to a particular body structure) and body force (forces that act throughout the volume of a body;
e.g., gravity). In insect walking, forces created by a leg pushing against the ground (i.e., resisted forces from leg muscle contraction; Zill, Schmitz, Chaudhry, & Büschges, 2012; Zill, Chaudhry, Büschges, &
Schmitz, 2013; Zill & Moran, 1981a; Zill, Moran, & Varela, 1981), body weight (Dean, 1991), and locomotion (Wendler, 1966) cause mechani- cal distortion of the exoskeleton (Moran, Rowley, Zill, & Varela, 1976).
These forces consequently activate load-monitoring sensory struc- tures, called campaniform sensilla (CS), which are embedded in the cuticle (Moran et al., 1976; Spinola & Chapman, 1975).
CS are mechanoreceptors that respond to both proprioceptive and exteroceptive stimuli (Delcomyn, 1991; Hofmann & Bässler, 1982; Pringle, 1938; Zill et al., 2010). On the structural level, they consist of external (super- and intracuticular) and internal (intra- and subcuticular) elements. Externally, a convex cuticular cap is suspended over a cuticular hole, which is often surrounded by a collar that connects to the cuticle by a joint membrane (Keil, 1997;
Thurm, 1964). Internally, the apical dendrite of a single bipolar sen- sory neuron sits just beneath the cap (Keil, 1997; Moran, Chapman, &
Ellis, 1971; Spinola & Chapman, 1975), and deformations of the cuticular structures, in turn, activate mechanosensitive ion channels (NompC; Sun et al., 2019) in this neuron (Grünert & Gnatzy, 1987;
Spinola & Chapman, 1975). This partially external, partially internal anatomy is essential for the monitoring of forces acting on the exoskeleton (Pringle, 1938; Zill, Chaudhry, Exter, Büschges, &
Schmitz, 2014)—the key role of CS. To which stimuli a particular CS is sensitive and responsive depends on its location, orientation, and the shape of its cap and collar. Moreover, the ultrastructural organization of the NompC channels within the sensory neuron's tubular body is suggested to also affect sensitivity, dynamic range, and responsivity of each CS (Sun et al., 2019).
When CS are activated, signals transduced in the CS neurons can ultimately affect the magnitude (Donelan & Pearson, 2004;
Pearson, 1972; Schmitz & Stein, 2000; Ting & Macpherson, 2004;
Zill, Büschges, & Schmitz, 2011) and timing (Duysens, Clarac, &
Cruse, 2000; Zill et al., 2011) of muscle contractions via interplay with sensorimotor networks. Further, which CS are activated and the effects of their activation is dependent on the origin of the cuticular stimuli—where and on what segment they come from (Spinola &
Chapman, 1975; Zill et al., 1981; Zill & Moran, 1981a; Zill &
Moran, 1981b). In this way, CS tune motor output to ensure suitable postures (Schmitz, 1993; Zill, Schmitz, & Büschges, 2004) and intraleg coordination (Akay, Haehn, Schmitz, & Büschges, 2004; Bässler, 1977). Specific limb movements, such as the thrusting of the hind leg tibia in locusts, are dependent on the encoding of co-contraction forces by individual CS (Burrows & Pflüger, 1988).
In general, CS can be arranged in fields, groups, or as single sen- silla (Cole & Palka, 1982; Gnatzy, Grünert, & Bender, 1987; Hustert, Pflüger, & Bräunig, 1981). The shape of CS caps has been described as round (Dickinson, 1990; Dickinson, 1992; Grünert & Gnatzy, 1987;
Kent & Griffin, 1990; Zill et al., 2013) or elliptical (Gnatzy et al., 1987;
Zill et al., 1981; Zill & Moran, 1981a). CS that have been previously described as elliptical exhibit directional sensitivity provided by the orientation of their long axes (Delcomyn, 1991; Hofmann &
Bässler, 1986; Tuthill & Wilson, 2016; Zill et al., 1981; Zill et al., 2004;
Zill & Moran, 1981a). CS that have been described as round, on the other hand, can be omnidirectionally responsive (Dickinson, 1992) or show directional sensitivity if they are asymmetrically located within their collar (Zill et al., 2013). In addition to the arrangement and shape of CS, their positions on the body are key determinants of their activity.
In Drosophila melanogaster, CS are located on the wings (Cole & Palka, 1982; Huang, Dambly-Chaudiere, & Ghysen, 1991;
Lees, 1942; Palka, Lawrence, & Hart, 1979), halteres (Chevalier, 1969;
Cole & Palka, 1982; Palka et al., 1979), leg segments (Hoikkala &
Moro, 2000; Joel, Adamova, & Bräunig, 2018; Merritt & Murphey, 1992; Yasuyama & Salvaterra, 1999), and thorax (Cole & Palka, 1982).
Schematics ofD. melanogasterlegs have been presented to show the locations of CS on the prothoracic leg (Joel et al., 2018; Merritt &
Murphey, 1992; Yasuyama & Salvaterra, 1999) along with a limited selection of electron microscope images (Joel et al., 2018; Merritt &
Murphey, 1992); studies to date have, however, focused mostly on the front leg. As the same CS from different legs have differential effects on motor output (Akay, Ludwar, Göritz, Schmitz, & Büschges, 2007), knowledge about the front leg only is insufficient for understanding the entire system (Zill et al., 2004). The three pairs of insect legs (pro-, meso-, and metathoracic) differ both morphologically and func- tionally (Mahfooz et al., 2007; Seeds et al., 2014; Zumstein, 2004);
the same task (e.g., forward propulsion during walking) in different legs can, therefore, cause different profiles of cuticular strains.
Understanding which CS are stimulated by which cuticular forces thus requires detailed and comprehensive knowledge of their locations, orientations, and anatomy (Zill, Dallmann, Büschges, Chaudhry, &
Schmitz, 2018).
To develop a framework for investigating the roles of individual CS in walkingD. melanogaster, we aimed to solidify and expand on the existing knowledge to include the complete profile of CS, specifi- cally including the distribution on the entire body and all legs. To do so, we imaged the entire body surface of multiple individuals using scanning electron microscopy (SEM). Our results demonstrate that the CS inD. melanogasterexhibit minimal variability between individ- uals and leg segments in their absolute number as well as their pre- cise locations.
2 | M A T E R I A L S A N D M E T H O D S 2.1 | Samples
Adult female wild-typeDrosophila melanogaster (Berlin-K strain, RRID:
BDSC_8522) aged 2–7 days were used for all experiments. Flies were maintained on a standard yeast medium (Backhaus, Sulkowski, &
Schlote, 1984) at 25C and 65% humidity on a 12-hr/12-hr light/dark cycle.
2.2 | Sample preparation
The right pro-, meso-, and metathoracic legs were removed at the proxi- mal coxa from 14 flies using micro-scissors. Due to sample loss, the final number of images acquired for a particular CS location was between 4 and 12. Each leg was straightened on paraffin using insect pins, care- fully avoiding damage to the leg. While pinned, the legs were fixed in 4% paraformaldehyde in 0.1 M phosphate-buffered saline (PBS) for 90 min, washed in 0.1 M PBS (3×15 min), and stored in PBS overnight.
This was followed by dehydration in an EtOH gradient of 30, 50, 70, 90, 96, and 100% (60 min each; legs stored afterwards in 100% EtOH). The legs were then unpinned and placed into filter paper bags and critical point-dried (CPD 020; Oerlikon Balzers, Balzers, Liechtenstein). Individ- ual legs were then mounted vertically onto insect pins using Leit-C-Plast (Gerhard Neubauer Chemikalien, Münster, Germany) as an adhesive.
The legs were sputtered (SEM Coating Unit PS2; Structure Probe, Inc., West Chester, PA) with 59er-quality gold to a thickness of 190–240 Å.
In addition to the legs of 14 individuals, wings (5 individuals), halteres (8), heads (4), and bodies (3) were dissected using micro-scissors and
prepared in the same manner as the legs. Due to sample loss or prepara- tion artifacts, not all prepared specimens were used for imaging and analysis.
2.3 | Scanning electron microscopy
SEM was performed using an FEI Quanta 250 FEG (Thermo Fisher Scientific, Waltham, MA) under a high vacuum at 15 kV. To ensure high-contrast images, insect pins with attached legs were mounted on a specimen holder based on the design of Pohl (2010). Due to occlusions caused by incomplete straightening of the leg joints, the locations of some CS could not be imaged on some legs.
2.4 | Image postprocessing
To improve visibility of CS, the contrast of SEM images was further optimized using Corel Photo-Paint (version×6; RRID: SCR_014235),
F I G U R E 1 3D reconstructions ofμCT scans of a complete specimen ofD. melanogaster(a1i–a2) and a prothoracic leg (b); (a1) lateral view;
(a1) anterior-lateral view with one elevated wing; (b) individual leg segments highlighted by different colors; Cx, coxa; Tr, trochanter; Fe, femur; Ti, tibia; Ta1 to Ta5, tarsal segments 1 to 5; Cl, claw [Color figure can be viewed at wileyonlinelibrary.com]
as well as MATLAB (RRID: SCR_001622). Figures were compiled using CorelDraw (version×6; RRID: SCR_014235) and MATLAB.
2.5 | Micro-computed tomography
Images segmented and rendered from a micro-computed tomogra- phy (μCT) scan of D. melanogaster legs were used to determine sample orientations in the presentation of SEM images. Legs were prepared in the same manner as for SEM, without being sputtered.
μCT scans were obtained at the imaging beamline P05 of the PETRA III synchrotron operated by the Helmholtz Zemtrum Geesthacht at the German Electron Synchrotron (DESY; Hamburg, Germany) using an absorption contrast setup. The energy was 14 keV at a magnifica- tion of 20x, with a field of view of 1.8 mm and 2×2 pixel binning.
Segmentations were edited and rendered using Blender (version 2.79; RRID:SCR_008606).
2.6 | Definition of CS arrangements and evaluation
In a number of samples, occlusions caused by dirt or hairs or unfavor- able leg segment positions during imaging made determining the num- ber of CS in some locations not entirely unambiguous; we counted only those CS that were identifiable beyond doubt. Therefore, the number of CS reported in this study for a particular location given is a minimum number. Please see the Supporting information for an overview.
The definition of CS arrangements herein is based on Gnatzy et al. (1987). CS were defined assingleif they did not have neighbor- ing CS within a range of approximately 50μm. A groupof CS was defined as two to four CS that were not farther apart than 25μm.
Finally, afieldof sensilla was defined as more than three CS in very close proximity to each other in a row- or column-like arrangement (distance <10μm). These distances were estimated from the SEM images.
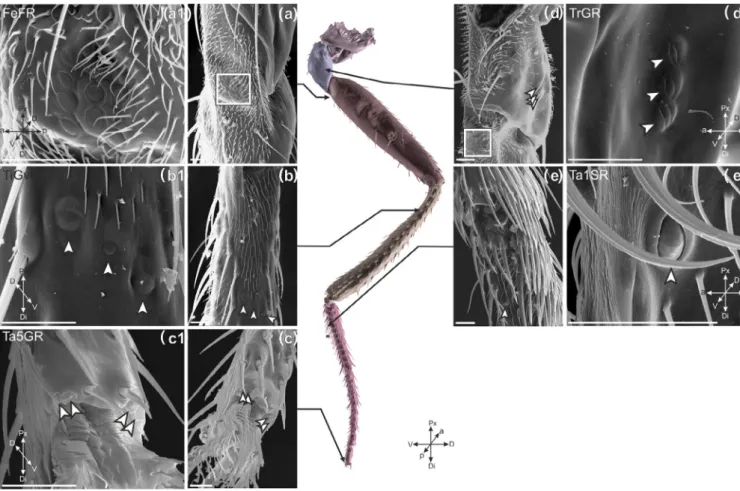
F I G U R E 2 FIGURE SEM images of CS on a prothoracic leg. Arrowheads denote single CS or a group of CS; brackets indicate the fields of CS. Panels (a)–(e) show the overview of the sensilla; panels (a1)–(e1) show magnified views; colored 3D reconstruction ofμCT data (center) show the locations of images in (a)–(e). (a, a1) Dorsal trochanter and proximal femur; single arrowhead denotes FeSF in a and a1, and the three small arrowheads in a denotes TrGF, the bracket denotes TrFpF; (b, b1) dorsal, distal end of first tarsal segment; left and right arrowheads denote Ta5GF; (c, c1) dorsal, distal end of third tarsal segment; left and right arrowheads denote Ta3GF; (d, d1) dorsal CS field on the trochanter (TrFF) marked by bracket in d; this field is subdivided into two subfields (TrFaF, TrFpF) by a cuticular ridge (marked by a black arrowhead); three arrowheads in d denote TrGF, single arrowhead in d denotes FeSF; (e, e1) dorsal, proximal tibia; left and right arrowheads denote TiGdF; scale bars: 15μm [Color figure can be viewed at wileyonlinelibrary.com]
Our initial assessments of the data suggested that the shape of individual CS could vary between individuals. All CS are elliptical, vary- ing in eccentricity; the lower the eccentricity the more circular the ellipse is. Consequently, we did not categorize CS on the basis of their relative eccentricity. In some locations, we state that within one field or group a CS is more or less eccentric than others in their direct prox- imity. This is based on appearance, not measurement. Due to the two- dimensional nature of SEM data, we did not indicate lines along the long axis of CS.
Due to the multiple degrees of freedom ofD. melanogaster's legs, the positional description of cuticular structures depends on the exact posture of the leg. To simplify the description of CS position, we char- acterized positions based on a standing fly at rest. For the wings, pre- viously coined descriptive terms have been preserved, causing the medial radius to refer to the middle of the wing radius instead of the medial wing proximal to the body. For the legs, we defined locations based on the ventral–dorsal, anterior–posterior, and proximal–distal axes (Figure 1).
Previous studies were used to inform the naming scheme of all CS. As the wing and haltere CS have been published using a consistent naming scheme (e.g., Cole & Palka, 1982; Huang et al., 1991; Palka et al., 1979), we used this scheme with slight additions for these appendages. Merritt and Murphey (1992) introduced a naming scheme for the leg CS stating the leg seg- ment and number of CS at each location and whether they are ventral or dorsal. We add to this scheme to designate CS of the front, middle, and rear legs. Furthermore, we used the type of arrangement (field, group, or single) rather than the number of CS as a descriptor, as we underline in this study that the number of CS in a particular location may vary between individuals. Tr (tro- chanter), Fe (femur), Ti (tibia), Ta5 (tarsus 5), Ta3 (tarsus 3), and Ta1 (tarsus 1) indicate the leg segment; F (field), G (group), and S (single) indicate arrangements; v (ventral), d (dorsal), a (anterior), and p (posterior) differentiate between similar arrangements on the same segment; and F (front), M (middle), and R (rear) designate the leg type.
F I G U R E 3 SEM images of CS on the ventral and posterior sides of the prothoracic leg. Arrowheads denote single CS or groups. Box in a denotes a field; (a, a1) ventral femur and trochanter, box in a denotes FeFF; (b, b1) ventral, proximal tibia; three arrowhead denote TiGvF; (c, c1) ventral, distal fifth tarsal segment, four arrowheads denote Ta5GF; (d, d1) posterior trochanter and proximal, dorsal femur; three arrowheads in d denote TrGF, single arrowhead in d denotes FeSF, bracket in d denotes TrFpF; three arrowheads in d1 denote TrGF; (e, e1) ventral side of the first tarsal segment; arrowhead denotes Ta1SF; scale bars: 15μm; colored 3D reconstruction ofμCT data (center) serves as reference [Color figure can be viewed at wileyonlinelibrary.com]
3 | R E S U L T S
3.1 | Prothoracic leg (front leg)
The CS of the prothoracic leg were comprised of two fields, six groups, and two single CS (Figures 2 and 3). The two fields of CS were on the trochanter and femur. The trochanteral field (TrFF; Figure 2d, d1) was on the dorsal side and divided into two subfields by a cuticu- lar ridge. The larger, more posterior subfield (TrFpF) commonly con- tained eight CS; in one of the eight flies we examined (thereafter indicated as 1/8) it contained seven. The smaller, more anterior sub- field (TrFaF) always contained five CS (7 flies). All of these CS had an eccentricity closer to 1 than 0 (mathematically, a circle has an eccen- tricity of 0, while a noncircular ellipse has an eccentricity between 0 and 1). The second field (FeFF) was on the proximal end of the ven- tral femur (Figure 3a,a1). Here, we counted 10 (3/5 flies) and 11 (2/5 flies) CS arranged in three columns. In all flies, three of these CS were less eccentric than the other eight CS, the former of which had an eccentricity closer to 1. The FeFF, in comparison to other CS areas on all legs, was most commonly distorted by cuticular indentations.
Because of this, the counts reported for this region are to be consid- ered conservative.
The six CS groups on the prothoracic leg were found on the tro- chanter, tibia, and tarsus. On the posterior side of the trochanter, a group of three CS (TrGF) was found (10 flies; Figure 3d,d1). On both the dorsal and ventral tibia, a group of CS was found toward the posterior end of the segment. The dorsal group (TiGdF; Figure 2e,e1) consisted of two CS (10 flies); the ventral group (TiGvF; Figure 3b1,b) consisted of three CS (9 flies). The relative arrangement of the three CS in TiGvF was variable, ranging from triangular to linear (compare Figures 3 and 10). However, the CS in the middle of this group was consistently the smallest of the three and is less eccentric than the two neighboring CS. The three CS groups on the tarsus were located on the first (Ta1GF), third (Ta3GF), and fifth (Ta5GF) tarsomeres, respectively. In both Ta1GF (7 flies; Figure 2b,b1) and Ta3GF (6 flies; Figure 2c,c1), two CS were found on the dorsal, distal end of the respective tarsal segment.
In Ta5GF, we found three (1/5 fly) and four (4/5 flies) CS. These were located on the ventral, distal end of the segment (Figure 3c,c1).
Single CS were found on the femur and the first tarsal segment.
The single femoral CS (FeSF) was on the dorsal, more posterior side
F I G U R E 4 SEM images of CS on the dorsal side of the mesothoracic leg; arrowheads denote single CS or groups; brackets denote CS fields.
(a, a1) Dorsal trochanter and proximal femur; bracket in A denotes TrFaM, single arrowhead in a and a1 denotes FeSM; (b, b1) dorsal and distal part of the first tarsal segment; arrowheads denote Ta1GM; (c, c1) dorsal and distal part of the third tarsal segment, arrowheads denote Ta3GM;
(d, d1) CS field on the dorsal trochanter, bracket indicates TrFM; TrFM can be subdivided into two subfields separated by a cuticular ridge (marked by black arrowhead in d1); (e, e1) dorsal, proximal tibia; arrowheads denote TiGdM; scale bars: 15μm; colored 3D reconstruction ofμCT data (center) serves as reference [Color figure can be viewed at wileyonlinelibrary.com]
(10 flies; Figure 2a,a1), whereas the single tarsal CS on the first tarsal segment (Ta1SF) was on the ventral side (8 flies; Figure 3e,e1). FeSF was less eccentric than Ta1SF. In spite of its large volume no CS was observed on the Coxa (Cx).
3.2 | Mesothoracic leg (middle leg)
The mesothoracic leg had CS in the same locations as the prothoracic leg. Unless stated otherwise, the CS of the mesothoracic leg were like those of the prothoracic leg (Figures 4 and 5). The trochanteral field (TrFM) consisted of two subfields. The larger subfield (TrFpM), located more posteriorly, contained seven (1/9 fly) or eight CS (8/9 flies) as in TrFpF. The fly with seven CS in TrFpM was not the same fly as the one with seven CS in TrFpF. The smaller, anterior subfield (TrFaM) contained four (1/10 fly) or five CS (9/10 flies) (Figure 4d,d1). As in the trochanteral field of the forelegs, all of these CS had an eccentric- ity closer to 1. The CS in the femoral field (FeFM; Figure 5a,a1) were arranged in column-like structures on the ventral, proximal side of the femur. It consisted of 11 (8/9 flies) or 12 CS (1/9 fly). Three of these
CS were less eccentric than the other eight or nine CS, as was the case in FeFF.
The group of CS on the posterior surface of the trochanter (TrGM) consistently had three CS (6 flies; Figure 5d,d1). Unlike in the prothoracic leg, the number of CS in the ventral tibial group (TiGvM) varied; one of 12 flies had two CS, while all others had three (Figure 5b,b1). The dorsal group (TiGdM) had two CS as in TiGdF (11 flies; Figure 4e,e1). As seen in the prothoracic leg, the relative positions of both the dorsal and ventral tibial CS were variable and the middle CS of TiGvM had a lower eccentricity than the other two CS. As in the prothoracic legs, the CS groups on the first (Ta1GM;
6 flies) and third (Ta3GM; 8 flies) tarsal segments contained two CS (Figure 5a,a1,c,c1), whereas the fifth tarsal segment had four (Ta5GM;
6 flies; Figure 5c,c1).
The single CS on the femur (FeSM) was on the dorsal side with a shift to a more anterior, proximal location than the corresponding CS on the prothoracic leg (10 flies; Figure 11). The single CS on the first tarsal segment (Ta1SM; 11 flies; Figure 5e,e1) was on the ventral side as in Ta1SF. FeSM had a lower eccentricity than Ta1SM, as in the prothoracic leg.
F I G U R E 5 SEM images of CS on the ventral and posterior sides of the mesothoracic leg; arrowheads indicate single CS or groups; boxes indicate CS fields. (a, a1) Ventral femur and trochanter; box denotes FeFM; (b, b1) ventral, proximal tibia; arrowheads denote TiGvM; (c, c1) ventral, distal side of fifth tarsal segment, four arrowheads denote Ta5GM; (d, d1) ventral, posterior side of trochanter and proximal femur; box denotes FeFM, three arrowheads in d and d1 denote TrGM; (e, e1) ventral first tarsal segment; arrowhead denotes Ta1SM; scale bars: 15μm;
colored 3D reconstruction ofμCT data (center) serves as reference [Color figure can be viewed at wileyonlinelibrary.com]
3.3 | Metathoracic leg (rear leg)
The metathoracic leg had CS in the same locations as the meso- and prothoracic legs. Unless stated otherwise, the CS of the metathoracic leg are like those of the pro- and mesothoracic legs (Figures 6 and 7).
The number of CS in the more posterior trochanteral subfield (TrFpR) varied (eight CS in 5/9 flies, seven CS in 4/9; Figure 6d,d1), which is in contrast to the pro- and mesothoracic legs, where most flies had eight CS and one sample from each leg type had seven CS. In the more anterior subfield (TrFaR), all flies imaged had five CS (11 flies;
Figure 6d,d1) as per TrFaF and TrFaM.
The CS in the femoral field (FeFR) were also arranged into three columns; this field contained 11 (4/5 flies) or 12 CS (1/5 fly; Figure 7a, a1). As in the other legs, three of the CS were less eccentric than the other eight CS. The fly with 12 femoral field CS (FeFF) was not the same fly as the one with 12 CS in the mesothoracic femoral field (FeFM).
The group on the posterior side of the trochanter (TrGR) con- tained three CS (7 flies; Figure 7d,d1), whereas the dorsal, tibial group
(TiGdR) contained two CS (10 flies; Figure 6e,e1) and the ventral group (TiGvR) three CS (9 flies; Figure 7b,b1). As seen in the pro- and mesothoracic legs, the relative positions of both the dorsal and ventral tibial CS was variable, and the middle CS of TiGvM had a lower eccen- tricity than the other two CS. The first (Ta1GR; 6 flies; Figure 6b,b1) and third (Ta3GR; 8 flies; Figure 6c,c1) tarsal segments contained two CS; the fifth tarsal segment had four CS (Ta5GR; 3 flies), consistent with the other legs.
Single CS can be found on the femur and the first tarsal seg- ment. The CS on the femur (8 flies; FeSR) was to the more anterior side of the dorsal side as in FeSM (11 flies); however, FeSR was more distal than FeSM. A single CS (Ta1SR) was found on the first tarsal segment on the ventral side (6 flies); this CS differed in its location on the metathoracic leg compared to the other legs.
Unlike Ta1SM and Ta1SF legs where this CS was close to the seg- ment's ventral midline, the metathoracic CS was more to the ante- rior side. FeSR had a lower eccentricity than Ta1SR as in other legs.
F I G U R E 6 SEM images of CS on the dorsal side of the metathoracic leg. Arrowheads denote single CS or groups; brackets denote CS fields.
(a, a1) Dorsal trochanter and proximal femur, arrowheads in a1 denote FeSR, bracket in a denotes TrFR, arrowheads denote FeSR; (b, b1) dorsal, distal side of the first tarsal segment, arrowheads denote Ta1GR; (c, c1) dorsal, distal side of the third tarsal segment, arrowheads denote Ta3GR;
(d, d1) dorsal, trochanteral CS field, bracket denotes TrFR; this field is subdivided into two subfields TrFaR and TrFpR by a cuticular ridge (denoted by a black arrowhead in d1), arrowheads in d denote the location of TrGR. (e, e1) dorsal side of the proximal tibia, arrowheads denote TiGdR; scale bars, 15μm; colored 3D reconstruction ofμCT data (center) serves as reference [Color figure can be viewed at
wileyonlinelibrary.com]
3.4 | Variability among legs
Flies exhibited variability in the number and precise locations of CS. The variability described here is not due to a single, malformed fly, but rather represents a spectrum of variability seen in multiple individuals.
From the 14 flies, three legs (one front, one middle, and one rear leg) did not have any occlusions so they could be imaged at all CS locations. These three legs had 42 (front, middle) and 41 CS (rear).
The numerical variability observed in leg CS is summarized in Figure 8.
The two single CS (Fe1S and Ta1S), the three groups with two sensilla (TiGd, Ta1G, and Ta3G), and one of the groups with three sensilla (TrG) showed no variability. The other group with three sensilla (TiGv), the group with four sensilla (Ta5G), and a field with five sensilla (TrFa) were consistent in their number of CS with the exception of one case with one sensillum fewer. Two fields with typically 8 and 11 sensilla (TrFp and FeF, respectively) showed the largest variability; TrFp had 7 sensilla in 6 out of 28 samples, and FeF had 10 or 12 sensilla in five of 20 samples. Thus, as a general rule, numerical variability was higher when there were larger numbers of sensilla, and little numerical vari- ability if any was seen for groups with fewer than four sensilla.
Variability was observed not only in terms of sensilla numbers but also in their morphology, arrangement, and locations. For example, one out of the 28 observed TrFp seemingly developed a hair-like shaft instead of reg- ular cap structure (Figure 9a). In addition, the arrangement of CS within TrFa showed variability across individuals (Figure 9). Figure 9a shows a TrFaM with three CS aligned in a row and two CS distally adjacent.
Figure 9b–g shows similar arrangements of CS, with four CS aligned in a crescent shape and another CS distally adjacent. Figure 9h shows a similar pattern, with four CS in a crescent arrangement, but this sampled lacked a fifth CS. Moreover, in the case of Figure 9i, all five CS were aligned in one row. Variability in distribution was observed in the larger, posterior subfield TrFp; here, three CS were commonly aligned in one proximal row, with five further CS aligned distally in a row (Figures 2d1 and 6d1). In some cases, the proximal and distal rows contained four CS each (Figure 4d1).
A further example of variability in the arrangement of CS within a group was the position of the three CS on the ventral tibia (TiGv), with examples of the varying positions shown in Figure 10. The smallest of the three CS in this group was consistently in the middle position; the relative positions of the two neighboring CS varied, forming either a triangular (Figure 10a–c) or linear (Figure 10d–f) arrangement. Similar positional variability was observed in all the three legs.
F I G U R E 7 SEM images of CS on the ventral and posterior sides of the metathoracic leg; arrowheads denote CS; boxes denote CS fields.
(a, a1) Ventral femur and trochanter, box denotes FeFR; (b, b1) ventral, proximal side of tibia, three arrowheads denote TiGvR; (c, c1) ventral, distal side of fifth tarsal segment, arrowheads denote Ta5GR; (d, d1) ventral, posterior side of the trochanter and proximal femur, box denotes FeFR, arrowheads in d and d1 denote TrGR; (e, e1) ventral side of first tarsal segment, arrowhead denotes Ta1SR; scale bars, 15μm; colored 3D reconstruction ofμCT data (center) serves as reference [Color figure can be viewed at wileyonlinelibrary.com]
In addition to the variability in the positions within groups and fields, single CS showed differences in their locations. Whereas groups and fields showed interindividual differences within the same leg type, the location of single CS was consistent among individuals but different between the pro-, meso-, and metathoracic legs.
The single CS of the femur (FeS) is on the dorsal side of all three leg types. There were, however, differences between the leg types in its precise position along the anterior–posterior and proximal–distal axes. FeSF was located toward the posterior side of the femoral midline (Figure 11a,a1), FeSM on the anterior side of the femur at the proximal edge bordering the trochanter (Figure 11b,b1), and FeSR on the anterior side of the midline, simi- lar to FeSM, but in a more distal position (Figure 11c,c1). The single CS of the first tarsomere (Ta1S) also showed a similar leg type- specific positioning. Ta1SF and Ta1SM were located centrally on the midline of the segment, whereas Ta1SR was located just ante- rior to the midline.
3.5 | Head and abdomen
Compared to the CS in the legs, those in other body parts have been described more extensively. We nevertheless examined them thor- oughly to confirm or update the current knowledge.
Previous studies have not reported any CS other than those on the legs, wings, halteres, and the thorax near the haltere base. We examined the rest of the body parts carefully to possibly extend previ- ous description, but did not find any further CS in these locations.
3.6 | Thorax
After removal of the haltere, a group of two CS on the metathoracic papil- lae can be seen at the base of haltere. We believe that these CS are those previously described by Cole and Palka (1982) as Met.Pap. (Figure 12).
The group, containing two highly eccentric CS, was on the metanotum in close proximity to the proximal scabellum (Figure 12c,d); this differs from Cole and Palka's (1982) description of the Met.Pap. as being on the dorsal haltere surface. We did not find any further CS elsewhere on the thorax.
3.7 | Wings
The CS on the wings have been previously described (e.g., Cole &
Palka, 1982; Huang et al., 1991). Our careful re-examination con- curred with these reports; however, minor tweaks to their naming and grouping must be made. In the following, we present the wing CS that our data confirm along with the numbers reported in Cole and
F I G U R E 8 Number of CS at specific locations in the legs; each data point represents one sample, colors represent legs (green, prothoracic; yellow, mesothoracic;
magenta, metathoracic); TrFp, trochanteral field posterior subfield;
TrFa, trochanteral field anterior subfield; TrG, trochanteral group;
FeF, femoral field; FeS, single femoral CS; TiGd, dorsal tibia group; TiGv, ventral tibia group;
Ta1S, first tarsomere single CS;
Ta1G, first tarsomere group; Ta3G, third tarsomere group; Ta5G, fifth tarsomere group [Color figure can be viewed at wileyonlinelibrary.com]
Palka (1982) in parentheses. On the wing hinge are the anterior notal wing process (ANWP, 3 CS, Figure 13c) and tegula (Teg. 18 CS, Figure 13a,b). On the radius, from proximal to distal, are the dorsal radius CS d.Rad.A (4 CS), d.Rad.B (7 CS), and d.Rad.C (17 CS;
Figure 13a,e–h) as well as the ventral radius CS v.Rad.A (4 or 5 CS) and v.Rad.B (3 CS; Figure 15d–h,j). On the medial radius are the dorsal radius CS d.Rad.D (4 CS), and d.Rad.E (8 CS; Figure 13a,i,j) and the ventral radius CS v.Rad.C (5 CS; Figure 15d,j–l). On the distal radius are the dorsal humeral cross vein CS (d.HCV, 1 CS; Figure 14a,b,e), ventral humeral cross vein CS (v.HCV, 1 CS; Figure 15i), and the dorsal giant sensillum of the radius CS (GSR, 1 CS; Figure 14a). All CS loca- tions from the hinge to the medial radius contain groups or fields.
On the dorsal wing blade are the twin sensilla of the margin TSM-1 (1 CS) and−2 (1 CS; Figure 14a,c,d), the anterior cross-vein CS (ACV,
1 CS; Figure 14a,g), and longitudinal vein CS L3-1 (1 CS), L3-2 (1 CS), L3-3 (1 CS; Figure 14a,h–j). On the ventral wing blade are the humeral cross vein CS v.HCV (1 CS; Figure 15i) and the longitudinal vein CS L3-V (1 CS; Figure 15a–c). The sensilla on the wing blade are all single CS.
We found one notable difference from the previous descrip- tions by Cole and Palka (1982) and Huang et al. (1991). A single CS, which we named v.Rad.C.1, was located approximately 15μm distal to the most distal CS of the v.Rad.C group (Figure 15j–l). This CS has previously been grouped together with v.Rad.C. However, because of the larger distance between v.Rad.C.1 and the remaining v.Rad.C CS and because of the clear morphological dif- ferences between them, we defined this CS as a single CS instead of one of the v.Rad.C group.
F I G U R E 9 SEM images of CS on the dorsal side of the mesothoracic trochanter. Arrowheads denote CS. (a) Complete trochanteral CS field (TrFM); black arrowhead marks a CS in the posterior subfield TrFpM containing a hair shaft. Five arrowheads on the right denote the anterior subfield TrFaM; (b–i) anterior trochanteral CS subfield (TrFaM) from eight individuals; scale bars, 15μm
F I G U R E 1 0 SEM images of CS on the ventral side of the metathoracic tibia; arrowheads denote CS. (a–f) Tibial CS groups (TiGvR) in 6 individuals; note the variable arrangement of CS on the different legs. Scale bars: 15μm
F I G U R E 1 1 SEM images of CS on the dorsal femur (proximal end) of pro-, meso-, and metathoracic legs. Each image is from a different individual. (a, a1) FeSF on the prothoracic femur; (b, b1) FeSM CS on the mesothoracic femur; (c, c1) FeSR CS on the metathoracic femur; scale bars: 15μm [Color figure can be viewed at wileyonlinelibrary.com]
Only approximate numbers have been reported for the wing CS in previous studies, suggesting interindividual variability. Here, we also found interindividual differences in the number of CS. For example, as seen in Figure 13g,h, the same field in two flies showed different numbers of CS (one had 4, the other 5). Likewise, the d.
Rad.C had 17 CS in one fly (Figure 13e) and 18 in another (Figure 13f).
3.8 | CS in the halteres
Our examination of the haltere mostly confirmed previous reports.
The dorsal haltere contains two CS fields on the scabellum and pedicellus and two single CS, also on the scabellum and pedicellus (Figure 16). We found that the d.Scab (dorsal scabellum) field con- tained 44 CS (Figure 16e–g). Chevalier (1969) reported roughly 45 sensilla here, and Cole and Palka (1982) reported 42. The d.Ped (dorsal pedicellus) field contained 43 CS (Figure 16i–k).
We observed two single CS (d.Scab.s, d.Ped.s) at the anterior- most ends of the d.Scab and d.Ped groups (Figure 16h,j,l). These single CS have previously been included with their respective fields (Cole &
Palka, 1982); however, we believe that they should be distinguished as single CS because they clearly differ in their morphological charac- teristics from those of the nearby fields.
On the ventral side of the haltere, we observed one field of CS on the pedicellus (v.Ped; Figure 17c–f,h) and one group on the scabellum (v.Scab; Figure 17g–i). v.Ped contained approximately 39 CS; how- ever, counting them was difficult due to their placement. Cole and Palka reported 46 v.Ped CS in their 1982 study. We counted four CS in the v.Scab group on the scabellum (Figure 17g–i), and Cole and Palka (1982) reported five CS. Our results define v.Scab as a group;
however, as a finding of five CS as in Cole and Palka (1982) would classify it as a field, this highlights the arbitrariness of distinctions between arrangements.
3.9 | Surface structure of the CS caps
The external surface of most CS is very smooth. However, we found that CS caps at some locations sometimes, but rarely, contain depres- sions and elevations in the surface, ranging in diameters from 3 to 5 nm. Depressions were seen on the Ta5S and TiGvM (Figure 18a,b) and just outside of the collar of the FeS (Figure 18c). At the current resolution of SEM images, it is not clear whether these depressions would correspond to only local thinning of the cuticle or holes that penetrate the cuticle. Further investigations are needed to clarify whether such structures do occur regularly and play a role in the func- tion of CS caps.
F I G U R E 1 2 SEM images of CS on the metanotum of the thorax. (met.Pap.; same CS location as in Figure 16c,d); (a) lateral thorax with attached haltere; (b) lateral thorax with haltere removed; (c–f) different magnifications and angles depicting CS at base of haltere; white arrowheads mark locations of CS; scale bars in (a) and (b), 100μm; scale bars in (c–f): 10μm [Color figure can be viewed at
wileyonlinelibrary.com]
4 | D I S C U S S I O N
We generated a comprehensive and detailed catalogue of all CS on the entire body of femaleD. melanogasterand documented CS anat- omy throughout the body using high-resolution SEM images. In total, we found over 680 sensilla arranged in 26 fields, 54 groups, and 34 single CS. Based on previous work (Joel et al., 2018; Merritt &
Murphey, 1992; Yasuyama & Salvaterra, 1999), it is likely that CS in males are at the same locations as in females.
While robust locations and relatively consistent numbers of CS were found, some interindividual variability in the number of CS was observed on the legs (Figure 8) and on the wings and halteres (Figure 13). However, this is minor compared to the interindividual variability that can be seen in, for example, the dorsal cluster neurons of the visual system (Linneweber et al., 2020) or gustatory and olfac- tory sensilla on the locust palps and antennae (Rogers & Simpson, 1997). The group and field CS on the legs showed interindividual
variability in terms of relative arrangements within each leg. Two sin- gle leg CS showed consistent interleg variability in terms of their pre- cise positions. Throughout the study, only four locations showed variability in the number (±1 CS) (Figure 8).
4.1 | Naming CS on the body and the legs of the fruit fly
Previous studies have investigated the locations and structures of CS on the wings, halteres, and front legs of theD. melanogasterand have suggested multiple naming schemes (Cole & Palka, 1982; Merritt &
Murphey, 1992; Palka et al., 1979). The present study extends insights into the distribution of CS on the body and appendages of D. melanogasterwith the inclusion of all legs and observations of mul- tiple individuals. Our results indicate the need for an appropriate nam- ing scheme that will allow for differentiation between CS on each pair F I G U R E 1 3 SEM images of CS locations on the dorsal wing base; CS indicated by arrowheads, colored lines, and boxes; colors consistently indicate CS location across magnifications in this figure; (a) ANWP, tegula, and proximal radius; (b) CS of the tegula (white: Teg.); (c) CS of the ANWP (red: ANWP); (d) proximal (pR) and medial radius (mR); (e–h) CS fields and group of the proximal radius from two different flies; same orientation as in (d; yellow: d.Rad.B, magenta: d.Rad.C, orange: d.Rad.A); (i) medial radius CS (cyan: d.Rad.E, green: d.Rad.D); (j) anterior medial radius CS (green, d.Rad.D); ANWP, anterior notal wing process; T, tegula; pR, proximal radius; mR, medial radius; scale bars: 10μm [Color figure can be viewed at wileyonlinelibrary.com]
of legs and each segment of a leg. Therefore, we extended the given naming scheme for CS on the legs to include information about seg- ments, arrangements, relative locations, and leg type. This extension is still in line with the previous literature, but allows for the naming to serve as more precise map of CS. This is necessary given the leg- specific sensitivity and functional roles of individual CS and fields of CS along an insect leg (Zill et al., 2018).
4.2 | CS locations on the legs
The locations of CS on the legs ofD. melanogasterhave been previ- ously described in two publications, with a focus on the prothoracic leg (Merritt & Murphey, 1992; Yasuyama & Salvaterra, 1999). Both publications show three CS on the posterior trochanter as well as a
field of five CS on the dorsal, more posterior trochanter. Merritt and Murphey (1992) also identify a field of eight CS on the more anterior, dorsal trochanter. We also found these fields; the three CS of the pos- terior trochanter make up the TrGF, and the two fields with typically five or eight CS are named TrFaF and TrFpF herein, respectively. Both previous studies also show 11 CS on the proximal, ventral femur, corresponding to FeFF; notably, this field also showed numerical vari- ability in the present study among individuals.
On the proximal, dorsal side of the femur, they describe a single CS, which is described as FeSF in our study. The location of this CS varied between the three leg types. They further identify three CS on the ven- tral tibia and two CS on the dorsal tibia, which we also found as TiGvF and TiGdF, respectively. On the first tarsal segment, a single CS is seen on the ventral side of the segment. We found that this CS, Ta1SF, is located more anteriorly on the hind leg than in the middle and front legs.
F I G U R E 1 4 SEM images of CS locations on the dorsal wing blade; (a) the dorsal wing; colored arrowheads consistently indicate CS location across magnifications in this figure. (b) dorsal humeral cross-vein (d.HCV; white arrowhead,) and giant sensillum of the radius (GSR; black arrowhead,); (c,d) twin sensilla of the margin (TSM 1&2); (e) d.HCV; (f) GSR; (g) sensillum of the anterior cross-vein (magenta, ACV); (h) most proximal sensillum of the third wing vein (cyan, L3-1); (i) second sensillum of the third wing vein (yellow, L3-2); (j) most distal sensillum of the third wing vein (orange, L3-3). Scale bar in (a): 1,000μm; scale bars in (b–j): 10μm [Color figure can be viewed at wileyonlinelibrary.com]
F I G U R E 1 5 SEM images of CS locations on the ventral wing; CS are indicated by arrows and brackets. Arrowhead colors label the same CS across images in this figure. (a) Ventral humeral cross-vein sensillum (v.HCV; orange) and the sensillum on the third cross vein (L3-V,white:); (b,c);
L3-V; (d) proximal (magenta, cyan) and partial view of medial (green) radius; (e) proximal radius; (f–g) view of more proximal CS on the proximal radius (magenta: v.Rad.A); (h) view of distal CS on the proximal radius (cyan: v.Rad.B); (i) view of the v.HCV CS; (j) overview of the radius;
(k) medial radius; (l) view of CS of the medial radius (green [v.Rad.C] and yellow [v.Rad.C.1] arrowheads). Scale bars in (a) and (b): 100μm; scale bars in (c–l): 10μm [Color figure can be viewed at wileyonlinelibrary.com]
On the first and the third tarsal segments, the distal most ends have two CS on the dorsal side. These are Ta1GF and Ta3GF, respectively. On the fifth tarsal segment, Merritt and Murphy (Merritt & Murphey, 1992) show four CS on the dorsal, distal end, whereas Yasuyama and Salvaterra (1999) show two CS at this loca- tion. Joel et al. (2018) also show four CS at this location (leg type unspecified). However, they identified these to be on the ventral instead of the dorsal side of the segment. We also found four CS (Ta5GF) on the ventral side of the fifth tarsal segments on all three legs.
Another study by Hoikkala and Moro (2000) did not specify the leg type used for investigation but presented CS locations on the leg.
They included a schematic showing two fields on the dorsal trochan- ter and a group of three CS on the distal trochanter as well as a field of CS and a single CS on the ventral, proximal femur. Also, in this schematic were CS on the ventral and dorsal tibia, the ventral first tar- sal segment, and the dorsal, distal end of the first and third tarsal seg- ments. However, the data reported herein demonstrate that specific locations of CS differ between the three leg types. This underlines the importance of a segment-dependent anatomical description of CS for
further studies on the role of load and force sensors on the legs of D. melanogaster.
CS are arranged in fields, groups, and as single CS on the legs, and these locations were consistent between all legs and individuals tested. However in a few cases, within these arrangements, inter- individual differences in number and precise positioning of individual CS became apparent (Figure 8).
4.3 | Interleg variability in CS location
Interleg variability was seen solely in the locations of the two single CS on the legs. The single CS of the femur, for example, is located on the dorsal, proximal end of the femur in all legs; however the relative position of this CS is dependent on the leg type. FeSF is on the more posterior side of the femur's midline, whereas FeSM and FeSR are to the anterior side of the midline. FeSM is additionally more proximal than FeSR. The other single CS, Ta1S, is similarly located on the front and middle legs; on the hind leg (Ta1SR), it is more anterior to the tar- sal midline.
F I G U R E 1 6 SEM images of CS on the dorsal haltere; arrowhead colors consistently indicate CS location across magnifications in this figure;
brackets indicate fields; (a) dorsal thorax, anterior abdomen, and dorsal haltere; (b) Haltere with dorsal [green (d.Scab), magenta (d.Ped)] and ventral [white (v.Ped.)] fields indicated; (c) Scabellum field (green, d.Scab) and metanotum CS (Met. Pap.) (cyan); (d) magnified view of the metanotum CS (Met. Pap.; cyan); (e–h) dorsal scabellum field (green, d.Scab) and single CS (green arrowhead, d.Scab.s); (i–l) dorsal pedicellus field (magenta, d.Ped) and single CS (magenta arrowhead, d.Ped.s); scale bar in (a): 100μm; scale bars in (b–l): 10μm [Color figure can be viewed at wileyonlinelibrary.com]
F I G U R E 1 7 SEM images of CS on the ventral haltere; (a–c) ventral thorax, anterior abdomen, and ventral haltere in different
magnifications; S, scabellum; P, pedicellus; C, capitellum; (d–f) ventral pedicel CS field (v.Ped.); (g–i) ventral scabellum group (v.Scab); box indicates pedicel field; scale bar in (a): 100μm; scale bars in (b–i): 10μm [Color figure can be viewed at wileyonlinelibrary.com]
F I G U R E 1 8 SEM images of CS Ta5SM, TiGvM, and FeSM. These show crater-like indentations on the caps (a, b) as well as around the outside of the CS (c); scale bar: 2μm
At present, it is unclear what consequences different locations of CS have for their functions; given the knowledge from other insects (Zill et al., 2011; Zill et al., 2017; Zill, Chaudhry, Büschges, &
Schmitz, 2015) it is conceivable that differences in location would mean differential sensitivities of CS. This might then affect their func- tional roles in generating sensory feedback about strain within the leg's cuticle. The three leg pairs of insects differ both morphologically and functionally (Cruse, 1976; Dallmann, Dürr, & Schmitz, 2016). In D. melanogaster, the front (prothoracic) leg is clearly identifiable by its larger coxa, and the hind (metathoracic) leg is the longest of the three (Mahfooz et al., 2007). Our results show that the three pairs of legs show specific variability in the location of the single CS on the dorsal femur; as explained earlier it is more posterior on the front leg than on the middle and hind legs and more distal on the hind leg than on the middle leg. Studies have shown that the front legs are involved in grooming behavior (Seeds et al., 2014), balancing, and searching for a foothold (Harris & Ghiradella, 1980). Middle legs produce the main jump force (Zumstein, 2004) and support stability (Cruse, 1976).
Hindlegs provide the propulsive force to push the body forward dur- ing walking (Cruse, 1976; Dürr, 2001; Zill et al., 2017), whereas front legs pull the body forward. Thus, the direction of physical strain that occurs in the femur might differ between these legs. It was shown in the stick insect, for example, that the three leg types differ markedly in their functional role in the generation of force production during walking (Cruse, 1976; Dallmann et al., 2016; Dallmann, Hoinville, Dürr, & Schmitz, 2017). CS on the more posterior location of the front leg (FeSF and Ta1S) might be more sensitive to the contracting physi- cal strain when the front leg is flexed to pull the body forward, whereas those in the more anterior location of the hindleg (FeSR and Ta1R) might be more sensitive to the stretching physical strain when the hindleg extends to push the body forward.
Additionally, specific behaviors are executed differently by each leg type; for example, in stick insects (Carausius morosus), searching behaviors differ between the three legs in their protraction/retraction movements (Dürr, 2001). Due to the differences in CS location etc.
between the three leg types, it is conceivable that leg type-specific movements might cause different cuticular strains which, in turn, have to be encoded by differently organized CS configurations.
4.4 | Interindividual variability in CS arrangement and morphology
The general locations of CS in the current study were found to be consistent between individuals. However, the precise arrangement of CS at their respective locations differed (Figures 9 and 10). This find- ing suggests that the influence of sensory feedback from CS might be either rather generally affecting the activity of motor circuits or that differences in precise positioning in the cuticle corresponds to individ- ual properties of the cuticle, leading to similar activity between the CS in different animals. In addition to the potential functional effects, this variability in arrangement may in part be because of cell fate
determination in the proneural cluster, an equivalence group of cells from which the external sensory structures develop (Simpson, 1990).
As all the cells within the cluster have the potential to become the sensory organ progenitor cell, but only one of them does so, minor variation in the location of the resulting cell is possible.
The present and previous studies demonstrate that different mor- phological types of CS exist within D. melanogaster. Cole and Palka (1982) analyzed the wings and halteres and described six differ- ent types of CS based on their roundness, profile, and the existence of the socket structure; that is, (a) circular, high-profile with socket;
(b) Circular, high-profile without socket; (c) circular, low-profile with socket; (d) circular, low profile without socket; (e) elliptical, high profile with socket; and (f) elliptical, low profile with socket.
However, based on the data collected in this study and due to methodological restrictions of the SEM imaging, categorization into distinct classes based on shape might oversimplify the reported CS diversity. Given the fact that the delineation between circular and elliptical shapes is complicated by the viewing angle of the SEM, it appears that a more quantitative morphological analysis is needed to identify whether CS exhibit a continuum of shapes or whether CS can be categorized into distinct groups of circular or elliptical or more major forms. Previous studies have shown that highly elliptical CS measure orientation-specific strains (Zill et al., 1981; Zill &
Moran, 1981a, 1981b). In the present study, we were only able to describe CS shape as varying degrees of eccentricity.
Differences in CS morphology within a given location might sug- gest the presence of variable strain and/or the need for differential sensitivity. The morphology of some sensilla, like the single CS on the dorsal haltere (d.Ped.s; Figure 16) and those on the dorsal third wing vein (ACV, L3-1, L3-2, L3-3; Figure 14), is very similar even though they are on different appendages. This suggests that these CS may share similar responsivity or tuning characteristics, and that these locations of the body might experience similar strains.
A C K N O W L E D G M E N T S
We would like to thank Hans-Peter Bollhagen, Frank Nitsche, Michael Bonkowski, and the University of Cologne Biocenter Imag- ing Facility for imaging and technical support. A. S. C. was funded by the German Research Foundation (RRID:SCR_012420, Deutsche Forschungsgemeinschaft) grant 233886668/GRK1960. A. S. C. and G. F. D. are members of the Graduate School for Biological Sciences at the University of Cologne; A. S. C., G. F. D., K. I., and A. Büschges are members of the DFG-RTG1960“Neural Circuit Analysis on the Cellular and Subcellular Level.” A. Blanke was supported by the European Research Council (ERC) under the European Union's Hori- zon 2020 research and innovation program (grant agreement No. 754290,“Mech-Evo-Insect”).
C O N F L I C T O F I N T E R E S T
Gesa F. Dinges, Alexander S. Chockley, Till Bockemühl, Kei Ito, Alex- ander Blanke, and Ansgar Büschges declare that they have no conflict of interest.
A U T H O R S ' C O N T R I B U T I ON S
Gesa F. Dinges: conceptualization; data curation; formal analysis; writ- ing original draft; review and editing; Alexander S. Chockley: concep- tualization, writing original draft, review and editing; Till Bockemühl:
conceptualization, data analysis, validation, review; Alexander Blanke:
conceptualization, validation, review; Kei Ito: conceptualization, review and editing; Ansgar Büschges: conceptualization, validation, review and editing, funding acquisition.
P E E R R E V I E W
The peer review history for this article is available at https://publons.
com/publon/10.1002/cne.24987.
D A T A A V A I L A B I L I T Y S T A T E M E N T
The data that support the findings of this study will be openly avail- able at https://uni-koeln.sciebo.de/s/zxPiRV0CjRd6GKq.
O R C I D
Gesa F. Dinges https://orcid.org/0000-0002-1759-738X Alexander S. Chockley https://orcid.org/0000-0002-5060-6786 Till Bockemühl https://orcid.org/0000-0002-6213-8107 Ansgar Büschges https://orcid.org/0000-0003-2123-1900
R E F E R E N C E S
Akay, T., Haehn, S., Schmitz, J., & Büschges, A. (2004). Signals from load sensors underlie interjoint coordination during stepping movements of the stick insect leg.Journal of Neurophysiology,92(1), 42–51.
Akay, T., Ludwar, B. C., Göritz, M. L., Schmitz, J., & Büschges, A. (2007).
Segment specificity of load signal processing depends on walking direction in the stick insect leg muscle control system.Journal of Neu- roscience,27(12), 3285–3294.
Backhaus, B., Sulkowski, E., & Schlote, F. W. (1984). A semi-synthetic, general-purpose medium forDrosophila melanogaster.Drosophila Infor- mation Service,60, 210–212.
Bässler, U. (1977). Sensory control of leg movement in the stick insect Car- ausius morosus.Biological Cybernetics,25(2), 61–72.
Burrows, M., & Pflüger, H. J. (1988). Positive feedback loops from proprio- ceptors involved in leg movements of the locust.Journal of Compara- tive Physiology A,163(4), 425–440.
Chevalier, R. L. (1969). The fine structure of campaniform sensilla on the halteres of Drosophila melanogaster. Journal of Morphology, 128, 443–463.
Cole, E. S., & Palka, J. (1982). The pattern of campaniform sensilla on the wing and haltere ofDrosophila melanogasterand several of its homeo- tic mutants. Journal of Embryology and Experimental Morphology, 71, 41.
Cruse, H. (1976). The control of body position in the stick insect (Carausius morosus), when walking over uneven surfaces.Biological Cybernetics, 24, 25–33.
Dallmann, C. J., Dürr, V., & Schmitz, J. (2016). Joint torques in a freely walking insect reveal distinct functions of leg joints in propulsion and posture control.Proceedings of the Royal Society B: Biological Sciences, 283(1823), 20151708.
Dallmann, C. J., Hoinville, T., Dürr, V., & Schmitz, J. (2017). A load-based mechanism for inter-leg coordination in insects. Proceedings of the Royal Society B: Biological Sciences,284(1868), 20171755.
Dean, J. (1991). Effect of load on leg movement and step coordination of the stick insectCarausius Morosus.Journal of Experimental Biology,159, 449–471.
Delcomyn, F. (1991). Activity and directional sensitivity of leg cam- paniform sensilla in a stick insect.Journal of Comparative Physiology A, 168, 113–119.
Dickinson, M. H. (1990). Comparison of encoding properties of cam- paniform sensilla on the fly wing.Journal of Experimental Biology,151 (1), 245–261.
Dickinson, M. H. (1992). Directional sensitivity and mechanical coupling dynamics of campaniform sensilla during chordwise deformations of the fly wing.Journal of Experimental Biology,169(1), 221–233.
Donelan, J. M., & Pearson, K. G. (2004). Contribution of force feedback to ankle extensor activity in decerebrate walking cats.Journal of Neuro- physiology,92, 2093–2104.
Dürr, V. (2001). Stereotypic leg searching movements in the stick insect:
Kinematic analysis, behavioural context and simulation. Journal of Experimental Biology,204, 1589–1604.
Duysens, J., Clarac, F., & Cruse, H. (2000). Load-regulating mechanisms in gait and posture: Comparative aspects. Physiological Reviews, 80, 83–133.
Gnatzy, W., Grünert, U., & Bender, M. (1987). Campaniform sensilla ofCal- liphora vicina(Insecta, Diptera): I. Topography. Zoomorphology, 106, 312–319.
Grünert, U., & Gnatzy, W. (1987). Campaniform sensilla ofCalliphora vicina (Insecta, Diptera).Zoomorphology,106, 320–328.
Harris, J., & Ghiradella, H. (1980). The forces exerted on the substrate by walking and stationary crickets. Journal of Experimental Biology, 85, 263.
Hofmann, T., & Bässler, U. (1982). Anatomy and physiology of trochanteral campaniform sensilla in the stick insect,Cuniculina impigra.Physiologi- cal Entomology,7, 413–426.
Hofmann, T., & Bässler, U. (1986). Response characteristics of single tro- chanteral campaniform sensilla in the stick insect,Cuniculina impigra.
Physiological Entomology,11, 17–21.
Hoikkala, A., & Moro, S. (2000). SEM search for sound production and sound perception organs in a variety of drosophila species.Microscopy Research and Technique,50(2), 161–168.
Huang, F., Dambly-Chaudiere, C., & Ghysen, A. (1991). The emergence of sense organs in the wing disc of drosophila. Development, 111(4), 1087–1095.
Hustert, R., Pflüger, J. H., & Bräunig, P. (1981). Distribution and specific central projections of mechanoreceptors in the thorax and proximal leg joints of locusts.Cell and Tissue Research,216, 97–111.
Joel, A. C., Adamova, H., & Bräunig, P. (2018). Mechanoreceptive sensillum fields at the tarsal tip of insect legs. Journal of Morphology, 279, 1654–1664.
Keil, T. A. (1997). Functional morphology of insect mechanoreceptors.
Microscopy Research and Technique,39, 506–531.
Kent, K. S., & Griffin, L. M. (1990). Sensory organs of the thoracic legs of the moth Manduca sexta.Cell and Tissue Research,259(2), 209–223.
Laurent, G. (1991). Sensory control of locomotion in insects.Current Opin- ion in Neurobiology,1, 601–604.
Lees, A. D. (1942). Homology of the Campaniform organs on the wing of Drosophila melanogaster.Nature,150, 375.
Linneweber, G. A., Andriatsilavo, M., Dutta, S. B., Bengochea, M., Hellbruegge, L., Liu, G., & Hassan, B. A. (2020). A neurodevelopmental origin of behavioral individuality in the drosophila visual system.Sci- ence,367(6482), 1112–1119.
Mahfooz, N., Turchyn, N., Mihajlovic, M., Hrycaj, S., Popadic, A., &
Fraser, J. (2007). Ubx regulates differential enlargement and diversifi- cation of insect hind legs.PLoS One,2, e866.
Merritt, D. J., & Murphey, R. K. (1992). Projections of leg proprioceptors within the CNS of the fly Phormia in relation to the generalized insect ganglion.Journal of Comparative Neurology,322, 16–34.
Moran, D. T., Chapman, K. M., & Ellis, R. A. (1971). The fine structure of cockroach Campaniform Sensilla. Journal of Cell Biology, 48, 155–173.
Moran, D. T., Rowley, J. C., Zill, S. N., & Varela, F. G. (1976). The mecha- nism of sensory transduction in a mechanoreceptor. Functional stages in campaniform sensilla during the molting cycle.Journal of Cell Biology, 71, 832–847.
North, G., & Greenspan, R. J. (2007).Invertebrate neurobiology, cold Spring Harbor monograph series. Cold Spring Harbor, NY: Cold Spring Harbor Laboratory Press.
Orlovsky, G., Deliagina, T. G., & Grillner, S. (1999).Neuronal control of loco- motion: From mollusc to man, Oxford, United Kingdom: Oxford Univer- sity Press.
Palka, J., Lawrence, P. A., & Hart, H. S. (1979). Neural projection patterns from homeotic tissue of drosophila studied in bithorax mutants and mosaics.Developmental Biology,69, 549–575.
Pearson, K. G. (1972). Central programming and reflex control of walking in the cockroach.Journal of Experimental Biology,56, 173–193.
Pohl, H. (2010). A scanning electron microscopy specimen holder for view- ing different angles of a single specimen.Microscopy Research and Technique,73, 1073–1076.
Pringle, J. W. S. (1938). Proprioception in insects: I. A new type of mechan- ical receptor from the palps of the cockroach.Journal of Experimental Biology,15, 101–113.
Rogers, S. M., & Simpson, S. J. (1997). Experience-dependent changes in the number of chemosensory sensilla on the mouthparts and antennae of Locusta migratoria. Journal of Experimental Biology, 200(17), 2313–2321.
Schmitz, J. (1993). Load-compensating reactions in the proximal leg joints of stick insects during standing and walking.Journal of Experimental Biology,183(1), 15–33.
Schmitz, J., & Stein, W. (2000). Convergence of load and movement informa- tion onto leg motoneurons in insects.Journal of Neurobiology,42, 424–436.
Seeds, A. M., Ravbar, P., Chung, P., Hampel, S., Midgley, F. M., Mensh, B. D., & Simpson, J. H. (2014). A suppression hierarchy among competing motor programs drives sequential grooming in drosophila.
eLife,3, 3.
Simpson, P. (1990). Lateral inhibition and the development of the sensory bristles of the adult peripheral nervous system of drosophila.Develop- ment,109(3), 509–519.
Spinola, S. M., & Chapman, K. M. (1975). Proprioceptive indentation of the campaniform sensilla of cockroach legs.Journal of Comparative Physiol- ogy A,96, 257–272.
Sun, L., Gao, Y., He, J., Cui, L., Meissner, J., Verbavatz, J. M.,…Liang, X.
(2019). Ultrastructural organization of NompC in the mechanorecep- tive organelle of drosophila campaniform mechanoreceptors.Proceed- ings of the National Academy of Sciences,116(15), 7343–7352.
Thurm, U. (1964). Mechanoreceptors in the cuticle of the honey bee: Fine structure and stimulus mechanism.Science,145, 1063–1065.
Ting, L. H., & Macpherson, J. M. (2004). Ratio of shear to load ground- reaction force may underlie the directional tuning of the automatic postural response to rotation and translation.Journal of Neurophysiol- ogy,92, 808–823.
Tuthill, J. C., & Wilson, R. I. (2016). Mechanosensation and adaptive motor control in insects.Current Biology,26, R1022–R1038.
Wendler, G. (1966). The co-ordination of walking movements in arthro- pods, nervous and hormonal mechanisms of integration.Symposia of Society for Experimental Biology,20, 229–249.
Yasuyama, K., & Salvaterra, P. M. (1999). Localization of choline acetyltransferase-expressing neurons in drosophila nervous system.
Microscopy Research and Technique,45, 65–79.
Zill, S. N., Schmitz, J., & Büschges, A. (2004). Load sensing and control of posture and locomotion. Arthropod structure & development,
arthropod locomotion systems: From biological materials and systems to.Robotics,33, 273–286.
Zill, S. N., Büschges, A., & Schmitz, J. (2011). Encoding of force increases and decreases by tibial campaniform sensilla in the stick insect,Cara- usius morosus.Journal of Comparative Physiology A,197, 851–867.
Zill, S. N., Chaudhry, S., Büschges, A., & Schmitz, J. (2013). Directional specificity and encoding of muscle forces and loads by stick insect tib- ial campaniform sensilla, including receptors with round cuticular caps.
Arthropod Structure & Development,42, 455–467.
Zill, S. N., Chaudhry, S., Exter, A., Büschges, A., & Schmitz, J. (2014). Posi- tive force feedback in development of substrate grip in the stick insect tarsus.Arthropod Structure & Development,43, 441–455.
Zill, S. N., Chaudhry, S., Büschges, A., & Schmitz, J. (2015). Force feedback reinforces muscle synergies in insect legs.Arthropod Structure & Devel- opment,44(6), 541–553.
Zill, S. N., Dallmann, C. J., Büschges, A., Chaudhry, S., & Schmitz, J. (2018).
Force dynamics and synergist muscle activation in stick insects: The effects of using joint torques as mechanical stimuli.Journal of Neuro- physiology,120(4), 1807–1823.
Zill, S. N., Keller, B. R., Chaudhry, S., Duke, E. R., Neff, D., Quinn, R., &
Flannigan, C. (2010). Detecting substrate engagement: Responses of tarsal campaniform sensilla in cockroaches. Journal of Comparative Physiology A,196, 407–420.
Zill, S. N., & Moran, D. T. (1981a). The exoskeleton and insect propriocep- tion. I. Responses of Tibial campaniform sensilla to external and muscle-generated forces in the American cockroach,Periplaneta Amer- icana.Journal of Experimental Biology,91, 1–24.
Zill, S. N., & Moran, D. T. (1981b). The exoskeleton and insect propriocep- tion: III. Activity of tribal Campaniform Sensilla during walking in the American cockroach,Periplaneta Americana. Journal of Experimental Biology,94(1), 57–75.
Zill, S. N., Moran, D. T., & Varela, F. G. (1981). The exoskeleton and insect proprioception: II. Reflex effects of tibial campaniform sensilla in the American cockroach,Periplaneta Americana. Journal of Experimental Biology,94, 43.
Zill, S. N., Neff, D., Chaudhry, S., Exter, A., Schmitz, J., & Büschges, A.
(2017). Effects of force detecting sense organs on muscle synergies are correlated with their response properties.Arthropod Structure &
Development,46, 564–578.
Zill, S. N., Schmitz, J., Chaudhry, S., & Büschges, A. (2012). Force encoding in stick insect legs delineates a reference frame for motor control.
Journal of Neurophysiology,108, 1453–1472.
Zumstein, N. (2004). Distance and force production during jumping in wild-type and mutantDrosophila melanogaster.Journal of Experimental Biology,207, 3515–3522.
S U P P O R T I N G I N F O R M A T I O N
Additional supporting information may be found online in the Supporting Information section at the end of this article.
How to cite this article:Dinges GF, Chockley AS, Bockemühl T, Ito K, Blanke A, Büschges A. Location and arrangement of campaniform sensilla inDrosophila
melanogaster.J Comp Neurol. 2020;1–21.https://doi.org/10.
1002/cne.24987