Research Collection
Journal Article
Phosphorus burial in vivianite-type minerals in methane-rich coastal sediments
Author(s):
Kubeneck, Luisa Joëlle; Lenstra, Wytze K.; Malkin, Sairah Y.; Conley, Daniel J.; Slomp, Caroline P.
Publication Date:
2021-04-20 Permanent Link:
https://doi.org/10.3929/ethz-b-000472328
Originally published in:
Marine Chemistry 231, http://doi.org/10.1016/j.marchem.2021.103948
Rights / License:
Creative Commons Attribution 4.0 International
This page was generated automatically upon download from the ETH Zurich Research Collection. For more information please consult the Terms of use.
ETH Library
Marine Chemistry 231 (2021) 103948
Available online 6 February 2021
0304-4203/© 2021 The Authors. Published by Elsevier B.V. This is an open access article under the CC BY license (http://creativecommons.org/licenses/by/4.0/).
Phosphorus burial in vivianite-type minerals in methane-rich coastal sediments
L. Jo ¨ elle Kubeneck
a,b,*, Wytze K. Lenstra
a, Sairah Y. Malkin
c, Daniel J. Conley
d, Caroline P. Slomp
aaDepartment of Earth Sciences − Geochemistry, Utrecht University, PO Box 80021, 3508 TA Utrecht, the Netherlands
bInstitute of Biogeochemistry and Pollutant Dynamics, Department of Environmental Systems Science, ETH Zürich, CH-8092 Zürich, Switzerland
cHorn Point Laboratory, University of Maryland Center for Environmental Science, Cambridge, MD 21613, USA
dDepartment of Geology, Lund University, SE-223 62 Lund, Sweden
A R T I C L E I N F O Keywords:
Phosphorus cycle Vivianite Iron Sediments
A B S T R A C T
Sediments are a key sink for phosphorus (P) in coastal systems. This allows coastal areas to act as a filter for P that is transported from land to sea. Recent work suggests that vivianite-type ferrous iron (Fe(II))-P minerals may be more important as a sink for P in coastal sediments than previously thought. Here, we investigate the occurrence of such vivianite-type minerals in sediments of three eutrophic coastal sites with contrasting dy- namics with respect to iron (Fe) and sulfur (S), covering a salinity range of 0 to 7. We only find authigenic vivianite-type minerals at the low and intermediate salinity sites, where Fe is available in excess over sulfide production. Sequential extractions combined with SEM-EDS and μXRF analysis point towards substitution of Fe in vivianite-type minerals by other transition metal cations such as magnesium and manganese, suggesting potentially different formation pathways modulated by metal cation availability. Our results suggest that vivianite-type minerals may act as a key sink for P in sediments of many other brackish coastal systems. Climate change-driven modulations of coastal bottom water salinity, and hence, Fe versus S availability in the sediment, may alter the role of vivianite-type minerals as a P burial sink over the coming decades. Model projections for the Baltic Sea point towards increased river input and freshening of coastal waters, which could enhance P burial. In contrast, sea level rise in the Chesapeake Bay area is expected to lead to an increase in bottom water salinity and this could lower rates of P burial or even liberate currently buried P, thereby enhancing eutrophication.
1. Introduction
Anthropogenic activities have increased terrestrial inputs of phos- phorus (P) to coastal systems worldwide (Conley, 1999; Kemp et al., 2009; Slomp, 2011). The associated eutrophication has led to a deteri- oration of coastal water quality (Diaz and Rosenberg, 2008). Phosphorus can be removed from coastal waters through burial in sediments (Rut- tenberg, 2003). This burial allows coastal zones to act as nutrient filters, reducing the amount of P entering the open sea (Froelich, 1988;
Bouwman et al., 2013; Asmala et al., 2017). The major P burial phases in coastal sediments are organic (Org-P), iron bound P (Fe-bound P) and apatite (Ruttenberg, 1993; Slomp et al., 1996b).
Increasing evidence suggests that Fe-bound P in coastal sediments is present in two distinct forms: as Fe-oxide bound P and in the ferrous
phosphate mineral vivianite (Egger et al., 2015a; Li et al., 2015; Lenstra et al., 2018). Vivianite is the Fe-rich end-member of the vivianite min- eral group (M3(XO4)2 ⋅ 8H2O), where M is divalent Mg, Mn, Fe, Co, Ni, Cu, Zn and X is P or As (Rothe et al., 2016). Vivianite forms in sediments where dissolved phosphate (HPO42−) and ferrous Fe (Fe2+) in porewaters are elevated. Organic matter degradation and release of P from Fe- oxides are key sources of dissolved HPO42−. High porewater Fe2+ is observed when free dissolved sulfide (here, denoted as HS−) formed during sulfate (SO42−) reduction is low compared to the input of Fe (oxyhydr)oxides. Under these conditions, not all Fe-oxides are scav- enged by HS− for the formation of Fe sulfides (FeSx; Berner, 1984). As a consequence, reductive dissolution of Fe-oxides coupled to organic matter degradation or anaerobic methane oxidation continues at sedi- ment depth (Ettwig et al., 2016; Egger et al., 2015b). In combination
* Corresponding author at: Institute of Biogeochemistry and Pollutant Dynamics, Department of Environmental Systems Science, ETH Zürich, CH-8092 Zürich, Switzerland.
E-mail address: luisa.kubeneck@usys.ethz.ch (L.J. Kubeneck).
Contents lists available at ScienceDirect
Marine Chemistry
journal homepage: www.elsevier.com/locate/marchem
https://doi.org/10.1016/j.marchem.2021.103948
Received 1 September 2020; Received in revised form 29 January 2021; Accepted 2 February 2021
with elevated HPO42− and low HS−, the release of Fe2+can lead to su- persaturation of the porewater with respect to vivianite (Egger et al., 2015a; Dijkstra et al., 2016). In marine sediments, vivianite formation is mostly observed below the sulfate-methane transition zone (SMTZ; M¨arz et al., 2008; Egger et al., 2015a).
The position of the SMTZ and zone of vivianite formation will depend on the input of organic matter and bottom water salinity. Sed- iments that receive a high input of organic matter and are characterized by a low bottom water salinity, will have a shallow SMTZ. Under such conditions, burial of Fe-oxides below the SMTZ is enhanced, which may promote sink-switching of P from Fe-oxides to vivianite, as shown recently for sediments in the oligotrophic Bothnian Sea (Egger et al., 2015a; Lenstra et al., 2018). Vivianite formed below the SMTZ likely acts as a permanent sink for P (Lenstra et al., 2018). Hence, authigenic vivianite formation can enhance P burial and counteract eutrophication in coastal systems. Despite vivianite’s potential role in P burial, very little is known about its present-day role as a sink for P in sediments of eutrophic coastal systems. Recent work in lacustrine sediments indicates that a ratio of total sulfur (S) to reactive iron (Fe) below 1.1 may be a good indicator for the formation of vivianite (Rothe et al., 2015).
Whether this ratio is also an effective indicator of vivianite formation in coastal systems remains to be seen. Furthermore, Fe2+in vivianite can be substituted by manganese in brackish systems (Mn2+; Egger et al., 2015a; Dijkstra et al., 2016; Lenstra et al., 2018), and/or by magnesium (Mg2+; Burns, 1997; Hsu et al., 2014; Dijkstra et al., 2016). The role of Mn2+ and Mg2+ substitution for authigenic vivianite formation is, however, not well understood.
In this study, we explore the potential role of authigenic vivianite as a sink for P in three eutrophic, methane-rich coastal sites, capturing a range of bottom water salinities. We further assess whether there is evidence for divalent metal substitution during vivianite formation. For
this, we combine porewater and sediment geochemical depth profiles for all three sites with scanning electron microscopy coupled to energy dispersive X-ray spectroscopy (SEM-EDS) and Desktop micro-X-ray fluorescence (μXRF) of sediments from selected depth intervals to identify the different P burial phases. Our results suggest authigenic vivianite formation, with Mn2+and Mg2+substitution, only at the two lower salinity study sites.
2. Materials and methods
2.1. Study areas, sampling and porewater analyses
We investigated two study sites located in Chesapeake Bay, USA and a third in the Stockholm Archipelago, Baltic Sea, Sweden (Fig. 1). All three study sites are located in eutrophic coastal environments, have comparable sedimentary P concentrations (Puttonen et al., 2014; Alm- roth-Rosell et al., 2016; Hartzell et al., 2017) and are characterized by high P burial rates (Nixon et al., 1996; Almroth-Rosell et al., 2016;
Hartzell et al., 2017; Edman et al., 2018; van Helmond et al., 2020).
Hence, these study sites are suitable locations to assess whether vivianite contributed to P burial in eutrophic coastal sediments.
Chesapeake Bay is the largest estuary in the USA. It extends 300 km from the mouth of the Susquehanna River to the Atlantic Ocean and has an average width of 20 km, and a mean water depth of 8 m (Gelesh et al., 2016). During the last 100 years, extensive nutrient loading has led to eutrophication (Hagy et al., 2004; Kemp et al., 2005; Testa and Kemp, 2014). Study site CB2.2 is located approximately 30 km downstream of the Susquehanna River mouth, the major freshwater source of Ches- apeake Bay (Fig. 1). CB2.2 has an annual salinity range of 3 to 7, and hence is the high salinity site of this study (Table 1). Vivianite was suggested to form in sediments in this region of Chesapeake Bay based
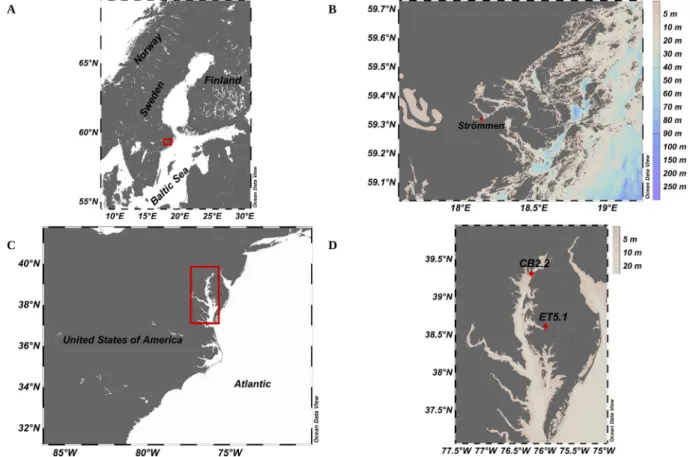
Fig. 1.Location of study sites. A: The Stockholm Archipelago (red rectangle) on the east coast of Sweden. B: Zoom of the Stockholm Archipelago with the location of the study site Str¨ommen (red diamond). C: Overview of the Northeastern coastline of the USA; Chesapeake Bay is indicated by a red rectangle. D: The location of the study sites CB2.2 and ET5.1 in Chesapeake Bay (red diamonds). Figure drawn using Ocean Data View (Schlitzer, 2016). (For interpretation of the references to colour in this figure legend, the reader is referred to the web version of this article.)
on porewater profiles (Bray et al., 1973). Study site ET5.1 (referred to as Choptank 1 in Hartzell et al. (2017)) is situated in the Choptank River, the largest sub-estuary of the eastern shore of Chesapeake Bay (Fig. 1). It is a well-mixed, shallow estuary, experiencing high nutrient loads from agriculture (Staver et al., 1996; Hartzell et al., 2017). An annual salinity range of 0 to 2 makes ET5.1 the low salinity site of this study (Table 1).
Fe-bound P is a major burial phase at ET5.1 and vivianite has been postulated to be a contributing phase (Hartzell et al., 2017).
The third study site Strommen is located in the inner part of the ¨ Stockholm Archipelago (Fig. 1) and is the intermediate salinity site with an annual salinity range of 4 to 5 (Table 1). Various model studies suggest high P burial in the inner part of the Stockholm Archipelago (Almroth-Rosell et al., 2016; Walve et al., 2018). A recent field study suggested potential sink-switching of P from organic P and Fe-oxide bound P to an authigenic ferrous phosphate at Str¨ommen (van Hel- mond et al., 2020). Here, we use samples and data from the van Hel- mond et al. (2020) study to obtain more insight in the type of authigenic ferrous phosphate formed. The μXRF and SEM-EDS data, porewater Mg2+and DIC, total sediment Mn and Mg and CDB-Fe for Str¨ommen are unique to the present study. Sample collection and processing for study site Strommen differed from the Chesapeake Bay sites. For easy com-¨ parison, we repeat all the methods for Str¨ommen site below. General characteristics of all three study sites are summarized in Table 1.
At CB2.2 and ET5.1 four sediment cores were collected per site in August/September 2017. The first core was used for solid-phase and porewater analysis, the second for micro-analysis, the third for methane (CH4) sampling, and the fourth for porosity and 210Pb analysis. Coring at CB2.2 was performed from the R/V Rachel Carson using a gravity corer (Model GC-150; Mooring Systems, Inc.; Cataumet, MA) with an inner diameter of 6.7 cm. Coring at ET5.1 was carried out from a small vessel using a gravity corer (Uwitec, Austria; core catcher removed) with an inner diameter of 8.6 cm. In this work, only sediment cores with an undisturbed sediment-water interface and sufficient overlying water (>10 cm) were processed further. CH4 was sampled directly after core retrieval from pre-drilled holes in core liners with a 2 cm resolution for cores from ET5.1 and CB2.2. Samples of 3 ml were taken with cutoff syringes from each hole and immediately transferred to 40 ml serum vials filled with 6 ml of 2.5% NaOH. The vials were stoppered, caped, shaken vigorously, and stored upside-down at − 20∘C until analysis. The other three cores were returned to the laboratory and sectioned within 24 h after core retrieval. Bottom water samples were taken from the overlying water of the porewater/solid-phase core with syringes. The porewater/solid-phase core and micro-analysis core were sliced under a nitrogen (N2) atmosphere. The cores were sliced with a 0.5 cm, 1 cm, and 2 cm resolution from 0 to 5 cm, 5–10 cm, and from 10 cm to the bottom of the core, respectively and each sediment interval was put into a 50 ml centrifuge tube. To extract the porewater, the tubes were centrifuged at 3000 rpm for 10 min. The supernatant was filtered through a 0.2 μm syringe filter (Target2) into a clean HDPE vial from which subsamples were dispensed for subsequent analyses. The
processed solid phase sediment samples were stored at − 20∘C in N2- purged airtight aluminum bags until analysis. Cores for 210Pb and porosity measurement were sliced under oxic conditions.
The study site Strommen was sampled in March 2017 from the R/V ¨ Electra. GEMAX core tubes with an inner diameter of 8 cm were used to recover sediment cores. In total three sediment cores were taken, one for porewater, solid-phase and micro-analysis, the second for CH4 sampling and the third for 210Pb, as well as porosity analysis. The collected cores were processed directly on deck after recovery. CH4 was sampled after core retrieval from pre-drilled holes in core liner with a 2.5 cm resolu- tion. 10 ml of sediment samples were taken and transferred to a 65 ml glass bottled filled with saturated NaCl solution. The bottles were stoppered, capped and stored upside down until further analysis. Two bottom water samples were taken and subsequently the cores were sliced into intervals of 0.5 cm, 2 cm, and 4 cm resolution from 0 to 10 cm, 10–20 cm, and 20–40 cm sediment depth, respectively under a N2
atmosphere. The sediments were put into 50 ml centrifuge tubes, which were centrifuged at 3500 rpm for 20 min to extract porewater. The porewater and bottom water samples were filtered through 0.45 μm Teflon filters under a N2 atmosphere. The sediment was stored at − 20∘C in N2-purged airtight aluminum bags until further analysis. The third core used for porosity analysis was sliced under oxic conditions and the sediment was placed in pre-weighed glass vials, which were stored in plastic bags at − 20∘C until analysis.
Porewater samples were analyzed for HS−, DIC, CH4, NH4+, and major anions and cations with spectrometric and chromatographic techniques (Table 2).
2.2. Solid phase analyses
Sediments were freeze-dried and aggregates were broken down in an agate mortar under an argon (Ar) atmosphere. Each sample was split into an oxic and anoxic subsample. Anoxic splits were used for the speciation of solid phase Fe, S and P to avoid oxidation artifacts (Kraal et al., 2009; Kraal and Slomp, 2014). All other analyses were performed on the oxic subsamples.
2.2.1. Total elemental composition and organic carbon
Sediment subsamples of the oxic splits (~125 mg) were digested overnight at 90 ∘C in a mixture of 2.5 ml of HClO4 and HNO3 (ratio 3:2) and 2.5 ml HF in a Teflon vessel. The acids were evaporated at 140 ∘C until a gel was formed. Subsequently, this gel was dissolved in 25 ml of 4.5% HNO3 at 90 ∘C overnight. With inductively coupled plasma atomic emission spectroscopy (ICP-OES) total elemental concentrations of Al, Ca, Fe, Mn, Mg, and S in 4.5% HNO3 were determined, from which total elemental concentrations in the sediment samples were calculated.
Assuming that Ca is mainly bound in the form of CaCO3 in the sediment, the total Ca concentration was used as an approximation for the maximum possible CaCO3 content.
Furthermore, ca. 300 mg of oxic sediment was decalcified with two Table 1
Characteristics of study sites. Salinity range refers to seasonal variations. Bottom water (BW) oxygen and temperature are reported from the time of sampling. The salinity range originates from long-term data compiled by Swedish National Oceanographic Data Centre/SHARK at the Swedish Meteorological and Hydrological Institute (SMHI) (Downloaded data, 2017) for Str¨ommen and by Chesapeake Bay Program (n.d.) (Dowloaded data, October 2017) for Chesapeake Bay sites. Organic carbon (Corg) is the mean of the entire core. Sedimention rate (Sed. rate) is based on 210Pb-dating. The total P concentration is the average below the depth where values are near constant based on the sum of all SEDEX fractions (ET5.1: 5.5 cm; Str¨ommen: 22 cm; CB2.2: 21 cm). The total P concentration, sedimentation rate and porosity data of the respective sediment interval were used to calculate P burial rates.
Site Coordinates Water
depth [m] BW oxygen
[μmol l−1] Temperature
[◦C] Salinity on
sampling day Salinity
range Corg
[wt%] Sed. rate
[cm yr−1] P burial [g
m−2 yr−1] Total P [μmol g−1]
ET5.1 38∘48.36′N 4.0 163 27.0 0.2 0–2 6.18 0.49 3.1 57.0
75∘54.66′W
Strommen ¨ 59∘19.15′N 30.0 339 1.5 5.2 4–5 6.27 3.50 8.6 42.7
18∘7.15′E
CB2.2 39∘20.92′N 10.0 219 22.2 6.1 3–7 3.30 0.45 1.4 14.2
76∘10.59′W
washes of 1 M HCl and a final rinse with UHQ water (Van Santvoort et al., 2002). The decalcified samples were subsequently dried at 50∘C and analyzed with a CN analyzer (Fisons Instruments Na 1500) to determine organic carbon contents. Based on laboratory reference ma- terials, the relative error was less than 2%.
Porosity of Chesapeake Bay samples was determined from the water loss upon drying at 60∘C until a constant weight was reached, while the porosity at Strommen was derived from the weight loss upon freeze- ¨ drying samples from the oxic core. In both cases, a dry sediment den- sity of 2.65 g cm−3 was assumed (Burdige, 2006).
2.2.2. Sequential extractions
Ca. 50 mg of homogenized sediment samples of the anoxic split were subjected to the three-step Fe speciation procedure based on a combi- nation of the methods of Poulton and Canfield (2005) & Claff et al.
(2010) as presented in Kraal et al. (2017). Solid-phase Fe was fraction- ated step-wise into the following phases (Table 3): (1) labile Fe(III)- oxides and Fe(II) (iron monosulphide (FeS), siderite, vivianite), (2) crystalline Fe-oxide minerals, (3) recalcitrant oxide minerals. All sam- ples were measured for dissolved Fe colorimetrically using the 1,10-phe- nanthroline method, adding hydroxlamine-hydrochloride as a reducing agent to convert all ferric iron (Fe(III)) into ferrous (Fe(II)) iron (APHA, 2005). Only for Step 1, the absorbance before and after adding the reducing agent was measured, to estimate the Fe(II) and Fe(III) pool.
Ca. 50 mg of homogenized sediment samples of the anoxic split were subjected to the three-step S speciation procedure of Burton et al. (2008, 2011). Solid-phase S was fractionated step-wise into (Table 3): (1) acid volatile sulfur (AVS), (2) elemental sulfur and (3) chromium reducible
sulfur (CRS). The released HS− in step 1 and 3 was trapped into a 10 ml vial filled with 7 ml Zn-acetate (20% Zn-acetate/2 M NaOH). The trapped HS− concentrations were determined by iodometric titration (APHA, 2005). AVS is assumed to represent the FeS fraction, while the CRS/2 fraction represents FeS2. The sum of the extracted Fe phases and CRS/2 is termed highly reactive Fe (FeHR).
Ca. 100 mg of homogenized sediment samples of the anoxic split were subjected to the five-step SEDEX method developed by Ruttenberg (1992), and modified by Slomp et al. (1996a), including the exchange- able step. Solid-phase P was fractionated step-wise into the following phases (Table 4): (1) exchangeable-P, (2) Fe-bound P (including Fe- oxide bound P and vivianite), (3) authigenic apatite, (4) detrital apatite and (5) organic P. P was measured colorimetrically using the molybdenum blue method (Strickland and Parsons, 1972). Only, extraction step 2 (citrate-dithionite-biocarbonate (CDB) solution) was analyzed for P, Fe, Mn, Ca and Mg with ICP-OES.
2.3. Sedimentation rate and P burial
The 210Pb activity of the Chesapeake Bay samples was determined through the activity of its granddaughter isotope, 210Po, and was measured by alpha-spectrometry (Canberra Alpha Analyst), following Palinkas and Nittrouer (2007). For Strommen, ¨ 210Pb was measured on freeze dried sediment by direct gamma counting at 46.5 keV using a high purity germanium detector (Ortec GEM-FX8530P4-RB). Self-absorption was measured directly and the detector efficiency was determined by counting a National Institute of Standards and Technology sediment standard. Excess 210Pb was calculated as the difference between the Table 2
Pre-treatment and analyses of the porewater.
Variable Pre-treatment Volume of porewater
[ml] Method for analysis
HS¡ Chesapeake
Bay1 Addition of 200 μl of 20% zinc (Zn) acetate 1 Spectrophotometrically (Cline, 1969)
Str¨ommen Addition of 2 ml of 2% Zn acetate 0.5 Spectrophotometrically (Cline, 1969)
DIC2 Chesapeake
Bay Crimped sealed vial, stored in the dark at 4∘C,
analyzed within 48 h 1 Conversion to CO2 by addition of 0.5 N H2SO4 gas
chromatography
Str¨ommen Poisoned with HgCl, stored at 4∘C 5 AS-C3 analyzer3
Major
cations4 Chesapeake
Bay Addition of 10 μl HNO3 to achieve pH less than 15 1 ICP-OES
Str¨ommen 10 μl 30% suprapure HCl per ml of sample 1–2 ICP-OES
NH4þ Chesapeake
Bay Stored at − 20∘C 2 Colorimetrically (Timothy et al., 1984)
Str¨ommen 1 Colorimetrically (Helder and De Vries, 1979)
SO42¡& Cl¡ Chesapeake
Bay Diluted 5-fold with H2O Suppressed anion exchange chromatography6
Str¨ommen 0.5 Ion chromatography
CH47 Chesapeake
Bay 3 GC-FID, using certified reference standards
Str¨ommen Injection of 10 ml N2 headspace 10 Measurement of CH4 concentrations in headspace with a GC-
FID
HPO42¡ Chesapeake
Bay 2 Colorimetrically using molybdate blue method (Strickland and
Parsons, 1972) 1 Label Chesapeake Bay applies to both sites: ET5.1 & CB2.2.
2 Dissolved Inorganic Carbon.
3 AS-C3 analyzer (Apollo Sci-Tech), which consists of an acidification and purging unit in combination with a LICOR-7000 CO2/H20 Gas Analyzer.
4 Major cations include Na2+, Mn2+, Mg2+, Ca2+, K+, Fe2+, and for Str¨ommen as well the anions Si and HPO42−. The porewater concentration of dissolved Fe2+(<0.45 μm) is only an indication of the truly dissolved fraction, since this fraction consists most likely of a mixture of truly dissolved (ionic), organically complexed, colloidal and nano-particulate Fe (Raiswell and Canfield, 2012).
5An internal Yttrium standard (1 ppm) was added to standards and samples to track performance. Accuracy and precision of the analyses were controlled by replicate measurements of reference standards.
6Dionex ICS-2000, Dionex AS11-HC column.
7CH4 concentrations were corrected for porosity.
measured total 210Pb and the estimate of the supported 210Pb activity as given by 214Pb (210Pb_exc =210Pb_total 214Pb). Sediment accumulation rates at each site were estimated by fitting a reactive transport model (Soetaert and Herman, 2008) to the 210Pb depth profiles. Depth dependent changes in porosity were included in the model. A negatively sloped 210Pb profile in the upper 10 cm of the sediment at CB2.2 might suggest a high degree of bioturbation (Supplemental Fig. S1). Although, we cannot rule out bioturbation, the negatively sloped profile at the surface is unusual and we infer that the profile is caused by a major resuspension/deposition event from Susquehanna river loading as re- ported previously for this part of Chesapeake Bay (e.g. Hirschberg and Schubel, 1979; Palinkas et al., 2014).The 210Pb data for the upper 10 cm were therefore excluded from the model fits to calculate the sedimen- tation rate at site CB2.2.
Total P burial (mol m−2 yr−1) for all sites was calculated as follows:
Pburial=Ptotal*sed.rate*ρ*(1− ϕ)*104 (1)
where Ptotal is the averaged concentration of total P (based on SEDEX) (mol g−1) in the deeper sediment where total P stabilized, ϕ is the average porosity in the same interval (cm3 cm−3), sed. rate is the sedi- mentation rate (cm yr−1) and ρ is the density of dry sediment, 2.65 g cm−3 (Burdige, 2006).
2.4. Identification of ferrous phosphate minerals
To analyze the nature of sediment Fe and P enrichments, samples from selected intervals from all sites were further investigated by SEM- EDS and Desktop μXRF.
2.4.1. Sample preparation & SEM analysis
To investigate whether large vivianite crystals (>54 μm size) were present, sediments from three depths (if possible above & immediately below the SMTZ and deeper sediment; Strommen: 3.5–4, 14–16 and ¨ 28–32 cm; ET5.1: 5–6, 10–12, 32–34 cm; CB2.2: 6–7, 22–24, 44–46 cm) of the study sites were sieved through a 54 μm mesh sized sieve under an Ar-atmosphere with deoxygenated UHQ water to remove major parts of the clay and silt fraction. ET5.1 has a very shallow SMTZ, and hence only samples below the SMTZ were analyzed. In case of ET5.1 and CB2.2, wet bulk sediment samples were used, while for Str¨ommen freeze-dried sediment was used. Freeze-drying should not have an influence on th presence of vivianite. Due to limited material, the sediment interval from 3.5 to 4 cm of Str¨ommen was homogenized with an agate mortar and pestle. Sieved material was washed with oxygen-free UHQ water multiple times for 4 min in a sonic bath until the supernatant was clear as described in Egger et al. (2015a). In case of ET5.1 and CB2.2, five Table 3 Solvents and targeted Fe & S phases of the Fe & S sequential extraction procedure, as presented by Kraal et al. (2017) and Burton et al. (2008, 2011). The S sequential extraction is used to measure the pyrite content in the solid phase. Step Extractant (extraction time) Target phase Abbreviation Fe- extraction 1 1 M HCl, pH 0 (4h) Poorly ordered/ pH sensitive Fe(II) and Fe(III) minerals, such as ferrihydrite, Fe-carbonate, monosulfides and vivianite HCl-Fe(II) and HCl-FeOx 2 0.35 M acetic acid/ 0.2 M Na-citrate/ 50 g l−1 Na dithionite, pH 4.8 (4 h) Crystalline oxide minerals (goethite, hematite) CDB-FeOx 3 0.17 M NH4+oxalate/ 0.2 M oxalic acid, pH 3.2 (6 h) Recalcitrant oxide minerals Oxalate-Fe S-extraction 1 6 M HCl, 0.1 M ascorbic acid (overnight) Acid volatile sulfide (iron monosulfides) AVS 2 25 ml CH4OH (overnight) Elemental S1 - 3 Acidic chromium solution (48 h) Chromium reducible sulfur (Pyrite) CRS 1 Elemental S was extracted but not analyzed.
Table 4
Solvents and targeted phases of the SEDEX extraction (Ruttenberg, 1992), including the alterations by Slomp et al. (1996a).
Step Extractant Time Target phase Abbreviation
1 1 M MgCl2 (pH 8) 0.5 h Exchangeable P Ex-P
2a 0.3 M Na3 citrate / 25 g l Na diathonite / 1 M NaHCO3 (pH 7.6)
8 h Fe-bound P Fe-bound P1,
2
2b 1 M MgCl2 (pH 8) 0.5 h Washing step
3a 1 M Na acetate buffered to pH
4 with acetic acid 6 h Authigenic
apatite Authi Ca-P
3b 1 M MgCl2 (pH 8) 0.5 h Washing step
4 1 M HCl 24 h Detrital apatite Detr-P
5 Combustion at 550 ∘C 2 h Organic P Org-P
1 M HCl 24 h
1 The CDB-P solution does not solely extract Fe-bound P phases (Jensen and Thamdrup, 1993; Kostka and Luther, 1994). However, for simplicity we refer to it as Fe-bound P.
2 Ferrous phosphates such as vivianite are also likely to be dissolved in the CDB solution, as shown by Nembrini et al. (1983) and Dijkstra et al. (2016).
washes were performed, while the samples from Strommen were washed ¨ 25 times due to the presence of oil-like substances. All samples were dried in an Ar-filled glovebox at room temperature. Aliquots of the sieved and dried samples were put on an aluminum sample holder using double-sided carbon tape and were subsequently carbon coated. The SEM-energy dispersive X-ray spectroscopy (EDS; JCM 6000PLUS Neo- Scope Benchtop SEM) with 15 kV accelerating voltage, Si/Li detector in backscatter mode imaging (BEI) was used to analyze the samples. To quantify the elemental composition of selected particles, EDS analysis was carried out in the 0–20 keV energy range (probe current: 1 nA, acquisition time: 50 s (live time)), allowing the determination of the relative molar ratios of major elements.
2.4.2. Desktop μXRF mapping
To better understand the elemental composition of mineral phases enriched in Fe and P, three sediment intervals below the SMTZ (20–24, 28–32, and 32–36 cm) from Str¨ommen were analyzed by μXRF. For comparison, one shallow sediment interval of ET5.1 (10–12 cm) was also investigated where SEM analysis showed the presence of authigenic ferrous phosphate mineral phases. For the analyses, freeze-dried, ho- mogenized, anoxic aliquots were mounted on double-sided carbon tape.
Elemental maps of the aliquots were then collected using a Desktop EDAX Orbis μXRF analyzer (Rh tube at 30 kV, 500 μA, no filter, 300 ms dwell time, poly-capillary lens providing a 30 μm spot size).
3. Results
3.1. General site characteristics
All bottom waters were well oxygenated at the time of sampling (Table 1). Bottom water salinities were 0.2 at ET5.1, 5.2 at Str¨ommen and 6.1 at CB2.2 (Table 1). The sediments were organic-rich at all sites, with organic carbon contents ranging from 3.3 wt% at CB2.2 to ~6 wt%
at the other two sites (Table 1, Supplemental Fig. S7). Sedimentation rates were high at all sites and ranged from 0.45 and 0.49 cm yr−1 at the
two Chesapeake Bay sites to 3.5 cm yr−1 at Str¨ommen (Table 1, Sup- plemental Fig. S1).
3.2. Porewater profiles
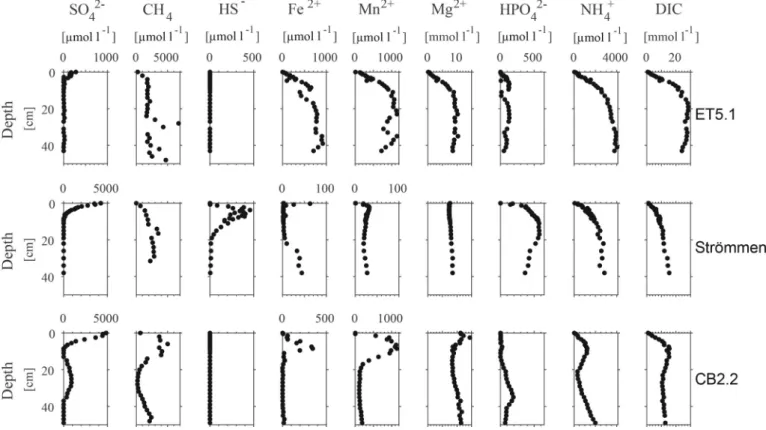
All study sites had a shallow SMTZ. At ET5.1, SO42− was removed in the upper 5 cm, while at Strommen and CB2.2 SO¨ 42− was detectable to ~ 10 cm depth (Fig. 2). At CB2.2, a subsurface maximum in SO42− was observed between depths of 15 cm and 39 cm. Concentrations of CH4 increased with depth at all sites, except for CB2.2, where concentrations initially increased but then showed a minimum in the zone where the subsurface maximum in SO42− was observed. HS− was only detectable in the upper 20 cm of the sediment at Str¨ommen, reaching concentrations of up to 450 μmol l−1 at 4 cm depth. Dissolved Fe2+generally increased with depth, but significant differences were observed among the study sites. At ET5.1, Fe2+increased to values of up to 1000 μmol l−1 and then remained mostly constant with depth. Only at Strommen, dissolved Fe¨ 2+ reached a maximum directly below the sediment-water interface and then decreased to values around zero. Dissolved Fe2+increased again below a depth of 20 cm. At CB2.2., Fe2+reached a maximum concen- tration of ~ 340 μmol l−1 at 8.5 cm depth, but was absent below 15 cm depth. Depth trends in Mn2+ were mostly similar to those of Fe2+. Concentrations of Mn2+ were mostly higher than those of Fe2+, in particular at CB2.2. Concentrations of Mg2+mostly ranged between 8 and 11 mmol l−1, except for ET5.1, where Mg2+concentrations were low near the sediment-water interface and increased in the upper 10 cm before reaching a maximum of ~ 10 mmol l−1. Depth profiles of HPO42−
differed greatly between the study sites. At ET5.1, HPO42− was low and did not exceed 140 μmol l−1 throughout the sediment. In contrast, at Str¨ommen, HPO42− concentrations increased in the upper 20 cm of the sediment to up to 580 μmol l−1. Below 20 cm, HPO42− concentrations decreased again. At CB2.2, HPO42− concentrations were mostly low, except between a sediment depth of 20 and 40 cm where concentrations reached a maximum of ~ 200 μmol l−1. At all study sites, NH4+and DIC concentrations were low near the sediment-water interface. At ET5.1
Fig. 2. Porewater depth profiles of SO42−, CH4, HS−, Fe2+, Mn2+, Mg2+, HPO42−, NH4+and DIC for ET5.1, Str¨ommen and CB2.2.
and Str¨ommen, concentrations increased until a depth of 20 cm after which they remained constant. At CB2.2, NH4+and DIC concentrations also initially increased with depth but were characterized by a subsur- face minimum around a depth of 20 cm.
3.3. Solid phase profiles
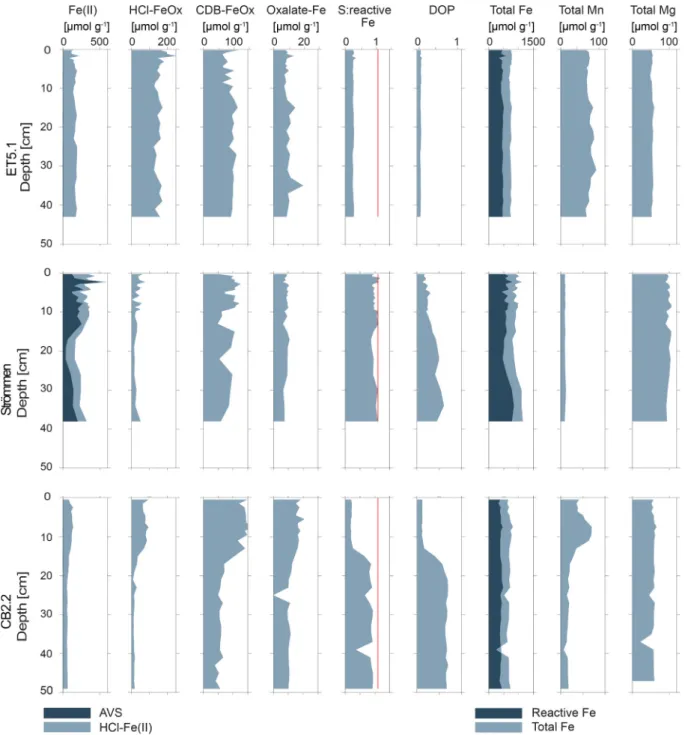
The Fe(II) content at the three sites either remained constant or decreased slightly with sediment depth and ranged mostly between between 100 and 300 μmol g−1 (Fig. 3). The sediment at Strommen was ¨ enriched in Fe(II) compared to that of the Chesapeake Bay sites. Most Fe (II) was in the form of AVS at Str¨ommen, while at the Chesapeake Bay sites no AVS was detected. HCl-FeOx and CDB-FeOx contents were mostly constant with depth, except at CB2.2 where the upper 15 cm of
the sediment was enriched in both Fe phases. Sediments at site ET5.1 contained more HCl-FeOx than at either Str¨ommen or CB2.2 throughout most of the sediment (with value of up to 200 μmol g−1 versus <100 μmol g−1). By contrast, CDB-FeOx contents were mostly in the same range at all sites (50–100 μmol g−1; Fig. 3). Oxalate-Fe was a minor phase at all three study sites (~ 10–15 μmol g−1). Molar ratios of total S to reactive Fe were constant with sediment depth at sites ET5.1 and Str¨ommen. At CB2.2, an abrupt increase with depth was observed below ca. 15 cm. While sediments at ET5.1 were characterized by low ratios, those at Str¨ommen and CB2.2 had ratios close to 1.1 (red line, Fig. 3).
Values of DOP showed a similar trend with depth as the total S to reactive Fe ratios. Total sediment Fe contents were mostly constant with depth but differed between regions: at ET5.1 and CB2.2 values were comparable at ~ 700 μmol g−1, while those at Str¨ommen were close to
Fig. 3.Depth profiles of sediment Fe forms, Degree of Pyritization (DOP) and total sediment Fe, Mn, and Mg contents at the three study sites. Reactive Fe is the sum of all sequentially extracted Fe pools including CRS as defined by Rothe et al. (2015). Ratio of 1.1 of total S to reactive Fe is indicated by a red line. (For interpretation of the references to colour in this figure legend, the reader is referred to the web version of this article.)
~1000 μmol g−1 (Fig. 3). The enrichment in Fe in the sediment of Strommen was also apparent in elevated Fe/Al ratios (Supplemental ¨ Fig. S6). Sediment Mn contents were constant with depth at ET5.1 and Strommen, while at CB2.2 Mn was enriched between a depth of 5 to 10 ¨ cm. Overall, the Chesapeake Bay sites (ET5.1 and CB2.2) had higher maximum concentrations of Mn than Str¨ommen (~ 50 versus ~10 μmol g−1; Fig. 3). Sediment Mg contents were constant with depth at all sites.
In this case, the Chesapeake Bay sites had lower concentrations than Strommen (~300 versus ~500 ¨ μmol g−1).
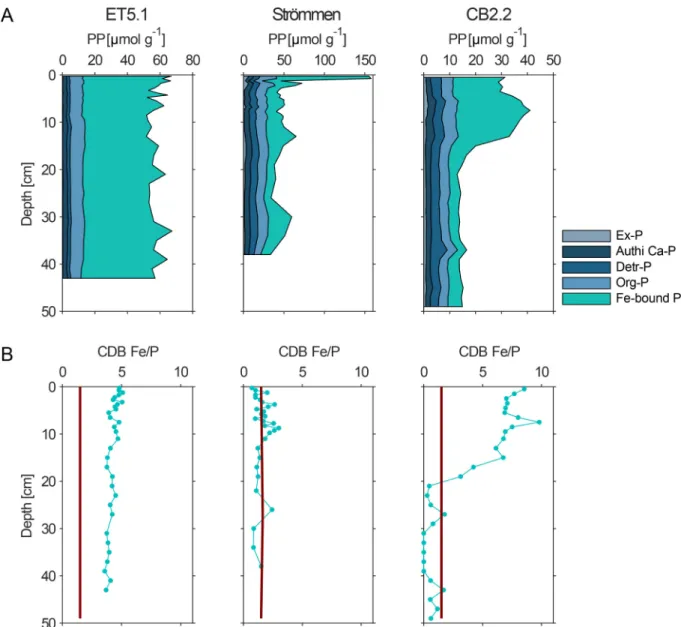
Total sediment P contents were mostly constant with depth at site ET5.1, but decreased with depth at the other sites (Fig. 4A). At all sites, Ex-P, Authi Ca-P, Detr-P and Org-P showed little change with depth. The same holds for Fe-bound P at site ET5.1, where concentrations were close to 40 μmol g−1 down to the bottom of the sampled interval at 42 cm depth. At Strommen and CB2.2, in contrast, Fe-bound P decreased ¨ with depth to concentrations of 25 and 5 μmol g−1, respectively. The ratio of Fe to P dissolved in the CDB step differed among the three study sites. At site ET5.1, CDB Fe/P was always close to 5 (Fig. 4B). At Strommen, an Fe/P ratio around 1.1 was observed, whereas at CB2.2, ¨ the ratio was between 7 and 10 in the upper 15 cm and around 0 in the deeper sediment (Fig. 4B). Rates of total P burial range from 1.4 g m−2
yr−1 at site CB2.2 to 8.6 g m−2 yr−1 at Str¨ommen (Table 1).
3.4. Identification of ferrous phosphates
At ET5.1, the μXRF measurements showed coinciding enrichments in Fe, P, and Mn in the sediment interval at 11 cm (Fig. 5A). SEM-EDS analysis revealed the presence of distinct Fe-and P-rich crystals at all three selected sediment depths (5.5 cm, 11 cm, and 30 cm; Fig. 5B and Supplemental Fig. S4) that were similar in appearance to vivianite minerals observed in sediments at two coastal sites in the Bothnian Sea (Egger et al., 2015a; Lenstra et al., 2018). Quantitative analyses with the EDS showed enrichments in Mn in all the crystals. The relative molar Fe (+Mn) to P ratios lie in the range of 1.5 to 3.4 (2.4 to 5.5; Table 5). The presence of Al and Si likely reflect associated clay particles that were not removed during sieving.
At Strommen, coinciding enrichments in Fe and P were detected with ¨ the μXRF. Part of the enrichments included Mg besides Fe and P (Fig. 5A), especially in the samples from 30 cm depth (Supplemental Fig. S5). No vivianite resembling crystals were found with the SEM.
Fig. 4.A: Depth profiles of sediment phosphorus forms at ET5.1, Str¨ommen and CB2.2. B: Fe to P ratio in the CDB extraction of SEDEX for the three study sites. The red line indicates the theoretical Fe:P ratio (1.5) of vivianite. (For interpretation of the references to colour in this figure legend, the reader is referred to the web version of this article.)
4. Discussion
4.1. Fe-bound P as a P sink at sites with contrasting salinities
Fe-oxides have a large sorption capacity for P. Their presence can enhance burial of P in sediments (Upchurch et al., 1974; Caraco et al., 1989; Hartzell et al., 2010). In the marine environment, Fe-oxides are commonly scavenged by HS−, limiting the preservation and burial of Fe- oxide bound P (Krom and Berner, 1980; Caraco et al., 1989). Sediment DOP provides a quantitative measure of the amount of reactive Fe buried in the form of pyrite. Elevated DOP ratios imply that more Fe is sulfi- dized and that less Fe-oxides are available for binding of P. Our data show a decrease in HCl-FeOx as an Fe(III) burial phase and an increase in DOP with increasing salinity at our study sites (Table 1, Fig. 3). Hence, the corresponding decrease in Fe-bound P at depth in the sediment (Fig. 4A) could be explained by dissolution of Fe-oxides with depth, in accordance with previous work (Strom and Biggs, 1982; Hyacinthe and Van Cappellen, 2004; Jordan et al., 2008).
At ET5.1, Fe-oxides (HCl-FeOx & CDB-FeOx), as well as an Fe(II) phase, were the dominant burial phases for reactive Fe (Fig. 3). AVS was not detectable, while pyrite was a minor phase, implying that only a minor fraction of Fe-oxides was subject to sulfidization. At Str¨ommen and CB2.2, in contrast, Fe-oxides contents were significantly lower, whereas the DOP was high (up to 0.7 at Str¨ommen and 0.8 at CB2.2).
This is in accordance with higher HS− production from fresher to more saline conditions, leading to a decline in buried Fe-oxides and Fe-oxide bound P (e.g. Jordan et al., 2008). We indeed find less total and Fe- Fig. 5.A: μXRF images of sediments from ET5.1 (11 cm depth) and from Strommen (34 cm depth). Simultaneous enrichments in Fe, P and Mn/ Mg are indicated by ¨ red arrows. B: SEM image and EDS spot analysis of a Mn-enriched vivianite crystal from 11 cm depth at ET5.1. (For interpretation of the references to colour in this figure legend, the reader is referred to the web version of this article.)
Table 5
Relative elemental abundances in mol% and molar ratios in mol/mol as deter- mined by SEM-EDS (n =number of measurements) for vivianite-type crystals at depths of 5.5, 11 and 33 cm at site ET5.1.
5.5 cm (n
=16) 11 cm (n
=24) 30 cm (n
=10)
Mean ST.
DEV Mean ST.
DEV Mean ST.
DEV
P 18.2 7.5 18.1 9.5 16.8 7.4
Fe 26.0 10.3 30.6 9.4 29.5 9.6
Mn 15.6 6.5 19.2 6.7 19.8 5.8
Mg 2.2 1.1 2.1 1.0 2.0 1.2
Si 15.3 14.2 12.1 12 12.9 12
Al 8.2 4.8 13.2 6.6 9.2 4.8
Fe/P 1.49 0.4 3.4 6.3 2.2 1.6
Mn/P 0.87 0.3 2.1 3.9 1.3 1.1
Mg/P 0.11 0.06 0.10 0.04 0.09 0.06
Fe/(Fe +
Mn +Mg) 0.60 0.03 0.61 0.09 0.62 0.11
Mn/(Fe +
Mn +Mg) 0.35 0.02 0.35 0.08 0.34 0.12
Mg/(Fe +
Mn +Mg) 0.05 0.03 0.03 0.02 0.04 0.03
(Fe,Mn,
Mg)/P 2.47 0.7 5.57 10.1 3.50 2.6
(Fe, Mn)/P 2.36 0.7 5.48 10.1 3.41 2.7
bound P burial at depth at higher salinity sites (Fig. 4A; Fig. 6). Sediment Ex-P, Authi Ca-P, Detr-P and Org-P-contents were not affected by salinity. Consequently, the data of our studied systems support prior observations that the balance between Fe and S determines the amount of Fe-oxides buried, which subsequently may lead to less Fe-oxide bound P burial.
4.2. Formation of authigenic ferrous phosphate minerals
There is increasing evidence that in systems which are Fe and P rich and S poor, Fe-bound P consists of a mixture of Fe-oxide bound P and authigenic ferrous phosphates such as vivianite (Slomp et al., 2013;
Egger et al., 2015a; Li et al., 2015; Lenstra et al., 2018). At sites ET5.1 and Strommen, the removal of HPO¨ 42− from the porewater at depth in the presence of Fe2+(Fig. 2) could be explained by such authigenic ferrous phosphate mineral formation. However, differences exist between the sediment geochemistry at the two sites, which potentially influence the type of mineral formed and depth of formation.
At ET5.1, no HS− was detectable throughout the sediment and scavenging of Fe2+by HS− is likely marginal since the DOP remained exceedingly low and constant with sediment depth (Fig. 3). Fast removal of SO42− with the concurrent presence of CH4 throughout the sediment indicates a shallow SMTZ. The presence of Fe-oxides below the shallow SMTZ likely enables Fe- and Mn-oxide reduction coupled to anaerobic methane oxidation, which likely contributes to high porewater Fe2+and Mn2+concentrations (Egger et al., 2015b). Thermodynamic calculations suggest porewaters were supersaturated with respect to vivianite (Sup- plemental Fig. S3). Indeed, vivianite crystals were detected at all sieved sediment depths at ET5.1 with SEM (Fig. 5, Table 5, Supplemental Fig. S4) and EDS and μXRF data point towards Mn-bearing vivianite (Fig. 5, Table 5). The detected presence of Al and Si (Table 5, Supple- mental Fig. S4) is likely an artifact of associated clay minerals which were not removed during sieving and washing. The homogeneous enrichment of Fe and P (Supplemental Fig. S4) strongly suggest that the identified crystals are vivianite rather than Fe-/P-enriched clay frac- tions. Furthermore, the Fe:P ratio of 5 in the CDB step of SEDEX points to a mixture of Fe-oxide bound P and Mn-enriched vivianite as the Fe- bound P phase at site ET5.1. This is based on the observation that the Fe/P ratio of vivianite is typically 1.5 (Rothe et al., 2015), whereas that
of Fe-oxide bound P often is close to 10 (Slomp et al., 1996b). Fe-oxide bound P is dissolved in 1 M HCl (“HCl-FeOx”) and CDB step of the Fe- extraction, as well as in the CDB (“Fe-bound P") step of the P-extrac- tion, while vivianite only contributes to the CDB step of the P-extraction.
Assuming a typical stoichiometric ratio of Fe-oxide bound P of 10 (Slomp et al., 1996b), one can subtract the Fe-oxide bound P fraction from the CDB step of the P-extraction to gain an estimate how much P might be bound in the form of vivianite. Using this calculation, results in an estimation that 19 μmol/g of P is bound in the form of vivianite.
Based on this estimation, vivianite would be responsible for 38% of total P burial at ET5.1. This suggests that vivianite could act as a major burial sink for P at this site. Overall, the porewater and solid phase date in addition to the morphology of the identified vivianite crystals, showing no signs of pitting and/or erosion, strongly suggests in-situ formation of vivianite at ET5.1.
At Str¨ommen, in contrast, HS− is present in the upper 22 cm of the sediment, rapidly scavenging any Fe2+to form FeSx (Figs. 2, 3). Below 22 cm depth, HPO42− removal coincides with an increase in dissolved Fe2+. Also here, the release of Fe2+ is likely coupled to anaerobic methane oxidation of persisting Fe-oxides below the deeper SMTZ.
Thermodynamic calculations suggest supersaturation of the porewaters with respect to vivianite below the SMTZ (22 cm depth; Supplemental Fig. S3). We therefore conclude that authigenic vivianite formation is likely the primary driver of HPO42− removal from the porewater. Viv- ianite precipitation could also explain the enrichments in Fe-bound P at depth. Although no vivianite was identified by SEM-EDS analysis, we suspect its absence may have been an artifact of the numerous (25) washing steps that were required to clean the polluted sediments.
Furthermore, vivianite crystals might have been smaller than the cut-off of the sieve (<54 μm) used during sample preparation. Analysis of the unwashed sediment with μXRF revealed enrichments of Fe, Mg, and P (Fig. 5, Supplemental Fig. S5), suggesting the aggressive washing prior SEM-EDS analysis was likely stripping the sediment of mineral deposits.
We propose that an authigenic magnesium, ferrous phosphate mineral forms at Str¨ommen, with Mg substituting for the Fe. The CDB Fe/P fluctuates around 1.5 at depth suggesting that P is not solely associated to Fe. The CDB extraction cannot be used to quantify the role of Mg because of the wash steps with MgCl2 between the extraction steps (Table 4). However, since Strommen is enriched in Mg in the solid phase ¨
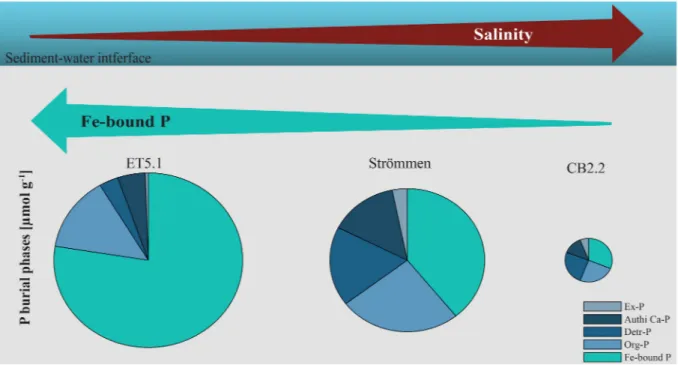
Fig. 6.Change in composition and concentration of sedimentary P burial phases along the studied salinity gradient.
(Fig. 3, Supplemental Fig. S6) and the porewater Mg2+concentration stabilized (Fig. 2), the data is in accordance with the hypothesis of removal of Mg to a solid phase at depth. The Mg-rich end member of the vivianite mineral group is baricite and could be the authigenic mineral phase removing HPO42− from the porewater (Sturman and Mandarino, 1976; Rothe et al., 2016). Incorporation of Mg could alter the morphology of vivianite crystals and might be another possible expla- nation why we missed the crystals by SEM-EDS.
At CB2.2, we find little Fe-bound P at depth in the sediment and no evidence for authigenic ferrous phosphate mineral formation. At this site, HS− in the porewater was low but the DOP was high indicating strong sulfidization of Fe (Figs. 2, 3). The subsurface maximum in SO42−
and minimum in CH4 suggests non-steady state conditions in the pore- water (Fig. 2), hindering further interpretation.
Rothe et al. (2015) suggested that in lake sediments the potential for vivianite formation may be deduced from total S to reactive Fe ratios below 1.1. Ratios below or close to 1.1 were observed at all of our study sites (Fig. 3). The ratios were lowest at site ET5.1 (0.2 to 0.3), however, and this was also the site with the highest abundance of vivianite-type minerals. Hence, we conclude that total S:reactive Fe ratios may be useful to assess the potential for vivianite formation in coastal sedi- ments. In addition, a Fe to P ratio substantially lower than 10 in the CDB step of the P extraction might provide further evidence that P is asso- ciated to both vivianite and Fe-oxides. However, the application of both ratios might be limited if Fe is replaced by other divalent cations such as Mg. Summarizing, we suggest that Fe-bound P consists of a mixture of Fe- oxide bound P and an authigenic ferrous phosphate at ET5.1 and Strommen. Authigenic ferrous phosphates likely formed mostly below ¨ the SMTZ at these sites. In these sulfate-depleted, methane bearing sediments, both dissolved Fe2+and HPO42− accumulated, creating con- ditions conducive to vivianite formation. Since the Fe:P ratio of authi- genic ferrous phosphates is lower than that for Fe-oxide bound P, the presence of authigenic ferrous phosphates can enhance the role of Fe bound P as a burial sink for P. Divalent cation substitution of Fe may facilitate authigenic vivianite formation if the supply of reactive Fe is limited.
4.3. Role of other cations in authigenic ferrous phosphate formation Vivianite is the Fe-rich end-member of the vivianite mineral group (M3(XO4)2 ⋅ 8H2O), where M is divalent Mg, Mn, Fe, Co, Ni, Cu, Zn and X is P or As. In the environment, Fe is regularly substituted by Mn and/or Mg in the mineral lattice (Rothe et al., 2016, and references therein), as we also observe at our study sites.
At ET5.1, the sediment and porewater was enriched in Mn and the presence of Mn in the CDB solution used to extract Fe-bound P suggests a potential link between Mn, Fe and P (Figs. 2, 3, Supplemental Fig. S2).
The SEM and EDS analysis confirmed that Mn substituted Fe in the authigenic vivianite (Fig. 5, Supplemental Fig. S4, Table 5), thereby forming “manganoan” vivianite (Nakano, 1992). The Mn/(Mn +Fe) ratio of around 0.35 (Table 5) is similar to ratios observed for vivianite found in Mn-rich Baltic Sea subsurface sediments (0.44; Dijkstra et al., 2016) and sediments of Lake Biwa (0.5; Nakano, 1992). In contrast, lower ratios were reported for vivianite in Fe- and Mn-rich Bothnian Sea sediments (0.17–0.23; Egger et al., 2015a). The average (Fe +Mn + Mg)/P ratios determined by SEM-EDS measurements (Table 5) were higher than the theoretical ratio of 1.5. We suggest that this is an artifact such as edge effects resulting from the limitations of SEM-EDS analysis.
Dijkstra et al. (2016) also determined elevated (Mn +Fe)/P ratios for vivianite crystals found at Landsort Deep by SEM-EDS while bulk digestion of the same crystals resulted in elemental ratios close to theoretical values. Our μXRF data analysis for ET5.1 also revealed simultaneous enrichments in Mn and P without a concomitant enrich- ment in Fe (Fig. 5A). This suggests the presence of Mn-phosphates. Our thermodynamic saturation calculations show that the porewater is
supersaturated with respect to MnHPO4 (Fig. S3), which could thus be an additional P burial phase at this study site.
At Str¨ommen, Mg instead of Mn appears to substitute for Fe in authigenic ferrous phosphates, allowing formation of the Mg-rich end member of the vivianite mineral group, baricite. Baricite is known to form in marine sediments (Burns, 1997; Hsu et al., 2014). However, Mg substitution in vivianite is less common in coastal and lake sediments (Sapota et al., 2006; Egger et al., 2015a; Lenstra et al., 2018).
Considering that Mg is ubiquitous in the marine environment, the question remains, why Mg substitute for Fe in vivianite at Str¨ommen but not at our other coastal sites. We hypothesize that this could be at least partly related to the low Mn2+ concentrations in the porewater at Str¨ommen (Fig. 2). This is based on the assumption that the availability of the metals during mineral formation plays a role in their inclusion in the crystal structure (Dijkstra et al., 2018). Furthermore, potential ex- change of cations with surrounding pore fluids may continue after authigenesis (Dijkstra et al., 2016). Indeed, variations in the relative abundance of Mg2+and Mn2+in porewaters appear to be reflected in the vivianite composition in natural sediments. For example, in Mn-rich Bothnian Sea sediments, little Mg was incorporated in vivianite (Egger et al., 2015a). In subsurface Baltic Sea sediments (deposited over the past 8 kyrs), in contrast, the highest abundance of Mg in vivianite coincided with a maximum in porewater Mg2+(Dijkstra et al., 2016).
The substitution of Mn2+with Fe2+in the vivianite crystal might be energetically favoured over the substitution by Mg2+because the former shares a similar ionic radius with Fe2+. In the absence of Mn2+, Mg2+ might enable growth of vivianite crystals when Fe2+concentrations are low, as is the case at Str¨ommen. These hypotheses need further support from laboratory experiments that focus on the kinetics and thermody- namics of vivianite crystal growth.
4.4. Implications and conclusions
Phosphorus entering the coastal zone from land does not necessarily reach the open sea as reactive P can be permanently removed from the water column via burial in coastal sediments (Froelich et al., 1982;
Ruttenberg, 2003; Bouwman et al., 2013). Identifying the factors con- trolling P burial is essential in order to understand the response of coastal systems to environmental change.
High rates of sediment accumulation and high sediment P concen- trations promote P burial (Ruttenberg, 2003; Asmala et al., 2017). Both factors contribute to high P burial rates at sites ET5.1 and Str¨ommen (Table 1; Fig. 6). For coastal systems, burial as Fe-bound P is known to strongly depend on salinity, with low salinity promoting P binding to Fe- oxides (Caraco et al., 1989; Jordan et al., 2008). We also observe such a relationship with salinity. However, our results suggest that in addition to Fe-oxide bound P, vivianite-type minerals should also be considered a sink for P in sediments of eutrophic coastal systems (Fig. 6). Substitution of Fe2+by other divalent metal cations such as Mn2+and Mg2+could facilitate authigenic vivianite-type mineral formation in such settings if the availability of Fe2+is limited. Our results for ET5.1 confirm that total sulfur (S) to reactive iron (Fe) ratios below 1.1 (Rothe et al., 2015) may be a good indicator for the presence of vivianite in coastal sediments with a low salinity. However, the presence of Mg-rich vivianite-types may be missed when applying this ratio. Our results, thus, add to a growing body of evidence that vivianite can play a substantial role in the P sequestration in various coastal settings. Improvements in methodol- ogy to identify and, in particular, quantify vivianite in natural samples is needed to unravel its role in the overall P cycle.
Climate change is expected to lead to changes in salinity in many coastal areas worldwide, for example due to changes in freshwater input from rivers and/or sea level rise. For the Baltic Sea region, model pre- dictions point towards enhanced precipitation and increased river runoff, and, hence, decreased bottom water salinity in the coastal zone (Meier et al., 2006). This change alone is expected to lead to increased burial of P as vivianite in coastal sediments in the Baltic Sea, due to a