Policy Research Working Paper 5692
Together We Will
Experimental Evidence on Female Voting Behavior in Pakistan
Xavier Giné Ghazala Mansuri
The World Bank
Development Research Group
Finance and Private Sector Development Team &
Poverty Reduction and Economic Management Network Poverty Reduction and Equity
June 2011
WPS5692
Public Disclosure AuthorizedPublic Disclosure AuthorizedPublic Disclosure AuthorizedPublic Disclosure Authorized
Produced by the Research Support Team
Abstract
The Policy Research Working Paper Series disseminates the findings of work in progress to encourage the exchange of ideas about development issues. An objective of the series is to get the findings out quickly, even if the presentations are less than fully polished. The papers carry the names of the authors and should be cited accordingly. The findings, interpretations, and conclusions expressed in this paper are entirely those of the authors. They do not necessarily represent the views of the International Bank for Reconstruction and Development/World Bank and its affiliated organizations, or those of the Executive Directors of the World Bank or the governments they represent.
Policy Research Working Paper 5692
In many emerging democracies women are less likely to vote than men and, when they do vote, are more likely to follow the wishes of household males. The authors assess the impact of a voter awareness campaign on female turnout and candidate choice. Geographic clusters within villages were randomly assigned to treatment or control, and within treated clusters, some households were left untreated. Compared with women in control clusters, both treated and untreated women in treated clusters are
This paper is a product of the Finance and Private Sector Development Team, Development Research Group; and the Poverty Reduction and Equity Team, Poverty Reduction and Economic Management Network. It is part of a larger effort by the World Bank to provide open access to its research and make a contribution to development policy discussions around the world. Policy Research Working Papers are also posted on the Web at http://econ.worldbank.org. The authors may be contacted at xgine@worldbank.org and gmansuri@worldbank.org.
12 percentage points more likely to vote, and are also more likely to exercise independence in candidate choice, indicating large spillovers. Data from polling stations suggest that treating 10 women increased turnout by about 9 votes, resulting in a cost per vote of US$ 2.3.
Finally, a 10 percent increase in the share of treated women at the polling station led to a 6 percent decrease in the share of votes of the winning party.
Together We Will: Experimental Evidence on Female Voting Behavior in Pakistan
Xavier Giné and Ghazala Mansuri
JEL: D72, P16, 012
Keyword: externalities, information campaign, voting behavior, elections, field experiment
Giné: Development Research Group, The World Bank (e-mail:xgine@worldbank.org). Mansuri: Development Research Group, The World Bank (e-mail: gmansuri@worldbank.org). We thank Abhijit Banerjee, Marco Castillo, Rachel Croson, Jishnu Das, Quy-Toan Do, Marcel Fafchamps, Haris Gazdar, Donald Green, Alan Gerber, Dan Houser, Macartan Humphreys, Raquel Fernandez, Shareen Joshi, Stuti Khemani, Betsy Levy-Paluck, Monica Martínez-Bravo, Kevin McCabe, Berk Ozler, Ragan Petrie, Debraj Ray, Mark Rosenzweig, Jennifer Tobin and Pedro Vicente for valuable discussions and advice. We are especially grateful to the following for their help and support in organizing the experiment: Shahnaz Kapadia, at ECI Islamabad, for her help with designing and pilot testing the information campaign; Irfan Ahmad at RCONs, Lahore, for managing all field operations and data collection; Sughra and Ashiq Solangi of The Marvi Rural Development Organization, Sukkur, for their tremendous support to the team throughout; Qazi Azmat Isa at the World Bank Office in Islamabad and Kamran Akbar at the Pakistan Poverty Alleviation Program (PPAF) in Islamabad for their support and encouragement. This project was jointly funded by the Development Research Group at the World Bank and the PPAF. Paloma Acevedo, Paola de Baldomero, Jordi de la Torre and Santhosh Srinivasan provided outstanding research assistance. The views expressed herein are those of the authors and should not be attributed to the World Bank, its executive directors, or the countries they represent.
2
1. Introduction
A basic premise of representative democracy is that those who are subject to policy should have a voice in its making. Although women account for half of the world‘s population, they have historically lagged behind men in legal and political rights. In recognition of this, suffrage was extended to women in most western democracies in the early 20th century and the new
democracies that emerged after WWII followed suit and granted women de jure rights to political participation in all democratic institutions.1
Despite these improvements, women are still far less likely than men to stand for public office, even in developed countries with older democracies. They are also less likely to participate in the electoral process as voters or to exercise independence in candidate choice when they do vote. Instead, women report voting in accordance with the preferences of the caste, clan or household head in contrast to men of all ages (CLRAE, 2002).2
While women‘s relative absence from elected public office has received considerable policy attention in recent years3, there have been few attempts to reduce barriers to women‘s
participation as voters, and even less attention has been paid to the use of women as passive vote banks, when they do participate. If preferences over the allocation of public resources vary by gender, this neglect could have implications for public policy, in addition to equity related concerns.4
1 These rights were also brought into international law by several important agreements to which most countries are signatories. These include the Universal Declaration of Human Rights (1948), the Convention on the Political Rights of Women (1952); the International Covenant on Civil and Political Rights (1966); and the Convention on the Elimination of All Forms of Discrimination against Women (1979).
2 See also Zia and Bari (1999) and Bari (2005) for Pakistan.
3 A number of countries have passed legislation requiring fixed quotas for women. In South Asia, for example, India, Pakistan and Bangladesh have all instituted quotas for women in both local and national assemblies.
4 Chattopadhyay and Duflo (2004) exploit the quota introduced for women in the Indian Gram Panchayats and find that elected women leaders are more likely to provide public goods preferred by women. Lott and Kenny (1999) find that women‘s suffrage in the US increased overall government revenues and expenditures and has led to more liberal voting patterns. Edlund and Pande (2002) find that the decline in marriage has contributed to the shift by women voters in the US towards the Democratic Party. Several studies of intra-household resource allocation (e.g. Thomas (1990), Lundberg and Pollack (1997) and Hoddinott and Haddad (1995)) have also shown that women tend to make different choices over the allocation of household budgets, such as higher investments in health and the education of children. Croson and Gneezy (2009) review the experimental literature on gender differences in preferences related to risk, social attitudes and competition.
3
Women in emerging democracies may face two distinct barriers to exercising their right to vote for a candidate of their choice. First, costs of participation may be too high. Traditions or cultural stereotypes may discourage the exercise of own preferences, mobility constraints may limit participation and, if there are expectations of voter intimidation or violence, personal security concerns may also loom larger among females. Second, women may have fewer or poorer sources of information about the significance of political participation or the balloting process, perhaps due in part to illiteracy and limited mobility. Lack of information may also reinforce stereotypes that further disengage women from public life.
However, while attitudes and social mores change slowly, information provision can occur relatively quickly.5 If lack of awareness limits participation, as studies suggest, then access to information could enhance both equity and allocative efficiency as women select candidates that best reflect their preferences. At the same time, the mere act of participation may also serve to weaken pejorative perceptions about female efficacy that limit women‘s engagement in public life (Beaman et al., 2007).
We test these ideas by conducting a field experiment to assess the impact of information on female turnout and independence of candidate choice. The setting for the experiment is rural Pakistan where women still face significant barriers to effective political participation, despite legislative reforms aimed at enhancing female participation in public life (Zia and Bari, 1999).6 The awareness campaign was conducted just before the 2008 national elections. Study villages were divided into geographical clusters which were randomly assigned to treatment or control.
Within treated clusters, only a subset of sample households was randomly assigned to receive a door-to-door awareness campaign. This allows us to assess the magnitude of spillovers within treated clusters without confronting the usual set of identification problems (Manski, 1993;
1995).
5 A number of recent studies have looked at the role of geography, shifts in technology and the development of institutions in the formation of cultural attitudes and beliefs about gender roles. See for e.g. Alesina et al (2010), Alesina and Giuliano (2010), Fernandez (2007), Fernandez and Fogli (2009) and Fortin (2005).
6 Zia and Bari report that women's registration as voters is often considered neither necessary nor appropriate by either household males or political parties. They also note that, in addition to cultural restrictions on mobility and low levels of literacy, women's lack of knowledge about the electoral system and about voting procedures constitutes an important barrier to the registration of women and female turnout in elections (pg. 89).
4
The campaign was developed as a set of simple visual aids with two different messages: the importance of voting which focused on the relationship between the electoral process and policy, and the significance of secret balloting which explained the actual balloting process. Treated women received either the first message or the first and the second, allowing us to test whether the knowledge that ballots are cast in an environment of secrecy enhances female participation, as well as independence in candidate choice.
We find that turnout increases by about 12 percent for women in treated households compared to women in control clusters, with somewhat larger and more precise effects for women exposed to both messages. More importantly, we find comparable turnout rates for treated women and their untreated close neighbors, indicating large geographical spillovers. We then assess whether spillovers among close friends are larger than those among neighbors. The results are
qualitatively similar. This is not too surprising given that close friends typically reside nearby. In addition, we use the GPS location of households to estimate spillovers beyond the (arbitrary) boundaries of the treatment clusters and find even larger effects.
We also use administrative data from all polling stations that served the study villages and find that for every 10 treated women, (roughly 4 households), female turnout increases by about 9 additional votes. Once we take this externality into account, the cost of the intervention drops from US $16.7 to about US $2.2 per additional vote. In contrast, using the same administrative data we find no effect on male turnout, suggesting either that the provision of information on electoral participation and processes is less salient for men or that there is little communication about political matters between men and women. Of course, it is also possible that men are simply not influenced by information provided by women.
We then study whether the campaign influenced candidate and party choice. We find that it did.
Treated women are significantly more likely to vote for the second most voted for political party.
Control women in treated clusters behaved again as if directly treated, confirming once more the importance of social interactions. Polling station data show as well that an increase of 10 percent in the share of treated women led to decrease in the share of female votes for the winning party of 6 percent. These results suggest that the campaign could have influenced the share of votes at the constituency level, had it been implemented at a larger scale.
5
Given this result, we next check whether treatment decreases the male head‘s knowledge of the candidate choice of women in his household. Using follow-up survey data which asked the male head and each woman in the household about whether other women in the household had cast a vote and for whom they had voted, we construct cross-reports regarding candidate choice. Using these cross-reports, we find that male heads in treated households are indeed significantly less informed about the candidate choice of women in their households.
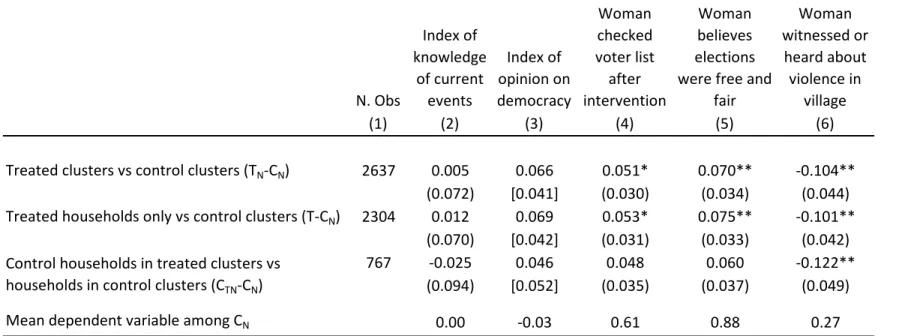
Interestingly, we also find evidence of cognitive dissonance (e.g., Mullainathan and Washington, 2009). Women in control clusters, among whom turnout was lower, were less likely to believe that the election was free and fair and more likely to report witnessing or hearing instances of violence in the village, compared to reports by women in treated clusters.
While there is an extensive literature on the impact of Get-out the Vote or GOTV campaigns in developed countries, and in the US in particular (see Gerber and Green, 2000a and 2000b), much less is known about the impact of such campaigns in developing countries where voters tend to have poorer access to information and institutionalized party structures are also much less developed (Aker et al. 2010, Banerjee et al. 2010 and Pande 2011 for a review).7,8
This paper contributes, therefore to two literatures. First, it adds to this nascent literature on pre- election voter information campaigns in developing countries. Second, it is the only paper which, to our knowledge, assesses the impact of information externalities on voter turnout and candidate choice. This is critical for correctly measuring the cost-effectiveness of an information campaign, but it is also important for assessing the types of information that can be successfully transmitted through social networks., In this regard, our paper is closest to Duflo and Saez (2003) and
contributes also to the burgeoning literature on social networks and peer effects (e.g. Sacerdote, 2000 and Kling, Liebman and Katz, 2007).
7 In an experiment in the US where voters received postcards with information about their voting record, Gerber et al. (2008) find that turnout increased by about 8 percent in households that were shown their voting records as well as that of their neighbors. This increase in turnout is comparable to the impact of direct canvassing. Perhaps more related to our study, Nickerson (2008) conducted a door-to-door canvassing experiment to assess information spillovers within the household. He targets households with two registered voters and finds that the member that did not answer the door is nearly 60% as likely to vote as the treated member.
8 In developing countries there is a small experimental literature that has focused on electoral violence, clientelism and vote buying in the context of developing countries. Collier and Vicente (2007), for example, study the effect of an information campaign against electoral violence in Nigeria. Wantchekon (2003) has examined the effectiveness of clientelist messages in Benin and Vicente (2007) analyzes an information campaign against vote buying in Sao Tome and Principe, Vicente and Wantchekon (2009) provides a review.
6
While peer pressure may have contributed to the increase in turnout we observe (Funk, 2010), we provide evidence suggesting that the information content of the campaign mattered. First, control women in treated clusters are far more likely than women in control clusters to discuss political issues with their neighbors, including political party and candidate positions and the importance of voting in accordance with one‘s own preferences. Second, male heads of control households in clusters treated with the message about the secrecy of the balloting process are less informed about the candidates chosen by women in their household, compared to control
households in clusters treated with the message about the importance of voting only. This is evidence that even the more nuanced message about the secrecy of voting was conveyed to control women in treated clusters.910
The remainder of the paper is organized as follows. Section 2 describes the context of the 2008 election, the design of our experiment and the data. Section 3 describes the empirical strategy and results. In particular, Section 3.1 discusses the impact of the information campaign on turnout and assesses the size and significance of information spillovers, Section 3.2 discusses the evidence on independence of candidate choice, Section 3.3 examines the interaction between electoral competition and information provision and Section 3.4 assesses the impact of the campaign on knowledge and perceptions. Section 4 provides a cost-benefit analysis of the intervention and Section 5 concludes.
2. Context and Experiment Design
The experiment was carried out in collaboration with the Pakistan Poverty Alleviation Fund (PPAF), the Marvi Rural Development Organization (MRDO), Research Consultants (RCons), ECI and the World Bank. PPAF is an apex institution created in 2000 with World Bank funding.
PPAF provides capacity building and funding for community based development and
9 In this sense the awareness campaign studied here is quite different from most GOTV campaigns, whose objective is to increase turnout by persuading subjects to vote. The awareness campaign, in contrast, is designed to inform women about their rights in the electoral process and how to exercise them.
10 One could also argue that the increase in turnout was due to the mere salience of the campaign (e.g. Zwane et al.
forthcoming). However, at the time of the visit, households were already subject to multiple stimuli to vote. Indeed, over 75 percent of them reported receiving a visit prior to the election from party volunteers asking for their vote. In addition, one could argue that the mere visit could have motivated treated women to vote (if they felt special for having been chosen and voted out of reciprocity). This is unlikely because untreated women in treated clusters (not chosen to receive the visit) show comparable turnout rates to directly treated women.
7
microfinance to its partner organizations, which are mostly NGOs. MRDO is one such non- partisan NGO funded primarily by PPAF, that mobilizes women using a community based approach. RCons, a survey firm, helped MRDO implement the awareness campaign and
collected the baseline and follow-up data. ECI, a non-partisan local training firm, collaborated in the design of the campaign. ECI had prior experience with the development of visual aids and pamphlets related to electoral participation and the balloting process. It was also actively engaged in the training of local election officers nationwide prior to the elections.
2.1 Context
The campaign was carried out in the districts of Sukkur and Khairpur in the southern province of Sindh. The districts were selected because of sharp electoral competition between the two main political parties, the Pakistan People‘s Party Parliamentarians (PPPP), which has a secular-left leaning platform and the Pakistan Muslim League Functional (PMLF), which was allied with the military regime.
The initial sample included 12 villages, 6 villages from each district, and 24 polling stations from two constituencies.11 All candidates from both parties in these two constituencies were male.
Villages were chosen to ensure variation in expected political competition at the polling station level, but given the context of the 2008 elections, 3 villages (3 polling stations) had to be
dropped because the safety of the canvassing teams could not be guaranteed. The polling stations in these 3 villages were relatively more contested than those in our final sample of 9 villages and 21 polling stations.
Indeed, the 2008 national elections were held in an environment that was politically charged.
After seven years of military rule, culminating in widespread opposition, the government
declared emergency rule. The sitting judges of the Supreme Court were dismissed and there were fears that the incumbent government would engage in massive rigging. Scheduled initially for January 8th, 2008, the elections were postponed to February 18th, 2008 because Benazir Bhutto,
11 Twelve polling stations were from the National Assembly constituency NA-199 (Sukkur) and the remaining 12 from NA-215 (Khairpur). NA-199 had a total of 242 polling stations while NA-215 had 270 polling stations. The same 12 polling stations belonged to Provincial Assembly constituencies PS-4 (Sukkur) and PS-32 (Khairpur), respectively. PS-4 had 125 polling stations in total and PS-32 had 114 (see http://www.ecp.gov.pk/ for more information).
8
the leader of the PPPP, and a twice elected Prime Minister, was assassinated on December 27th, 2007.
In Sindh, traditionally a PPPP stronghold, a large turnout and a PPPP landslide was being anticipated due to a possible sympathy vote for Bhutto. At the same time, the expected PPPP landslide could have served to discourage supporters of PML-F, depressing turnout. Finally, there were concerns about electoral rigging and voter intimidation by the incumbent military government, though these decreased after Bhutto‘s assassination and the increased visibility of the elections. The net effect of these tendencies on turnout and party choice, particularly for women, was uncertain.
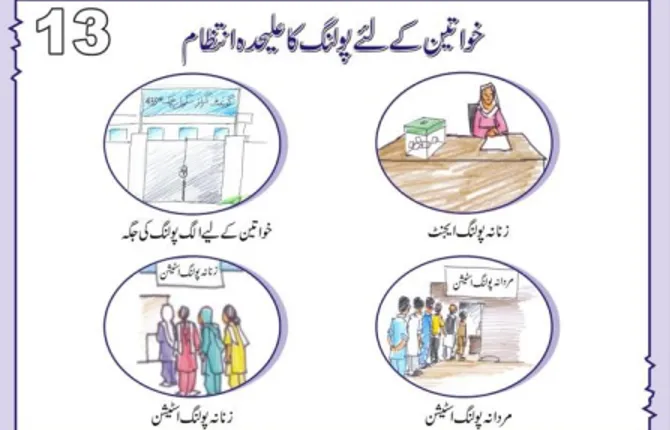
The campaign was delivered door-to-door by a team of two women and was only attended by the women in each household. No men were allowed to be present during the sessions.12 It was designed as a set of simple visual aids accompanied by a well rehearsed and limited script. The campaign included two nonpartisan messages: the first focused on the importance of voting, the relationship between the electoral process and policy, including village development outcomes, while the second focused on the actual balloting process (the structure of a typical voting station and booth, the fact that male and female booths are separate, the secrecy of the ballot and the basic appearance of the ballot paper). The information campaign never mentioned a political party or candidate by name. As mentioned, this also distinguishes our awareness campaign from a GOTV campaign.13 Appendix A contains the translation of the script and Appendix B the translated visual aids.
12 In many cases, men were not at home at the time of the visit, which took place during the morning and early afternoon. If men were home, they were requested to allow the female team members to meet with the women alone.
In most cases this did not pose a problem since men are not usually present in an all women‘s gathering. In the few cases where men were reluctant to leave, the male supervisor discussed the information campaign in general terms with them and obtained agreement.
13 A GOTV campaign can be partisan or not, though a number of experimental studies have shown that partisan messages are less successful in motivating turnout. Cardy (2005), for example, finds that neither partisan direct mail nor partisan phone calls - used independently or together - managed to garner a significant voter response. In a similar vein, Gerber and Green (2000b) find that non-partisan messages are particularly effective in mobilizing unaffiliated past voters. The authors hypothesize that partisan voters may already receive adequate encouragement from their respective political parties while unaffiliated voters do not. Moreover, they speculate that politically unattached voters may also have been impressed by the non-partisan appeal to civic responsibility. Horiuchi et al.
(2007) also find that voters are less likely to abstain when they receive policy information about both ruling and opposition parties through their official party websites. The information effects are larger among those voters who were planning to vote, but were undecided about which party to vote for.
9
The campaign was implemented door-to-door for two main reasons. First, it provided a high degree of control over which households received the campaign and which did not, which is critical to measuring information spillovers and the cost-effectiveness of the campaign. Second, door-to-door information campaigns in the US have proven more cost-effective than other strategies like phone calls and direct mailings.14 In our context, door-to-door visits were also the most feasible choice given the low levels of literacy and cell-phone ownership among women, combined with low female mobility.15
Table 1 Panel C indicates that female literacy rates are indeed very low in our study area, as they are all over rural Sindh. Less than 20 percent of adult women have any formal schooling.
Women also have rather limited mobility even within their own villages. Most women in our sample can travel within the village on their own or accompanied by other females but not outside the village, where the presence of a male is required.
Appendix Table A2 presents gender differences in access to media, knowledge of current events and participation in public life. The sample is confined to comparisons between the male head and his spouse. Women are far less likely to listen to local, national or international news channels (10 percent of women report listening to BBC compared to 48 percent of men, for example) and are far less informed about any political issue, including major events like the imposition of emergency rule in the country, which only 6 percent of women knew about, as compared to 82 percent of men. Women are also less likely to be able to correctly identify political party signs and names. Interestingly, this difference is not due to differential access to TV or radio. Instead it appears that men and women use media very differently.16 Women are also less engaged with any aspect of village public life. They are far less likely, for example, to attend community meetings related to village development, attend demonstrations or contact their local councilor or local party official for any matter. Interestingly, though, when they do
14 Gerber and Green (2000a) reports on a randomized GOTV campaign conducted in New Haven, Connecticut, just prior to the 1998 election. The campaign delivered non-partisan messages through personal canvassing, direct mailings and telephone calls. The study found that personal canvassing had a substantially greater impact on voter turnout as compared with other modes of contact. Green et al., (2003) and Michelson (2003) find similar results.
15 See Jacoby and Mansuri (2011)
16 Table A2 indicates that both radio and TV are widely available and that if anything, women report higher access than men. Approximately, 42 percent of men and 47 percent of women had access to a radio and about 65 percent of men and 67 percent of women had access to a TV.
10
engage, women tend to avoid formal authority and reach out to traditional or religious leaders (66 percent among women compared to 49 among men).17
2.2 Experimental Design and Data
The timeline of the study is shown in Figure 1. The information campaign was carried out two weeks prior to the elections (from February 5th to 15th 2008) by 8 teams consisting of one MRDO female staff and one female enumerator from RCONs each.18 Each sample village was covered in approximately one day and was divided into contiguous geographical clusters of
approximately 40 households. A cluster was typically one or two contiguous streets in the village. Clusters were based on geography rather than other household characteristics such as caste or occupation of household head because restrictions to female mobility suggested that social interactions would be dictated by physical proximity. Each cluster was then randomly assigned to receive the importance of voting message (T1), or T1 plus the secrecy of balloting message (T2) or nothing. The canvassing team selected one cluster in each village at random and began there. T1 was delivered in this cluster. Next, a gap cluster was left between two selected clusters. In the second selected cluster a coin toss determined whether T2 was delivered or all selected households were left as controls. The third selected cluster was then given the opposite treatment of the second cluster. A typical sample village had about 7 study clusters and 11 geographical clusters in all, including gap clusters. The final sample has 67 clusters in total, 30 assigned to T1, 27 assigned to T2 and 10 left as controls.19 Within each selected cluster,
irrespective of the specific treatment, every 4th household was selected and surveyed, starting at either end of the cluster. In T1 and T2 clusters, all selected households were assigned to the respective treatment, with the exception of every 5th selected household which was left as a
17 These statistics are also consistent with Pakistan‘s rather dismal performance on a range of development
indicators. According to the 1998 Human Development Report, for example, Pakistan ranked 138 out of 174 on the Human Development Index (HDI), 131 out of 163 on the Gender Development Index (GDI), and 100 out of 102 on the Gender Empowerment Measure (GEM).
18 While RCONs team members were new in the villages, MRDO staff had been working in the area, although their coverage was still low. According to Table 1, only around 11 percent of the women in the sample were MRDO members. We ensured, however, that MRDO staff did not conduct the campaign in the villages where they had been working previously. MRDO staff was also not engaged in the collection of the follow-up data. When asked
informally about whether women in the household they had visited to deliver the campaign had voted and for whom, they did not know. As a result, it is clear that MRDO staff did not have any authority over the household and there was no expectation that they would obtain future favors if they casted the vote.
19 We kept one randomly selected control cluster in the survey sample per village. In one larger village, two control clusters were included in the survey.
11
control. This generated 2 to 4 controls in each T1 and T2 cluster in addition to the households selected in the control clusters. Thus, similar to Duflo and Saez (2003), the peer group is fixed by location and only a subset of the peer group in a treatment cluster is treated. In total, 2,735 women from 1,018 households were reached. Figure 2 maps a section of a study village containing three clusters delimited by a white solid line. The dots, squares, stars and triangles indicate the location of the study households. A dot denotes a household in a control cluster, a square (star) denotes a treated household in a T1 (T2) cluster and a triangle is a control household in a treated cluster (either T1 or T2). These three clusters are mapped to a polling station whose location falls outside the map.
During the door-to-door visit, basic data on each sample household was collected, including the GPS location of the house, a basic roster of all adult women with their past voting record and the name and address of their closest friend or confidant in the village. The door-to-door visit lasted about 20 to 25 minutes for treated households and 5 to 10 minutes for control households. None of the households refused to participate in the awareness campaign or to be interviewed.
A local woman, usually a school teacher, was also identified in each village during the awareness campaign to assist the canvassing team with the verification of voting, post-election, by checking the ink stain on each woman‘s hand. This woman was provided the list of sample women whose thumb mark needed to be verified on election day and the day after the election. This list
included one confidant from each household. The confidant was selected as follows: in every even numbered household, the confidant of a woman who was either a daughter or a daughter in law of the household head was selected, while in every odd numbered household, the confidant of the household head (if the head was a woman) or the head‘s wife, sister, mother or aunt was selected. Not all households yielded at least one ―eligible‖ woman using this rule, so the final sample includes 727 confidants whose vote was verified.
Voting verification took place between the evening of February 18th, Election Day, and the evening of February 19th. The field teams visited each village on February 19th to check 10 percent of the verifier‘s assignment at random and found no significant differences.
12
During the verification exercise, the verifiers were unable to locate 98 women (and 27
households). This leaves us with a sample of 2,637 women and 991 households. We were able to verify all 727 confidants.
Attrition of women was unrelated to treatment assignment (see Appendix Table A3), although we note that T2 households are more likely to attrit. Since the overall household attrition rate is very low (2.6 percent), this is not a source of concern. In addition, 158 women claimed to have cast a vote but did not have the requisite ink mark. To be conservative, we treat these women as not having voted, although the results do not change if we consider them as voters.
Verification was followed by a post-election survey of the same 2,637 women in March 2008.
We ensured that the team of enumerators that visited a given household at follow-up was different from the one that had delivered the awareness campaign. The survey collected information on household demographics, recall of the door-to-door visits, access to and use of various media, and knowledge of the balloting process and political candidates, among other issues. Finally, we collected the official electoral results by gender, candidate and political party for each of the 21 polling stations which served our sample villages.20
Average turnout among women in our sample is 59 percent, while female turnout in the 21 polling stations is 47.3 percent. At the constituency level, total turnout was 39.2 percent in Khairpur and 48.6 percent in Sukkur. The corresponding turnout rate (including both males and females) in the sample polling stations was 41.7 percent and 43 percent, respectively. While there is significant variation in contestation at the polling station level, the share of PPPP at the constituency level was a large 70 percent in Khairpur and 73 percent in Sukkur.
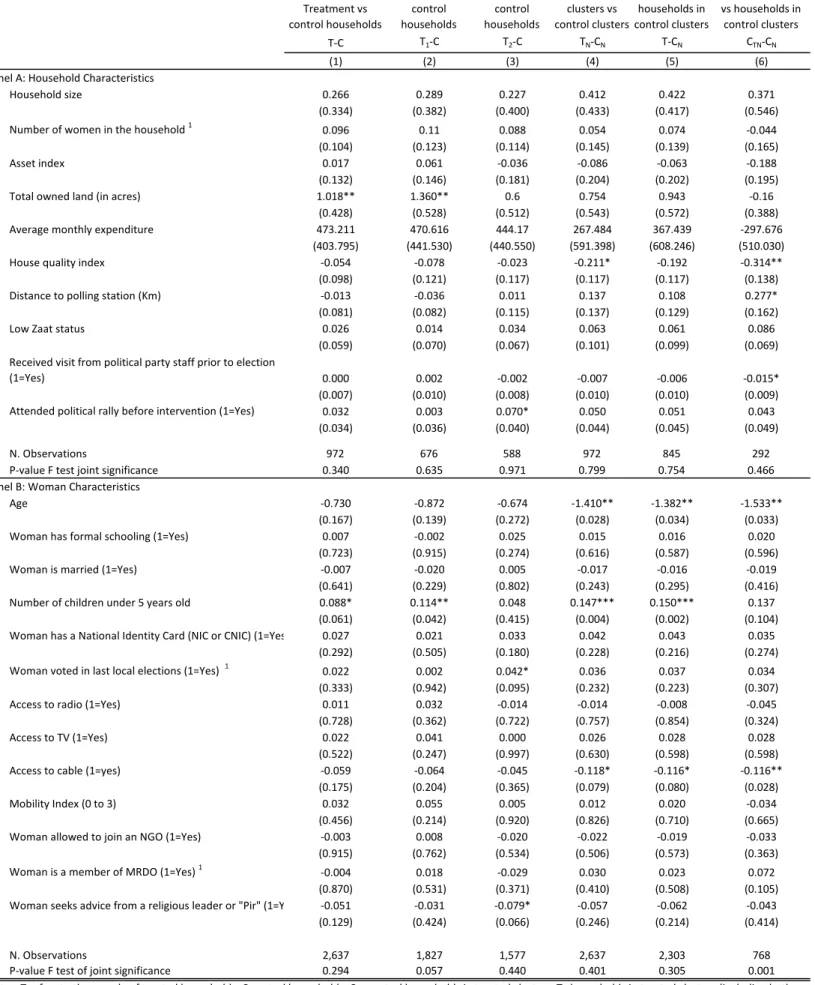
Table 2 reports the difference in means of household and woman characteristics across different samples. See Appendix Table A1 for the definition of the variables used in the paper. Column 1 in Panel A compares treated households to all control households, irrespective of whether they live in treated or control clusters. Columns 2 and 3 compare T1 and T2 households, respectively, to all control households. Column 4 compares all households in treated clusters (both treated and control households) to those in control clusters, Column 5 compares treated households to
20 Results by gender are tabulated at each polling station. This is possible because in Pakistan polling areas and polling booths are separated by gender.
13
households in control clusters only and finally Column 6 compares control households in treated clusters to households in control clusters. Overall, there is little difference in household
characteristics across samples. Treated households have a little more land than control
households in some comparisons, but no difference in assets or housing quality. The P-value of an F-test that all variables are jointly insignificant can never be rejected. In Panel B, the same comparisons are reported for woman characteristics. Women in treated households are somewhat younger in some comparisons and have more young children as a result. They also appear to have less access to cable TV, perhaps due to their lower mobility. An F-test that all woman level variables are jointly insignificant cannot be rejected in 4 out of 6 comparisons. In the analysis we control for all household and woman characteristics that lack balance across treatment and control groups.
Appendix Table A4 suggests that the intervention was successfully implemented: all treated women correctly recall having received a visit and none of the control households do. In addition, most treated women correctly recall the content of the messages delivered. Finally, control women in treated clusters are far more likely to report talking to their neighbors about political issues related to party or candidate positions and the importance of voting in accordance with one‘s own preferences, providing the first piece of evidence of information spillovers.
Follow-up data also suggest that there were no major incidents during Election Day in the study villages.21 Virtually all sample women had possession of their National Identification Cards (NICs) before they left for the polling station and ninety percent of the women who voted also found that the instructions in the polling station were appropriately displayed and that no one else was present inside the booth when they cast their vote. While most women (61 percent) travelled on foot, a substantial number (26 percent) used transportation provided by a political party, which is legal in Pakistan. However, almost all women went to the polling station with others. The majority were accompanied by female household members (62 percent), or a female friend or relative (25 percent). The rest went with their spouses or another household male.
21 In contrast, media reports from the northwest of the country indicate that several female polling stations remained empty because village elders actively prevented women from voting (AP, February 18th, 2008).
14
3. Empirical Strategy and Results
3.1 Turnout and Information Spillovers
Because treatment is assigned randomly at the geographical cluster level, its impact on female turnout can be estimated via the following OLS regression equation:
(1)
where indicates whether woman i in household h in cluster c in polling station p in village v is verified as having voted (1=Yes), is the treatment indicator (1 if woman i in household h in cluster c in polling station p in village v received the voting awareness campaign), and
is a vector of polling station, household and individual woman characteristics. We follow Bruhn and McKenzie (2009) and include household and woman characteristics from Table 2 that lack balance (total land owned, age, access to cable, number of children under 5 years old) as well as variables which are likely to influence voting behavior such as zaat (caste), having an NIC, mobility, schooling and whether the women seeks advice from a religious leader or ―Pir‖.22 Finally, we include in the total number of women registered to vote in the polling station.
Inclusion of corrects for baseline imbalances and increases efficiency by absorbing residual variation in the data.23 We also include a village fixed effect to remove the influence of village specific unobservable characteristics. The term is a mean-zero error. Since the unit of randomization is the geographical cluster, standard errors are always clustered at this level (Moulton 1986).
A modified version of Equation (1) measures the effect of T1 and T2 separately:
(2) The coefficients capture the impact of treatment on turnout and are the main coefficients of interest.
22 Although the NIC is required to vote, some women in our sample were verified as having voted, though they did not have an NIC.
23 Some of the variables were collected at baseline, prior to the campaign, while others were collected in the follow up survey. In either case, they are not characteristics that could be affected by the campaign.
15
Table 3 reports the results. In order to capture the importance of within cluster spillovers, we run Equation (1) in Panel A and Equation (2) in Panel B using four different subsamples. In column 1, we simply compare treated women to all control women, regardless of their location
(comparison T-C). This comparison ignores spillovers altogether by grouping control women in treated clusters together with (control) women in control clusters. In column 2, we compare treated clusters with control clusters (comparison TN-CN). Here treated and control women in treated households are grouped together. In column 3, we compare treated women in treated clusters with women in control clusters (comparison T-CN). We therefore drop from the analysis control women in treated clusters. Finally, in column 4 we compare control women in treated clusters to women in control clusters by dropping treated women from the analysis (comparison CTN-CN). If spillover effects are important, the coefficient of interest in the first (naïve)
comparison should be smaller since control women in treated clusters are likely to have been influenced by treated women.
We indeed find that the naïve estimate in column 1, panel A, is lower than that of columns 2-4, at 6 percent. Thus, accounting for within geographical cluster spillovers increases the impact of treatment to about 12 percent. More importantly, control women in treated clusters are about as likely to vote as directly treated women.24 In Panel B, the pattern of lower estimates in column 1 compared to those in columns 2-4 is repeated and, as expected, estimates for the impact of T2 are larger. They are also more precisely estimated, although we are unable to detect statistically different effects between T1 and T2.25
While this strategy allows us to assess spillovers within treatment clusters effectively, it does not account for spillovers beyond the geographical cluster. It is plausible that women talk to other women outside the geographical cluster, especially women located near the boundary of the cluster. The design included gap clusters to ensure that control clusters were isolated from treated clusters, but women in these control clusters might have been affected directly or
24 A regression that includes both a treatment dummy and a dummy for control households in treated clusters shows that the coefficient on the treatment dummy is 0.117 and the coefficient on the dummy for control households in treated clusters is 0.124, though neither coefficient is statistically significant at conventional levels. The P-value of the t-test that both coefficients are equal is 0.798.
25 The impact of information on turnout for friends is in the same range as that for other control women in treated
clusters, ranging from 10 to 12 percent. This is not surprising given that the vast majority of confidants reside in the same cluster as the woman who identified them as her friend.
16
indirectly by the intervention and, as a result, even the estimates of columns 2-4 in Table 3 could be downward biased.
We use two strategies to assess spillover effects beyond the geographical cluster. First, we use the GPS location of every household in the study to compute the number of other treated and control households within a given distance radius and run the following OLS regression equation:
(3) Where is an indicator for whether household h is not treated but has at least one treated household within a distance radius of d meters, and is the total number of surveyed
households within distance radius d of household h.26 According to Table 1, the average distance between any two households in a cluster is 194.2 meters (0.12 miles) and the median distance is roughly 100 meters. In contrast, the median distance between any two surveyed households in a village is roughly one kilometer (0.67 miles). We consequently use a radius of 75, 100 and 200 meters, which corresponds roughly to the 25th, 50th and 75th percentile of the distance between any two households within a cluster. The rest of the terms are as defined in Equation (1), and as before, standard errors are clustered at the geographical cluster level. The coefficients of interest are and . This specification allows for a simple test of the extent to which female turnout among control households near treated households resembles female turnout among directly treated households.
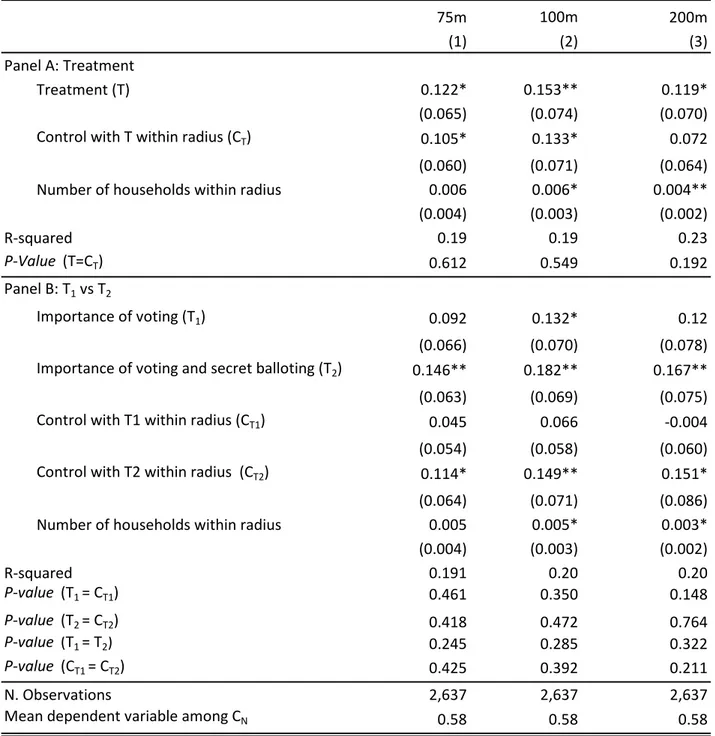
Panel A of Table 4 reports the results from Equation (3). The treatment effects are robustly significant and range between 12 to 15 percent. The estimate of is also significant in columns 1 and 2, and is comparable to the direct treatment effect, suggesting that geographical spillovers are large. Indeed, the t-test for is never rejected. The coefficient on the number of
households within a given radius, which can be interpreted as household density, is significant in columns 2 and 3, suggesting that turnout is higher in more densely populated areas within a village, perhaps because polling stations tend to locate there. Panel B reports the results for the
26 It is clear that the dummies and cannot both take value 1, since households are either treated or not.
Both dummies take value zero if the household was not treated ( ) and was located more than d meters from the closest treated household.
17
OLS regression equation analogous to Equation (2). We again find that the direct (and indirect) effect of T2 is somewhat larger than that of T1 but the difference is, again, not statistically significant, at conventional levels, in our sample.
The other strategy we use to study spillover effects beyond the geographical cluster is inspired by Kremer and Miguel (2001). In order to assess how treatment density within a given radius affects turnout, we rely on exogenous variation in the local density of treated women, by virtue of the cluster level randomization.27 Specifically, we construct non-overlapping concentric rings that are 200 meters wide around each sample woman. For each ring (or band) we compute the number of treated women within the band, as well as the total number of sample women. Since the median distance between any two households in the village is about one kilometer, the bands start at 0-200 meters and extend up to 1,200 meters. The regression specification in this case is
(4) Where is the number of treated women between distance d and D from each sample woman, and is the number of women interviewed between distance d and D from each sample woman. The rest of the terms are as defined in Equation (1) and standard errors are clustered at the geographical cluster level.
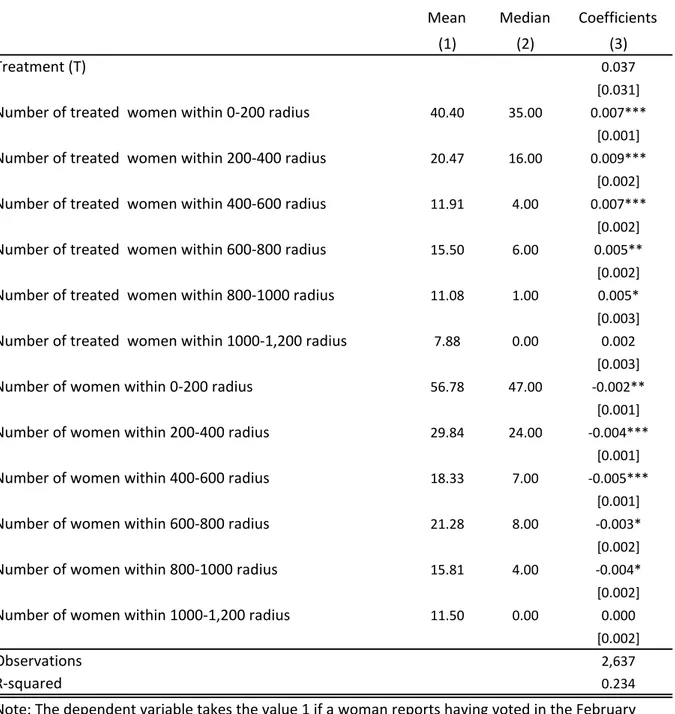
The estimates for can be used to estimate the average spillover gain for sample women from having treated women residing in close proximity. The coefficients are reported in Column 2 of Table 5. Spillover effects are significant up to 1,000 meters. The number of treated women ranges from 0 to about 161 women, with the largest number of treated women in the 0-200 meter range. Columns 1 and 2 in Table 5 report the mean and median number of treated women. Using only the coefficients that are significant, we estimate a mean increase in the odds of voting of 68 percent and a median increase of 45 percent.28 Consistent with our earlier results, once
proximity to other treated women is controlled for, the residual effect of being directly treated is nil (i.e. ). Clearly, social interactions among women with mobility constraints are largely
27 Kremer and Miguel (2001) assess cross-school externalities using exogenous variation in the local density of treatment school pupils generated by the school-level randomization.
28To see this, note that the spillover gain is the average number of treated women located within 0-200 meters times the average effect of having an additional treated woman in this range ( plus the analogous spillover effects due to treated women located between 200-400, 400-600, 600-800 and 800-1,000 meters from a woman.
18
dictated by geographic proximity. Communication is easy and can happen over laundry, cooking and childcare which require little movement away from home.
Finally, we assess the size of information spillovers at the polling station level, using official electoral results by gender. Using polling station level information allows us to look at spillovers for all registered voters in the village and to check potential spillover effects of the information campaign on both men and women. Sample villages have between 1 and 3 polling stations each and the average distance of households from their matched polling station is roughly one kilometer (see Table 1). The outcome of interest in this case, is the turnout rate in polling station p in village v, that is, the number of votes cast by women (men) divided by the number of registered women (men). Correspondingly, the impact of treatment, , is the share of treated women measured as the number of women treated in polling station p in village v divided by the number of registered women.29 We include a vector of polling station level variables, to control for polling station level differences. This yields the following regression specification:
(5)
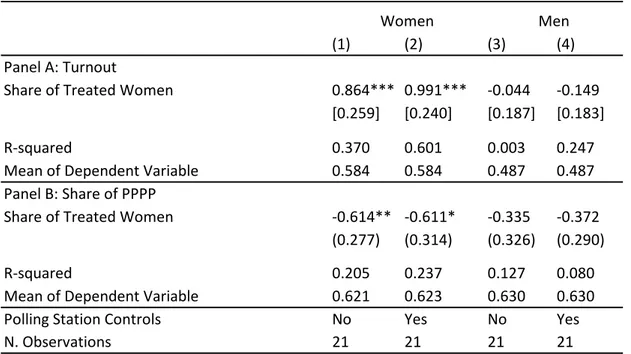
Columns 1 and 2 in Panel A of Table 6 show that an increase in the share of treated women in the polling station increases female turnout by 86 to 99 percent, depending on whether polling station controls are included. This provides further confirmation of the size and significance of the spillover effects we find in Table 5.30 In contrast, there is no effect for male turnout (Table 6, columns 3 and 4). The fact that men are not influenced by information provided to women could reflect men‘s greater exposure to political information, wider networks or simply lack of
effective communication between men and women on political issues.
3.2 Candidate Choice
We now turn to the impact of the awareness campaign on candidate choice. Table 7 reports the results of specifications (1) and (2) above where now indicates whether woman i in household h in cluster c in polling station p in village v reported voting for PPPP and is verified as having voted. As before, the estimates in column 1 compare treated households to control
29 The variable ranges from 0 to 0.77.
30 Note that the results from Table 5 indicate that spillover effects are significant up to one kilometer, on average.
19
households in both treated and control clusters. They do not account for spillover effects and as a result, the coefficient is about one third smaller in magnitude than those of columns 2-4 which do account for spillover effects. Panel A shows that on average, the campaign reduced the
probability of voting for PPPP by about 15 to 22 percentage points. In Panel B, the impacts for T2 are again larger in absolute value and more precisely estimated than those of T1, but we cannot reject the null that the estimates are equal.
Columns 1 and 2 of Panel B of Table 6 confirm these results at the polling station level. The share of treated women in a polling station reduces the PPPP female vote share. In particular, a 10 percent increase in the share of treated women led to a reduction of 6 percent in the share of PPPP female votes. Similar to the turnout results of Panel A, columns 3 and 4 of Panel B show that the campaign had no effect on the PPPP male vote share. Given that the awareness campaign did not mention any candidate or party by name, the fact that it appears to have affected not just turnout, but also party vote shares is remarkable and could have important policy consequences.
One plausible explanation for the impact on the party vote shares is that in an environment where one party (the PPPP) was likely to get a landslide, the campaign may have induced women supporters of PML-F to vote in greater numbers, thereby increasing the share of PML-F, although the PML-F is not reputed to be pro-women in any way.
With these results in hand, we now turn to a more direct test of the relevance of the information content of the campaign by assessing the quality of information possessed by the male head on the candidate choice of women in his household. In the follow-up survey, the male head was asked about whether or not each woman in the household had voted and, if she had, whom she had voted for. The same information was solicited from each woman about all the other women in the household. Using these unique data, we can check the extent to which these cross-reports, i.e., the reporter‘s choice of candidates for a woman, are in agreement with the candidate choice reported by the woman herself. The indicator of agreement takes the value 1 if the two reports match, and is zero otherwise.31 Candidate choice information is available for all women who
31 If the reporter stated that a woman did not vote when she reported voting and was verified as doing so, the
agreement indicator is coded as missing. This is the case for less than 5 percent of the reports by men and roughly one percent of the reports by other women. Likewise, if the reporter answers ―I don‘t know‖ when asked whom a given woman voted for, we code the agreement indicator as missing. This is the case for 7 out of 1,421 reports by men (less than 0.5 percent) and only one report by other women. We follow this approach because lack of knowledge about a woman‘s voting behavior could reflect either indifference or freedom to select whomever she
20
self-report that they voted, but we restrict the sample to women who were verified as having voted. The final sample includes 3,713 cross reports and 1,220 women, with the number of observations per woman varying by household size.32
If the campaign successfully conveyed information on the secrecy of the ballot then household members, and particularly the male head, should have less information on the candidate choice of women in the household. We test this with the following regression
(6) where is an indicator that takes the value 1 if the report of individual i on individual j‘s choice of candidate is correct (according to j‘s self-report); is an indicator for whether reporter i is the male head; and is reporter i‘s vector of polling station, household and individual characteristics. The error term is likely to be correlated across all observations with the same reporter i and reportee j, but we still cluster standard errors at the geographical cluster level, which is more conservative than using QAP (Krackhardt, 1988) or the correction in Fafchamps and Gubert (2006).
The results are presented in Table 8. The coefficient of interest is which captures the differential effect of treatment on the quality of male reports about the candidate choice of women in the household. The results indicate that treatment reduces male knowledge about women‘s chosen candidates by about 8 percentage points. As before, effects are larger and measured more precisely for T2. Interestingly, the reduction in male knowledge is larger and significant for controls in treated clusters (column 3) and is the only instance where the effects for T2 are significantly different from T1 (p-value=0.067). These results are consistent with reported conversations on political matters with neighbors in Panel B of Table A4. Controls in treated clusters are far more likely to discuss political issues with their neighbors as compared to women in control clusters and are equally likely to do so when compared to directly treated desires. Given the low percentage, results do not change if we recode them with a value 0. Note that out of the 1,220 women who report having voted, and were verified as doing so, only one declined to answer whom she voted for.
32 Among the 2,637 women in the sample, 1,543 were verified as having voted. The discrepancy in sample sizes of voters come from 21 percent of women that were verified as having voted but self-reported as not having done so.
Interestingly, we also find evidence of conformity bias (Silver et al., 1986; Harbaugh, 1996) since treated women that had not voted are significantly more likely to self-report as having done so compared to women in control clusters (40.6 percent vs. 34.8 percent, p-value= 0.001). This is especially true in more contested polling stations (45.3 percent vs. 35.8 percent, p-value= 0.000).