Subducting oceanic basement roughness impacts on upper-plate tectonic structure and a backstop splay fault zone activated in the southern Kodiak aftershock region of the Mw 9.2, 1964 megathrust rupture, Alaska
Anne Krabbenhoeft
1,*, Roland von Huene
2,*, John J. Miller
3,*, and Dirk Klaeschen
11GEOMAR Helmholtz Center for Ocean Research Kiel, Wischhofstr. 1-3, 24148 Kiel, Germany
2U.S. Geological Survey, Scientist Emeritus, Moffett Field, California 94035, USA
3U.S. Geological Survey, Scientist Emeritus, Denver Federal Center, Denver, Colorado 80225, USA
ABSTRACT
In 1964, the Alaska margin ruptured in a giant Mw 9.2 megathrust earthquake, the second larg- est during worldwide instrumental recording. The coseismic slip and aftershock region offshore Kodiak Island was surveyed in 1977–1981 to under- stand the region’s tectonics. We re-processed multichannel seismic (MCS) field data using current standard Kirchhoff depth migration and/or MCS traveltime tomography. Additional surveys in 1994 added P-wave velocity structure from wide-angle seismic lines and multibeam bathymetry. Published regional gravity, backscatter, and earthquake com- pilations also became available at this time.
Beneath the trench, rough oceanic crust is covered by ~3–5-km-thick sediment. Sediment on the subducting plate modulates the plate interface relief. The imbricate thrust faults of the accreted prism have a complex P-wave velocity structure.
Landward, an accelerated increase in P-wave veloci- ties is marked by a backstop splay fault zone (BSFZ) that marks a transition from the prism to the higher rigidity rock beneath the middle and upper slope. Structures associated with this feature may indicate fluid flow. Farther upslope, another fault extends >100 km along strike across the middle slope. Erosion from subducting seamounts leaves embayments in the frontal prism.
Plate interface roughness varies along the sub- duction zone. Beneath the lower and middle slope, 2.5D plate interface images show modest relief, whereas the oceanic basement image is rougher.
The 1964 earthquake slip maximum coincides with the leading and/or landward flank of a subducting seamount and the BSFZ. The BSFZ is a potentially active structure and should be considered in tsu- nami hazard assessments.
■ INTRODUCTION
In subduction zones, evaluating the effects of rough subducting seafloor topography on sub- duction megathrust earthquakes is important for assessing seismic and tsunami hazards (Wang and Bilek, 2014; Lallemand et al., 2018, and references therein). Typically, rough subducting plate topog- raphy affects interplate boundary processes (e.g., Rosenbaum and Mo, 2011), and it may act as a bar- rier between earthquake aftershock regions (e.g., Nakai, Peru, Kodaira et al., 2000; Robinson et al., 2006). Scholz and Small (1997) propose that rough subducting oceanic plate topography could increase normal stress and seismic coupling along the plate interface and may therefore lead to large-magnitude earthquakes along the subducting megathrust. In contrast, Wang and Bilek (2011) propose that great earthquakes occur where the subducting megath- rust plate interface is smooth, whereas upper-plate fracturing and aseismic creep may be favored
where rough oceanic basement subducts. This would inhibit the generation of great megathrust earthquakes or result in multiple patches of slip and complex ruptures. Subducting plate topogra- phy also induces along-strike variation in trench and forearc morphology (e.g., Kopp, 2013).
Hydrologic systems and tectonic processes in subduction zones are tightly interconnected (Saffer and Tobin, 2011), including the generation of exten- sive thrust zones (Hubbert and Rubey, 1959), the control of wedge geometry (Davis et al., 1983), and the alteration of physical properties in sedi- ments (Karig, 1990), thereby affecting deformation mechanics. The presence of fluids entrained during underthrusting of sediment and basement relief into the subduction zones leads to elevated pore fluid pressures with landward increasing load of the accretionary prism on the plate interface (von Huene et al., 2009). This may influence frictional properties and seismic slip behavior on the shallow subduction zone (Hubbert and Rubey, 1959; Byrne et al., 1988; Lallemand et al., 1994; Bangs et al., 2009).
Splay faults branching upward from the plate interface exist at many subduction boundaries and may play an important role in tsunami hazard (Moore et al., 2007). The activation of splay faults during megathrust ruptures can amplify coseismic vertical seafloor displacement (Moore et al., 2007), thus producing large tsunamis that are hazardous to neighboring coastal regions (Lay and Bilek, 2007;
Wendt et al., 2009; Bilek, 2010). In several subduc- tion settings, splay faults have been mapped with
GEOSPHERE
GEOSPHERE, v. 17, no. 2 https://doi.org/10.1130/GES02275.1 20 figures; 2 tables
CORRESPONDENCE: akrabbenhoeft@geomar.de
CITATION: Krabbenhoeft, A., von Huene, R., Miller, J.J., and Klaeschen, D., 2021, Subducting oceanic basement roughness impacts on upper-plate tectonic structure and a backstop splay fault zone activated in the southern Kodiak aftershock region of the Mw 9.2, 1964 megathrust rupture, Alaska: Geosphere, v. 17, no. 2, p. 409–437, https://doi.org/10.1130/GES02275.1.
Science Editor: Shanaka de Silva Guest Associate Editor: Laura M. Wallace
Published online 25 February 2021 Received 16 April 2020 Revision received 26 October 2020 Accepted 5 January 2021
This paper is published under the terms of the
CC-BY-NC license. *E-mail: akrabbenoeft@geomar.de; rhuene@mindspring.com;
jmiller@usgs.gov
seismic methods, and in some subduction zones, they are proposed to be related to tsunami earth- quakes; these include Japan 1896 (Kanamori, 1972), Nicaragua 1992 (Kanamori and Kikuchi, 1993), Uni- mak Alaska 1946 (Johnson and Satake, 1997; von Huene et al., 2016), and Java 2006 (Fan et al., 2017).
In this study, we identify a splay fault zone at the transition of the lower slope accretionary prism to the middle continental slope at the backstop. We term such a splay fault zone as the “backstop splay fault zone” (BSFZ).
The forearc structure and seismic compressional velocities (Vp) are a measure of elastic properties.
They document the patterns of permanent defor- mation that a margin has experienced over many seismic cycles (Sallarès and Ranero, 2019). In the southern Kodiak aftershock region following the giant Mw 9.2 1964 earthquake, we investigate the tectonic framework with multibeam bathymetry, multichannel and wide-angle seismic data, seis- micity, and global gravity data to better understand the interaction of subducting plate topography with the trench and forearc structure. We find that even though rough subducting oceanic basement topography plays a modest role in affecting the BSFZ structure, structural features of the incom- ing igneous basement such as fracture zones affect upper-plate deformation in the accretionary prism to the middle slope. This occurs despite a ~1.5-km-thick, lower-plate sediment layer that moderates the impact of basement relief. Additionally, subducting oceanic basement relief may play a major role in redirecting megathrust slip up the BSFZ rather than beneath the outer accretionary prism.
Tectonic Setting
The Mw 9.2 earthquake of 28 March 1964 was the largest instrumentally documented earthquake in Alaska and the second largest in the instrumental record (Christensen and Beck, 1994). It ruptured 680–740 km of convergent plate boundary between the Pacific and North American plates from Mid- dleton Island in the northeast to Albatross Bank in the southwest (Fig. 1, Plafker, 1965; Johnson et al., 1996; Ichinose et al., 2007). Two areas of the highest
160˚W 158˚W 156˚W 154˚W 152˚W 150˚W 148˚W 146˚W
160˚W 158˚W 156˚W 154˚W 152˚W 150˚W 148˚W 146˚W
54˚N 56˚N 58˚N 60˚N
54˚N 56˚N 58˚N 60˚N
−7000 −6000 −5000 −4000 −3000 −2000 −1000 0 1000 2000 3000 4000 5000 Bathymetry [m]
0 100
km
200
Alaska
P a tton & M
u r r ay S C A j a F Z
Kodiak & Bowie S C
63 mm/yr SI
CI
KS
SHI
Alaska trench
57 mm/yr
60 mm/yr
Pacific plate
5 8 ° F Z
5 6 ° F Z 64
108 12
4 6 810 12
68 10 4 4
8
9 706
109 111
113 115
106 117 119120116MGL15 V
V
V KodiakIsland
Mw 9.21964
Mw 8.21938
MI MTI
segmentPWS
AB
Kodiak segment
Semidi segment
segmentSH
Kenai shelf
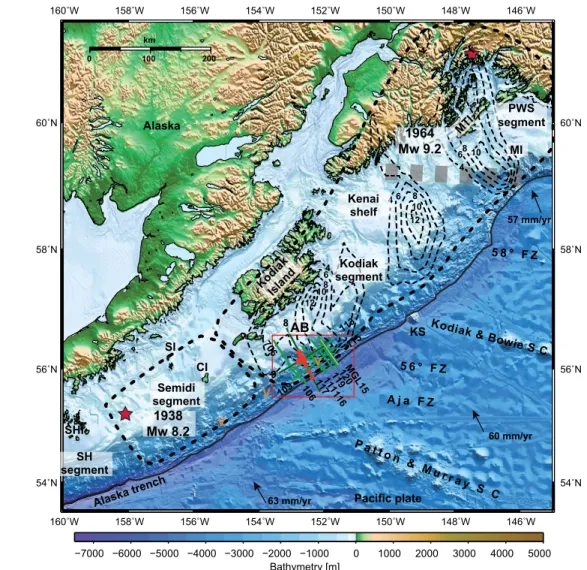
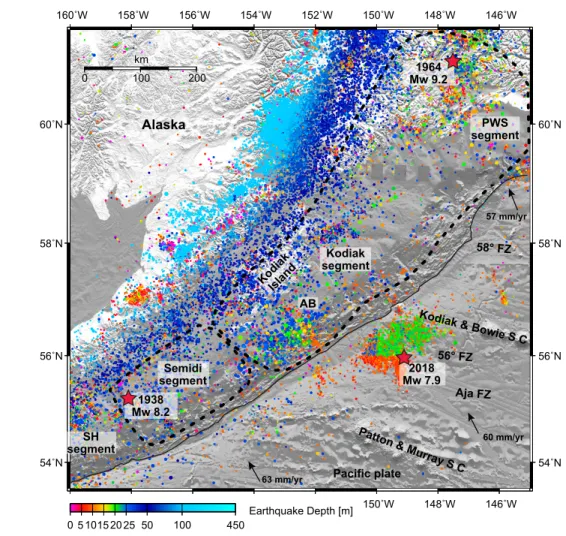
Figure 1. Bathymetric overview map of the Alaska subduction zone. Red stars denote epicenters of the 1964 giant and 1938 great Alaska subduction earthquakes; annotated Mw indicates earthquake moment magnitudes; and bold, black dashed lines encircle their afterslip regions. Black dashed annotated isolines in the 1964 giant earthquake region mark zones of the largest slip (m; after Ichinose et al., 2007). Rupture segments are annotated, and wide dashed gray line marks division of Prince William Sound and Kodiak segments. The solid black line marks the plate boundary. Annotated arrows show plate motion and velocity relative to the North American plate (MORVEL, DeMets et al., 2010). Numbered solid lines show seismic lines; green and light green—Albatross legacy and new multichannel seismic (MCS) data;
black—wide-angle; red dots are ocean bottom hydrophone (OBH) locations. Figure A1 shows seismic profile and station locations in greater detail. PWS—Prince William Sound; MTI—Montague Island; MI—Middleton Island; FZ—fracture zone; KS—Kodiak Seamount; SC—Seamount chain; AB—Albatross Bank; CI—Chirikof Island; SI—Semidi Islands; SH—
Shumagin; SHI—Shumagin Islands, orange V—vent locations. Red box marks region shown in Figures 9, 13, A1, and A6.
coseismic moment release correspond with two aftershock regions named the Prince William Sound and Kodiak aftershock regions (Fig. 1). The Prince William Sound aftershock region is the site of colli- sion of the Yakutat terrane with North America (e.g., Lahr et al., 1988; Gulick et al., 2007). The Kodiak aftershock region is a typical convergent margin subduction zone and has been active since Creta- ceous time. In the downdip direction, the Kodiak rupture zone is ~150 km wide (e.g., Savage et al., 1999; Sauber et al., 2006). In the Kodiak region, two
areas of large slip occurred beneath the continen- tal shelf and slope. The northeastern portion of the Kodiak rupture segment occurred seaward of the Kenai shelf, and the other is in the southwest, offshore Kodiak Island (Fig. 1). The northeastern rupture segment is located on the 58° subducting fracture zone associated with many seamounts that are buried by Surveyor fan and Alaska trench sediment (von Huene et al., 2012, Fig. 1). The south- western area of large slip is subdivided into two centers of 12-m slip (Ichinose et al., 2007). One lies on the projection of the subducted Kodiak and Bowie Seamount chain that is marked by Kodiak Seamount in the Alaska trench axis (Fig. 1). The other slip center extends seaward of Albatross Bank to the trench axis and lies at the continuation of an E-W–oriented subducting fracture zone system (Fig. 1), including the 56° fracture zone (Naugler and Wageman, 1973; Reece et al., 2013). On the outer rise, that fracture zone system ruptured during the unusual 23 January 2018 intra-oceanic plate Mw 7.9 Gulf of Alaska strike-slip earthquake, an aftershock region of the giant 1964 earthquake (Krabbenhoeft et al., 2018; Lay et al., 2018; Ruppert et al., 2018).
The average velocity of plate convergence is
~60 mm/yr (DeMets et al., 2010) and almost nor- mal to the trench in the Kodiak aftershock region (shown by arrows, Fig. 1). However, N-S–aligned oceanic crustal fabric trends ~30° oblique to the trench (Krabbenhoeft et al., 2018) and parallel to ocean plate-bending faults, expressed in regional multibeam bathymetry (Reece et al., 2013). Paleo- seismic studies of uplift rates in silt-peat sequences of the Copper River Delta (Reimnitz, 1966; Plafker et al., 1992) and reconstructions of coseismic uplift of marine terraces on Middleton Island indicate
recurrence intervals of megathrust earthquakes sim- ilar to the 1964 event ranging from ~400 to ~1400 years (Plafker, 1987; Goes, 1996; Carver and Plafker, 2008; and references therein). Smaller megathrust earthquakes (magnitudes ranging from 7.5 to 9.2) in the Kodiak aftershock region occurred more fre- quently, on the order of 4–64 years (Goes, 1996, and references therein).
To the southwest, the landward extension of the Patton and Murray Seamount chain separates the Kodiak aftershock region from the Semidi aftershock region that ruptured in the 1938 Mw 8.2 earthquake (Fig. 1). However, no structural link between the sub- ducted Patton and Murray Seamount chain and the rupture boundary has been reported so far despite their common location. Farther southwest of the Kodiak aftershock region, BSFZs have been identified in the Alaskan subduction zone segments as far as the Unimak segment, where they form the transition between the lower slope and the backstop at the base of the middle slope. Variations of the BSFZ along the Alaska-Aleutian subduction zone are discussed by von Huene et al. (2020). The BSFZ has been identified as a continuous structure along the entire length of the Semidi region (Fig. 1, von Huene et al., 2015) into the Unimak region (von Huene et al., 2016, 2019). All Alaska margin regions have ruptured in great earth- quakes during the time of instrumental recording except the Shumagin area. The Semidi margin rup- ture in the 1938 Mw 8.2 earthquake produced only a small tsunami because of the great depth of the rupture. The BSFZ has possibly played a role in past great earthquakes and tsunamis in this part of Alaska, although this is difficult to determine definitively with existing data. A splay fault seaward of the mid-slope terrace has been proposed as possibly involved in the far-field tsunami source of the 1946 Unimak tsu- nami earthquake (von Huene et al., 2016).
Alaskan megathrust earthquakes have been very destructive in the past, and a future earth- quake may cause significant damage from local as well as trans-oceanic tsunamis. This paper is a contribution to understanding structures and pro- cesses that may be involved in Alaskan megathrust ruptures. Our study involves a combination of sea- floor morphology with a network of reprocessed seismic data to show the distribution of splay faults
in the margin wedge as well as subducting oceanic basement relief and its impact on upper-plate tec- tonic structures. Our study is focused seaward of Albatross Bank in the 1964 southern Kodiak after- shock region, which hosted the largest coseismic slip (Ichinose et al., 2007, Fig. 1) during 1964 and an afterslip maximum (Suito and Freymueller, 2009).
■ GEOPHYSICAL DATA AND METHODS Bathymetric Data
Regional multibeam bathymetric data (Flueh and von Huene, 1994; Suess, 1994; Reece et al., 2013; Shillington et al., 2015) were processed using the MB-System (Caress and Chayes, 1996, 2017;
Caress et al., 2008) and GMT (Wessel and Smith, 1998), both open-source processing software pack-
ages. The bathymetry grids, 150 m × 150 m for the overview map and 100 m × 100 m for the detailed maps (e.g., Fig. A1), were calculated using the WGS84 horizontal datum and a Gaussian weighted mean filter gridding algorithm (Caress and Chayes, 1996, 2017; Caress et al., 2008). In regions with no ship-depth soundings, a compilation of Lim et al.
(2009), the GEBCO 30 arc-second global grid of ele- vations, the GEBCO_2014 Grid (Becker et al., 2009;
Weatherall et al., 2015), and the GEBCO 2019 grid (GEBCO Compilation Group, 2019) were combined with the processed multibeam bathymetry grid to create the bathymetric maps (Fig. 1).
Seismic Data
In this study, wide-angle data acquired in 1994 from ocean bottom hydrophones (OBHs; Flueh and Bialas, 1996; Figs. 2–4) and coincident multichannel seismic (MCS) data were used to obtain the struc- tural images and P-wave velocity-depth models of the subduction zone in the Albatross and adjacent regions of the Alaskan subduction zone. MCS leg- acy data acquired by the U.S. Geological Survey (USGS) research vessel (RV) S.P. Lee in 1977 and 1981 (cruises L-7-77-WG and L-7-81-WG, available at https:// walrus .wr .usgs .gov /namss/; Bruns et al.,
1987) as well as one recently acquired MCS line with RV M.G. Langseth (line MGL15 of cruise L-09-11-GA;
Frederik, 2016, available at https://walrus.wr.usgs .gov /namss/) were investigated.
The OBH and MCS data were processed using an iterative process. The depth-converted P-wave velocity model for the preliminary pre-stack time migration (MGL15) served as a reference starting model for the OBH seismic 2D joint refraction and reflection tomography (Korenaga et al., 2000). The final P-wave velocity models are shown in Figures 5, A2, and A3. The result of the 2D refraction and reflection tomography was the starting model for the Kirchhoff pre-stack depth migration (PSDM) of
the MCS data. MCS lines MGL15 (Fig. 6) and 117 (Fig. 7) were studied in greater detail, and therefore the velocity-depth models were derived in a more time-consuming way by using the data-driven trav- eltime reflection tomography.
Reprocessing MCS data improved and con- strained the image of the upper, sedimentary structure of the margin. OBH seismic tomography processing was aimed at constraining the P-wave velocity model, in particular for the deeper part of the margin (e.g., the crustal structure) as well as the geometry of the subduction plate interface to the oceanic crust Moho. A detailed description of the seismic methods is given in the Appendix.
■ RESULTS
We start with the seaward part and succes- sively proceed landward up to the shelf of the 1964 southern Kodiak aftershock region. Note that some morphological structures become more clear when viewed with the background of subsurface struc- tures in seismic images of the following section.
Bathymetric Studies—Seafloor Morphology
The seafloor of the incoming Pacific plate is smooth, except for a few seamounts and ridges.
0 1 2 3 4 5 6 7 8 9 10 11
Time [s] - Dist [km] / rv = 8.0 [km/s]
0 2 4 Depth [km] 6
0 2 4
90 80 70 60 50 40 30 20 10 06
100 110 120 130 138
Profile length [km]
88.656/0.418 km
47 48 49 50 51 52 53 54
55 56
0 1 2 3 4 5 6 7 8 9 10
-50 -40 -30 -20 -10 0 10 Distance [km]20 30 40 50 60 70 80 11
0 1 2 3 4 5 6 7 8 9 10 11
Time [s] - Dist [km] / rv = 8.0 [km/s]
0 1 2 3 4 5 6 7 8 9 10
-50 -40 -30 -20 -10 0 10 20 30 40 50 60 70 80 11
SO96 Profile 8 OBS 47 M
M
NNW SSE
M M Pn oc
Ptoc
Pup Pup
Pn oc Plp
Ptoc
A
B
C
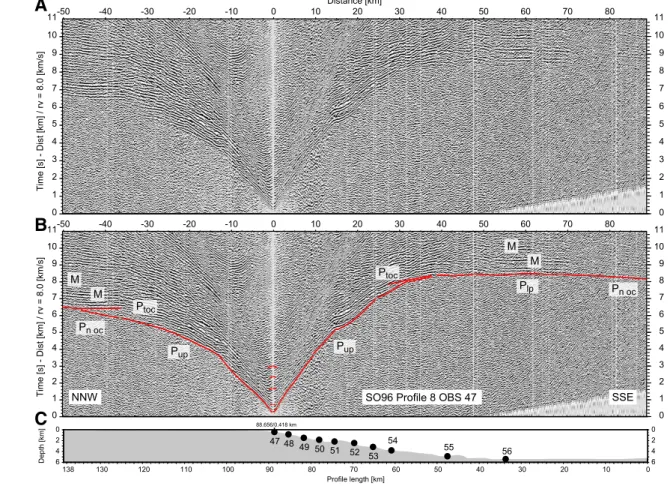
Figure 2. (A) Ocean bottom hydrophone (OBH) data example at landward end of profile P8 displayed with reduced velocity (rv) of 8 km/s. (B) Calculated traveltimes (red) through final velocity depth model with OBH section. Picked phases (red) include: Pup—refraction through upper plate; Plp—refraction through lower plate; Ppi—reflection of plate interface; Puc—reflection of upper crust; Ptoc—reflection of top of oceanic crust of subducting plate; PmPoc—reflec- tion of oceanic Moho; Pnoc—refraction through subducting oceanic mantle;
M—multiple. (C) Depth section of pro- file P8 with OBH stations indicated by numbered filled circles.
Long-wavelength structures conform to underlying fracture zone systems (Figs. 1, 8, and A4). Subtle plate-bending faults parallel to seafloor spreading fabric and at 30° to the trench axis (Fig. 9) are only visible with high-resolution multibeam bathymetry (e.g., Reece et al., 2013; Krabbenhoeft et al., 2018).
The ~5.5-km-deep trench has a smooth seafloor.
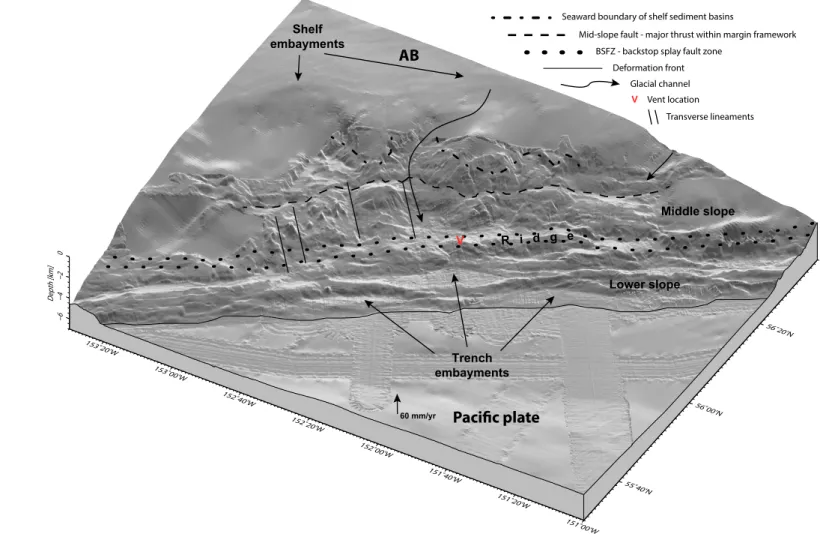
Across the forearc, two major contrasting mor- phology domains are evident in the perspective diagram of the original multibeam bathymetry (Fig. 9): a shallow-dipping, smooth lower slope and a steep and rough middle and upper slope (Fig. A5).
The lower slope shows long trench-parallel ridges
in a zone adjacent to the trench axis (Fig. 9). Three embayments or “cookie bites” incise the accre- tionary ridges of the margin toe (Fig. 9), which are commonly associated with subducting seamounts or ridges that erode the prism. The transition between the two differing tectonic domains from lower to middle slope is broadly defined in the mor- phology. Its seafloor expression is marked by the BSFZ (Fig. 9), an along-strike continuous structure of major splay faults that displace the seafloor up to
~200 m (e.g., Fig. 6). The BSFZ forms a ridge at the slope break between accretionary and middle prism (Fig. 9). The steep middle to upper slope owes its
morphology to competent older rock such as that of Eocene age. Rock of Eocene age was drilled on the shelf edge (Turner et al., 1987) and imaged seismically a short distance down the upper slope (Winston, 1983). The lower-slope ridges parallel- ing the trench axis indicate the accretionary prism (Miller and von Huene, 1987; von Huene et al., 2012).
The cross-sectional area of the accretionary prism is roughly equivalent to the sediment volume that would be accreted to the prism in <1 m.y., assum- ing present convergence rates and trench sediment thickness (von Huene et al., 1998). Therefore, the difference in age between Eocene rock of the steep 3
4 5 6 7 8
Time [s] - Dist [km] / rv = 8.0 [km/s]
0 2 4 Depth [km] 6
0 2 4 06 2 4 6 8 10 12 14 16 18 20 22 24 26 28 30 32 34 36 38 40 42 44 46 48 50 52 54 56 58 60 62 64 66 68 70 72
Profile length [km]
33.706/5.411 km
52 53 54 55 56
3 4 5 6 7 8 3
4 5 6 7 8
Time [s] - Dist [km] / rv = 8.0 [km/s]
3 4 5 6 7
-35 -30 -25 -20 -15 -10 Distance [km]-5 0 5 10 15 20 25 30 8
-35 -30 -25 -20 -15 -10 -5 0 5 10 15 20 25 30
SO96 Profile 8 OBS 56
NNW SSE
Pn oc
Pn oc Ptoc
Ppi
PmPoc PmPoc
A
B
C
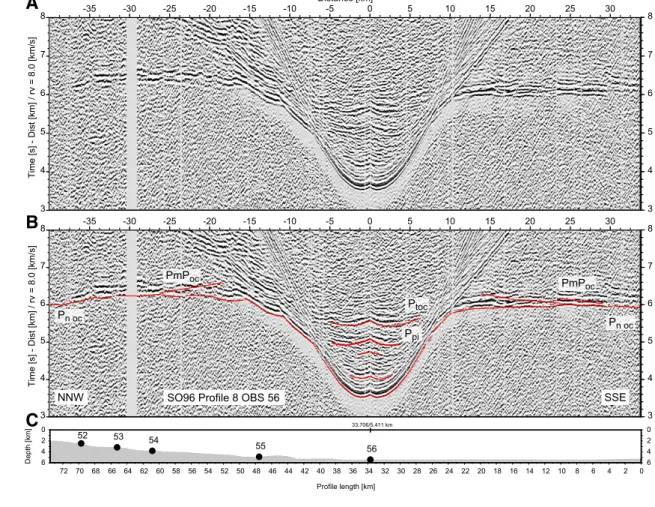
Figure 3. (A) Ocean bottom hydrophone (OBH) data example at seaward end of profile P8 displayed with reduced velocity (rv) of 8 km/s. (B) Calculated traveltimes (red) through final velocity depth model with OBH section. Picked phases (red) include: Ppi —reflection of plate interface; Ptoc—reflection of top of oceanic crust of subducting plate;
PmPoc—reflection of oceanic Moho; Pnoc— refraction through subducting oceanic mantle. (C) Depth section of profile P8 with OBH stations indicated by num- bered filled circles.
slope and accreted trench sediment is unquestion- ably large (ca. 30–50 Ma).
The current seafloor morphology appears to have been shaped by relief that subducted during the Quaternary. A broad age reference is the glacial channel extending across the shelf from Kodiak Island that empties onto the slope to form a canyon where line 111 is located (Figs. 1, 9, A1, and A4). The channel terminates at the accretionary prism, indi- cating the prism postdates glaciation. Southwest of line 117, multibeam bathymetry across the middle slope (Figs. 9 and A1) shows transverse lineaments paralleling the plate convergence vector or roughly
~85° to the trench axis and regional trend. These
plate vector-parallel lineaments may suggest sub- duction of significant lower-plate relief that also predates the current accretionary prism. Addition- ally, the seafloor morphology of this area shows rough small-scale (~100–200-m-high and ~100-m- to 3–4-km-across) blocks or small cones (Fig. A1, between seismic lines 106, 117, 113, and 109). A prominent mid-slope fault offsets the seafloor up to ~350 m in seven seismic images, and multibeam bathymetry ties those fault images together in a series of cross sections across a ~100-km-long fault (Fig. 9). Differences in morphology on the upslope and downslope side of the fault indicate signifi- cant displacement prior to or during glacial erosion.
Up-slope of the mid-slope fault, the Miocene shelf sediment section can be followed down the upper slope to water depths of 1–2 km (Winston, 1983;
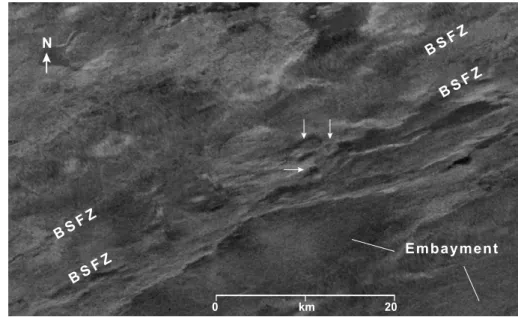
von Huene et al., 2012; Fig. 9). The Kodiak margin also hosts rare embayments in the shelf (numbered 1–5, Fig. A4). We have indicated glacial channels to distinguish these structures from the shelf embay- ments (Fig. A4). Embayments into the accreted prism are clearly younger than those farther up slope. GLORIA backscatter data (U.S. Geological Survey, 2011) reveal a smooth embayment seafloor in the accreted prism (Fig. 10, center, south of the vent location). A complex backscatter pattern along the middle slope, southwest of line 117, is consistent
-50 -40 -30 -20 -10 0 10 20 30 40 50
1 2 3 4 5 6 7 8 9 10 11
Time [s] - Dist [km] / rv = 8 [km/s]
52.906/2.074 km
1 2 3 4 5 6 7 8 9 10 11
-50 -40 -30 -20 -10 Distance [km]0 10 20 30 40 50
1 2 3 4 5 6 7 8 9 10 11
Time [s] - Dist [km] / rv = 8 [km/s]
1 2 3 4 5 6 7 8 9 10 11
0 2 Depth [km] 4
0 2 04 10
20 30
40 50
60 70
80 90
100 104
Profile length [km]
57 58 59 60 61
M M
W SO96 Profile 9 OBS 60 E
Puc
Ptoc Ptoc
Pup Pup
Plp Plp
PmPoc PmPoc
Pn
A
B
C
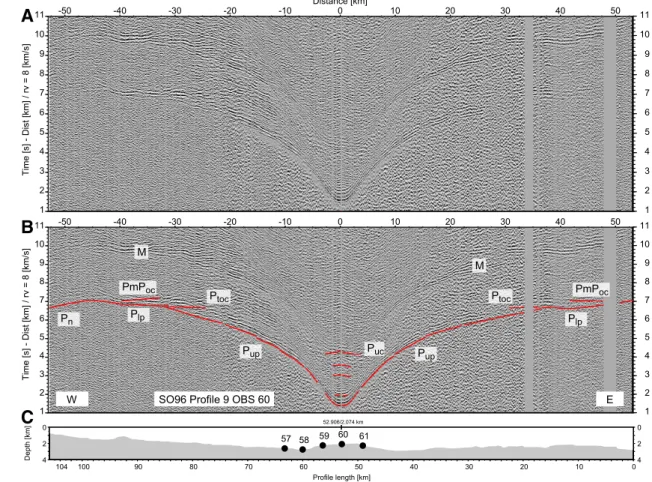
Figure 4. (A) Ocean bottom hydrophone (OBH) data example of profile P9 dis- played with reduced velocity (rv) of 8 km/s. (B) Calculated traveltimes (red) through final velocity depth model with OBH section. Picked phases (red) include: Ppi—reflection of plate interface;
Ptoc—reflection of top of oceanic crust of subducting plate; PmPoc—reflection of oceanic Moho; Pn—refraction through subducting oceanic mantle; M—multi- ple. (C) Depth section of profile P9 with OBH stations indicated by numbered filled circles.
with the rough morphology (northwestern section of Fig. 10). Lineaments trending at N60°E along the entire Kodiak margin are located along the BSFZ, and some of these host vent structures (Fig. 10; see Fig. 9 for vent location). These circular craters occur on round or elongated mounds ~3–6 km in extent.
Venting fluids were indicated locally by conductiv- ity, temperature, and depth (CTD) measurements (Suess, 1994) along the 1964 southern Kodiak after- shock region seaward of the BSFZ.
Seismic Studies (Wide-Angle and Multichannel) of the Albatross Area
Variable Structure of the Seemingly Smooth Incoming PlateThe density of MCS data in the Albatross area is greater than along any other segment of the Alaska margin, and it includes two OBH transects. The incoming plate sediment layer is ~3 km thick at the deformation front (line 8, Fig. 5), and here, the plate interface depth is constrained by wide-angle (WA) reflection and refraction data with P-wave veloci- ties ranging from 1.7 to 3 km/s. Where constrained by MCS tomography (line MGL15, Fig. 6B and line 117, Fig. 7B), seismic P-wave velocities of the incom- ing sediment locally show low-velocity zones in the gradually increasing velocities of sediment between the plate interface and oceanic basement.
This velocity structure is most clear near the defor- mation front above subducting seamounts and their trailing flanks (line MGL15, Fig. 6B). Seismic P-wave velocities range from 4.3 to ~7.0 km/s in the oceanic basement of the incoming plate (Figs. 6B and 7B). The average sediment cover of ~3 km (e.g., on lines 117–120, Figs. 7 and 11), increases to 4.5 km thickness at the deformation front on lines 111 (Fig. 11C) and 119 (Fig. 11D). The position of the plate interface and top of the oceanic crust are constrained by both WA (Fig. 5) and coinci- dent MCS data (Figs. 6, 7, and 11) to at least 30 km downdip of the deformation front. The shallow part of the subducting plate interface dips 4° (Fig. A5).
Typical oceanic crustal seismic P-wave velocities increase downward to the Moho, which is ~14 km
deep at the deformation front. In contrast to the seemingly smooth incoming seafloor on the Pacific plate (Fig. 1), the seismic data reveal numerous subducted seamounts and ridges beneath the Alaskan margin. Along line 117, three seamounts of ~500 m relief occur beneath the trench axis, as well as ~10 km and ~20 km farther down the sub- ducting basement (Fig. 7). In the subduction zone, the plate interface mimics the subducting oceanic basement relief in the region of the southeastern MCS lines 106, 117, and 111 (Figs. 7, 11C, 11D). The dimensions of the subducting seamounts range from ~0.5–~3 km height, and the smaller sea- mounts extend across ~5–10 km (e.g., lines 117,
106; Figs. 7 and 11D), while the larger and more complex subducting seamounts extend ~20 km across (e.g., line MGL15, Fig. 6). Where subducting seamount height exceeds ~1.5 km, the seamounts disrupt the subducting sediments and form the plate interface (from east to west in lines MGL15, 120, 111, just seaward of the deformation front, Figs. 6, 11A, and 11C). Additionally, the subduct- ing seamounts >1.5 km height locally increase the seismic P-wave velocities along the plate interface.
Across strike, reflectivity of the subducting plate interface is highly variable. The overall high reflec- tivity near the trench decreases downdip of the accretionary ridges (lines MGL15, 117; Figs. 6 and
4 4 4
4 4
4 4 4 4
6 6 6 6 6
6 6
8
Distance [km]
02 4
47 48 49
50 51 52 5354 55 56
68 1012 1416 1820 2224
Depth [km]
02 46 108 1214 1618 2022 24
Depth [km]
Vp [km/s]
N S
0 20 40 100 120 140
2 3 4 5 6 7 8
P8
P9VE = 2
60
DF
Depth [km]
4 4 4 4 4 4 4
6 6 6
02 46 108 1214 1618 2022 24
Depth [km]
02 46 108 1214 1618 2022 24
W E
Distance [km]
0 20 40 80 100
Vp [km/s]
2 3 4 5 6 7 8
P9
P857 58 59 60
61 VE = 2
6 6 6
A
B
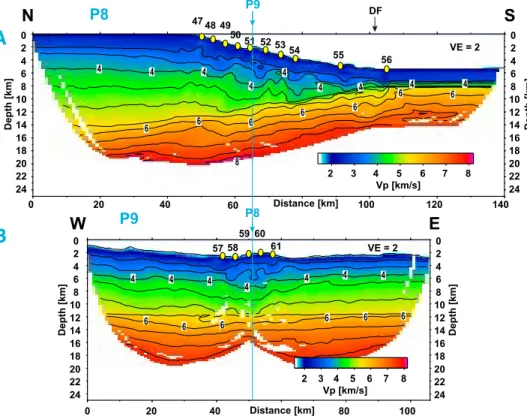
Figure 5. Final velocity models of (A) line P8 and (B) line P9 of wide-angle tomography with Tomo2D using the Monte Carlo approach (Korenaga et al., 2000; Korenaga and Sager, 2012). Yellow numbered dots indicate OBH locations. Isolines indicate seismic P-wave velocity at 0.5 km/s interval (4 km/s and 6 km/s are annotated). Vertical blue line across panels (A) and (B) indicates crossing line of the perpendicular profiles.
0
2
4
6
8
10
12
14
0
2
4
6
8
10
12
14
Depth [km]
23000 24000
25000 26000
27000 28000
29000 30000
31000
CMP location
145 150
155 160
165 170
175 180
185 190
195 Distance [km]
1510 2000 2500 3000 3500 4000 4500 5000 5500 6000 6500 7000 7500Vp [m/s]
CMP location
DF Trench
? R
VE = 2
MGL15
Top oceanic crust Backstop
PI
Graben M a r g i n f r a m e w o r k
Mid-slopefault u
BSFZ
A c c r e t i o n a r y p r i s m 0
2
4
6
8
10
12
14
0
2
4
6
8
10
12
14
Depth [km]
23000 24000
25000 26000
27000 28000
29000 30000
31000
145 150
155 160
165 170
175 180
185 190
195 Distance [km]
DF Trench
R
R R BSFZ
VE = 2
MGL15
Top oceanic crust Backstop
A c c r e t i o n a r y p r i s m
PI
Graben
R - Relief PI - Plate interface DF - Deformation front BSFZ - Backstop splay fault zone M a r g i n f r a m e w o r k
Mid-slopefault u
LVZ LVZ
LVZ LVZ LVZ
~200 m
B A
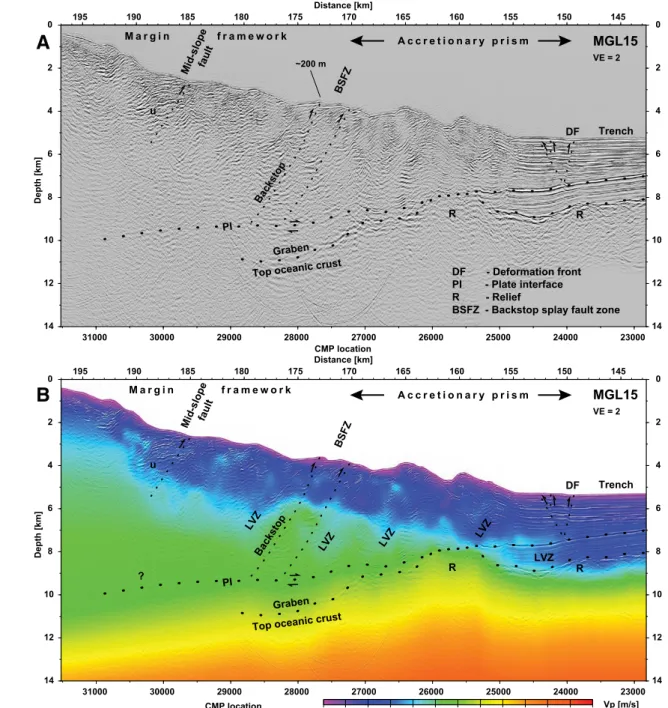
Figure 6. (A) Line MGL15 interpreted pre-stack depth migrated section applying the multichannel seismic (MCS)-traveltime tomography velocities.
(B) Migration velocities on top of inter- preted section. Plate interface and major thrusts are indicted by dotted lines.
CMP—common midpoint; LVZ—low velocity zone; U—major unconformity;
VE—vertical exaggeration. Landward subducting oceanic basement relief is associated with the subducting 56° frac- ture zone.
0
2
4
6
8
10
12
14
0
2
4
6
8
10
12
14
Depth [km]
2000 3000
4000 5000
6000 7000
8000 9000
10000 11000
CMP location
10 15 20 25 30 35 40 45 50 55 60 65 70
Distance [km]
1510 2000 2500 3000 3500 4000 4500 5000 5500 6000 6500 7000 7500 Vp [m/s]
0
2
4
6
8
10
12
14
0
2
4
6
8
10
12
14
Depth [km]
2000 3000
4000 5000
6000 7000
8000 9000
10000 11000
CMP location
10 15 20 25 30 35 40 45 50 55 60 65 70
Distance [km]
117
DF
R R Top oceanic crust
Trench
R
Tilted sediments VE = 2
R - Relief PI - Plate interface DF - Deformation front BSFZ - Backstop splay fault zone
Graben
117
DF
R R Top oceanic crust
Trench
Backstop
R PI
VE = 2
Graben BSFZ
?
Backstop
A c c r e t i o n a r y p r i s m
PI Mid-slopefault
M a r g i n f r a m e w o r k u
R
BSFZ A c c r e t i o n a r y p r i s m Mid-slopefault
M a r g i n f r a m e w o r k u
R
Graben
Graben
LVZ
LVZ LVZ
A
B
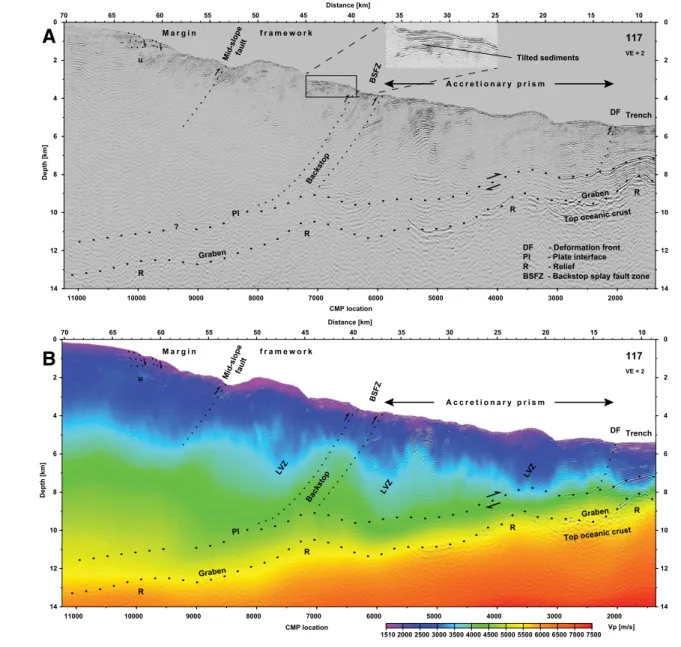
Figure 7. (A) Line 117 interpreted pre- stack depth migrated section applying the multichannel seismic (MCS)-travel- time tomography velocities. Inset shows landward tilted sediment on hanging wall of splay fault. (B) Migration ve- locities on top of interpreted section.
Plate interface and major thrusts are indicated by dotted lines. CMP—com- mon midpoint; LVZ—low velocity zone;
U—major unconformity; VE—vertical exaggeration.
7). High-amplitude reflectivity on the plate inter- face occurs down to the junction with the BSFZ along lines 111 and 106 (Figs. 11C and 11D), and decreased plate interface reflectivity is observed where seamounts form the plate interface (lines
MGL15, 120, Figs. 6 and 11A). Phase reversal of the highly reflective plate interface is locally observed (line MGL15, just seaward of the subducting sea- mount, Fig. 6A). Only the seamounts higher than 3 km, like those of the Kodiak and Bowie Seamount
chain and the Patton and Murray Seamount chain, are resolved in existing bathymetric data covering the subducting Pacific plate (Fig. 1) and disrupt the sediment sequences at the deformation front. But even smaller seamounts, 1.5–3 km high above the oceanic basement and mapped along the north- western MCS lines (e.g., in line 111 seaward of the deformation front, Fig. 11C, and lines 120, Fig. 11A, and MGL15, Fig. 6), impact the upper-plate struc- ture by creating embayments into the deformation front (Fig. 9, Frederik et al., 2020).
Along-strike variability is documented in two trench-parallel lines, 109 and 115 across the BSFZ and accretionary prism, located ~15 km landward of the deformation front and another, line 113, ~15 km farther landward along the middle slope crossing the inner forearc (Fig. 12). Many seamounts sub- duct beneath the lower slope, including smaller ones of ~0.5 km height and ~7 km across, and larger ones up to 2.5 km height and 10 km across. The depth of the oceanic basement varies between 9 and 11 km (lines 109 and 115, Fig. 12B) at ~15 km landward of the trench axis. The plate interface is located at depths of 7–9 km (lines 109 and 115, Fig. 12B). Again, as seen in the downdip direction (Figs. 6, 7, and 11), the plate interface mimics the oceanic basement relief above small subducting seamounts, whereas the large seamounts dis- place the subducting sediment (Fig. 12B). The plate interface reflectivity varies along strike, dividing the Albatross region into sections with high- and low-amplitude plate interface reflectivity. High-am- plitude reflections with local reverse polarity occur in the southwest (SW of line 111, Fig. 12B), except for the region crossing line 106. Low-amplitude chaotic or non-coherent plate interface reflections occur northeast of line 111 (Fig. 12B).
Accretionary Prism, Inner Forearc, and Distinctive Fault Zones
The accretionary prism in the Albatross region displays well-stratified sedimentary layers (Fig. 12B). The middle slope strata are subhorizon- tal northeast of line 111, and large tilted sediment blocks are offset by deep thrust faults in the 0 510152025 50 100 450Earthquake Depth [m]
160˚W 158˚W 156˚W 154˚W 152˚W 150˚W 148˚W 146˚W
150˚W 148˚W 146˚W 54˚N
56˚N 58˚N 60˚N
54˚N 56˚N 58˚N
Alaska 60˚N
Mw 7.92018 Mw 9.21964
Mw 8.21938
segmentPWS
Kodiak segment
Semidi segment
segmentSH
KodiakIsland AB
Patton & Murray S C Aja FZ Kodiak & Bowie S C
63 mm/yr
57 mm/yr
60 mm/yr 58° FZ
56° FZ
Pacific plate
0 100
km
200
Figure 8. Map showing distribution of earthquakes of moment magnitudes Mw ≥ 2.5 since 1964 to January 2020 from the U.S. Geological Survey/National Earthquake Information Center (USGS/NEIC) earthquake catalog. Big red stars mark epicenters of the 2018 Gulf of Alaska complex oceanic crust and 1938 great and 1964 giant Alaska subduction megathrust earthquakes. Dashed circled areas show great and giant subduction rupture areas, rupture segments are annotated, and wide dashed gray line marks division of Prince William Sound and Kodiak segments.
Earthquake depth is indicated by color code (note scale below) and magnitude by size of circles. PWS—Prince William Sound; FZ—fracture zone; SC—Seamount chain; AB—Albatross Bank; SH—Shumagin.
northeastern part of the strike line image (line 113, Fig. 12A). In seismic dip lines, growth of the accretionary prism begins with proto-thrusts sea- ward of the deformation front beneath the trench floor. Most of these proto-thrusts branch off the plate boundary above positive relief in the under- lying oceanic crust (seamounts), as prominently
imaged in line 111 (Fig. 11C). In line MGL15, the oceanward progression of accretionary prism struc- ture advances with emergence of the proto-thrust through the seafloor (Figs. 6 and 9).
The accretionary prism seismic P-wave veloc- ity structure reveals patches of low velocity (LVZ in Figs. 6B and 7B) subparallel to the general
trend of major thrust faults and increased seis- mic P-wave velocities (from 3 to 4.3 km/s) in the BSFZ region. In the ~15–20-km-wide accretionary prism (Figs, 6, 7, and 11), seismic P-wave velocities increase downdip above the subducting seamount in MGL15 (Fig. 6B) compared with lower seismic P-wave velocities above subducting sediment along
153˚20'W
153˚00'W
152˚40'W
152˚20'W
152˚00'W
151˚40'W
151˚20'W
151˚00'W
55˚40'N
56˚00'N
56˚20'N
−6−4−20Depth [km]
Seaward boundary of shelf sediment basins
Mid-slope fault - major thrust within margin framework Deformation front
BSFZ - backstop splay fault zone
Lower slope
Middle slope
Trench embayments
AB
Pacific plate
Glacial channel Vent location V
Transverse lineaments
Shelf embayments
R i d g e V
60 mm/yr
Figure 9. Interpretation of major along-strike structures on bathymetric perspective view of the Albatross region in the southern Kodiak segment of the 1964 earthquake rupture. Upper dotted-dashed lines are an approximation of the downslope extent of the shelf sediment section. Dotted lines outline the backstop splay fault zone (BSFZ), which marks a change in slope and structure in seismic images. A major mid-slope fault scarp is indicated by the dashed line, which is controlled by both seismic images and bathymetry. Glacial channels are shown to distinguish them from subduction-related morphological structures. AB—Albatross Bank.
the plate interface in line 117 (Fig. 7B). However, all P-wave seismic images of subducting seamounts show increased velocities at the leading edge and reduced velocities above and in the trailing flank (Figs. 6B and 7B). The most prominent thrust fault zone verified with bathymetry (Fig. 9) and resid- ual bathymetry (Bassett and Watts, 2015) is along the BSFZ. The BSFZ is a listric splay fault zone (Figs. 6, 7, 11, and A5) that branches from the plate boundary at ~9 km depth. The splay fault zone dips ~60° and displaces the seafloor hundreds of meters, e.g., ~200 m on line MGL15 (Fig. 6). Hang- ing-wall sediment sequences behind the BSFZ (e.g., on line 117, Fig. 7 inset) are tilted, indicating repeated displacement. This set of splay faults forms the ~5–10-km-wide BSFZ transition that separates coherent accretionary prism reflections from a landward zone of more diffuse reflectivity.
The 3.5° average slope angle of the accretionary prism increases at the BSFZ to 6° along the middle slope before decreasing to 2° on the shelf (Fig. A5).
The BSFZ forms a ridge at the transition from the
accretionary prism to the continental slope (Figs. 6 and 11). Some of the BSFZ faults branch upward from the subduction interface relief (i.e., seamounts in lines 111 and 117, Figs. 7 and 11). The small -wavelength seafloor roughness that characterizes bathymetry of the middle slope differs from that of the smoother accretionary prism (Figs. 9 and A5).
Another distinct thrust fault extends across the Albatross region (Fig. 9); the fault cuts through the middle slope and dips ~60°, which we call a mid-slope fault (Figs. 6, 7, 11, and 12). The mid- slope fault offsets the seafloor up to ~350 m and is imaged to ~4 km depth below the seafloor (e.g., line 119, Figs. 11 and A4). Several normal faults dip seaward and cut through the upper slope and shelf of the Albatross region at the seaward end of the shelf sediment and its underlying uncon- formity (lines, 119, 120, 706, Fig. 11). The normal faults are imaged a few hundred meters to ~1 km depth below the seafloor. Normal faults offset the seafloor locally up to ~100 m and the tilted strata indicate block rotation (lines 106/706, 119, Fig. 11).
■ DISCUSSION
The tectonic deformation in the Albatross area is of particular interest because it is the site of a large amount of aftershock activity following the 1964 earthquake (Fig. 8, Ichinose et al., 2007). The extent of the Albatross MCS network enabled the con- struction of 2.5D maps showing plate interface and oceanic basement isodepths (Fig. 13). The subduct- ing plate relief in the context of other geophysical data reveals the interconnection of upper-plate structure with the plate interface and oceanic base- ment relief. Structural characteristics of the 1964 southern Kodiak aftershock region are illustrated in the schematic Figure 14. The following discussion starts with the structure of the incoming plate, its impact on the plate interface properties and on the upper-plate structure, starting at the deformation front and progressing landward across the accre- tionary prism and the middle slope. The role of the BSFZ and the mid-slope fault are discussed, ending with structures along the upper slope and shelf edge. Finally, we speculate on how the pres- ence of significant structural features affects the seismic cycle.
Impact of Incoming Oceanic Basement Relief on Plate Interface Morphology
Seamount subduction significantly affects morphology, structure, and vertical motion in sub- duction zones and also impacts the probability of large earthquakes (e.g., Watts et al., 2010). Whether the subduction of smooth or rough ocean crust is correlated with the size of earthquakes has been argued for decades (e.g., Ruff, 1989; Scholl et al., 2015). The subducting Pacific plate at the Alaska subduction zone is considered a smooth example by various authors from which a smooth megath- rust fault is generally inferred (e.g., Wang and Bilek, 2014; Lallemand et al., 2018). Smooth megathrust faults are thought to be favorable for great and/
or giant earthquakes (e.g., Wang and Bilek, 2014;
Scholl et al., 2015; Lallemand et al., 2018; Geersen, 2019). However, we find that the igneous crust of the subducting Pacific plate is not as smooth as
B S F Z
B S F Z B S F Z
B S F Z N
Embayment
0 km 20
Figure 10. GLORIA backscatter data (U.S. Geological Survey, 2011) of mounds and vents (marked by white arrows) in the backstop splay fault zone (BSFZ) of the Albatross region. Note lineaments that are truncated by the BSFZ.
Bar scales are approximate. Location shown with a red V in Figures 9 and 13.
0
2
4
6
8
10
12
0
2
4
6
8
10
12
Depth [km]
1400 1200
1000 800
600 400
200 CMP location
Distance [km]
120
VE = 2
5 10 15 20 25 30 35 40 45 50 55 60 65 70
DF
R R
Proto-thrust
Graben Graben
PI Top oceanic crust
R - Relief PI - Plate interface DF - Deformation front
BSFZ - Backstop splay fault zone
A c c r e t i o n a r y p r i s m M a r g i n f r a m e w o r k
Mid-slopefault u
BSFZ 0°
15°
15°
A
0
2
4
6
8
10
12
Depth [km]
1400 1200
1000 800
600 400
200 CMP location
Distance [km]
5 10 15 20 25 30 35 40 45 50 55 60 65 70
0
2
4
6
8
10
12 DF
BSFZ
R
Graben R
~350 m
~600 m
119
VE = 2
Proto-thrust
PI
Top oceanic crust A c c r e t i o n a r y p r i s m Mid-slopefault
M a r g i n f r a m e w o r k
u
B
Figure 11. From east to west: (A) Line 120 interpreted pre-stack, depth-migrated multichannel seismic (MCS) section. (B) Line 119 interpreted pre-stack depth migrated MCS section.
(C) Line 111 interpreted pre-stack depth migrated MCS section. Proto-thrusts branch from a buried seamount. Due to the currently subducting graben, sediment thickness here is
~4 km at the deformation front. (D) Line 106/706 interpreted pre-stack, depth-migrated MCS section. Plate interface and major thrusts are indicted by dotted lines. Note normal faults in the upper slope; CMP—common midpoint; U—major unconformity; VE—vertical exaggeration. Landward subducting oceanic basement relief in lines 120 (A) and 119 (B) are as- sociated with the subducting 56° fracture zone. (Continued on following page.)
0
2
4
6
8
10
12 12
0
2
4
6
8
10
Depth [km]
Distance [km]
5 10 15 20 25 30 35 40 45 50 55 60 65
2000
1600 2400
1200 800
200 400 600 1000 CMP location 1800 2200 2600
DF
R
SMT
R Graben
BSFZ
111
VE = 2
Proto-thrust
PI
Top oceanic crust M a r g i n f r a m e w o r k
Mid-slopefault u
BSFZ
A c c r e t i o n a r y p r i s m
C
0
2
4
6
8
10
2
4
6
8
10
Depth [km]
Distance [km]
706
CMP location 40
35
30 45 50 55 60 65
1000 800
600 1000 10
12
0
2
4
6
8
10
12
Depth [km]
1000 800
600 400
200
Distance [km]
5 10 15 20 25 30 35 40 45 50
CMP location R
DF BSFZ
Mid-slopefault
R
106
VE = 2
Graben
A c c r e t i o n a r y p r i s m M a r g i n f r a m e w o r k
u E x t e n s i o n
D
Figure 11 (continued).