RESEARCH ARTICLE
10.1002/2016GC006775
Tectonic structure, evolution, and the nature of oceanic core complexes and their detachment fault zones (13820
0N and 13830
0N, Mid Atlantic Ridge)
J. Escartın1, C. Mevel1 , S. Petersen2, D. Bonnemains3 , M. Cannat1 , M. Andreani4, N. Augustin2 , A. Bezos5, V. Chavagnac6 , Y. Choi3, M. Godard7, K. Haaga8 , C. Hamelin8, B. Ildefonse7 , J. Jamieson2,9 , B. John10 , T. Leleu6, C. J. MacLeod11 , M. Massot-Campos12 , P. Nomikou13 , J. A. Olive14 , M. Paquet3 , C. Rommevaux1 , M. Rothenbeck2, A. Steinfuhrer2, M. Tominaga15 , L. Triebe2, R. Campos16 , N. Gracias16 , and R. Garcia16
1CNRS, Marine Geosciences Group, IPGP, Paris, France,2GEOMAR, Kiel, Germany,3Marine Geosciences Group, IPGP, Paris, France,4Laboratory of Geology, University of Lyon, Lyon, France,5Departement des Sciences de la Terre et de l’Univers, University of Nantes, Nantes, France,6CNRS/GET, University of Toulouse, Toulouse, France,7Geosciences Montpellier, CNRS, University of Montpellier, Montpellier, France,8Department of Earth Science, University of Bergen, Bergen, Norway,
9Earth Sciences Department, Now at Memorial University, Saint John’s, Newfoundland and Labrador, Canada,
10Department of Geology and Geophysics, University of Wyoming, Laramie, Wyoming, USA,11School of Earth and Ocean Sciences, Cardiff University, Cardiff, Wales,12Systems, Robotics & Vision Group, Universitat des Illes Balears, Palma de Majorca, Spain,13Faculty of Geology and Geo-Environment, University of Athens, Athens, Greece,14Lamont Doherty Earth Observatory, Columbia University, Palisades, New York, USA,15Department of Oceanography, Texas A&M University, College Station, Texas, USA,16Computer Vision and Robotics Group, Universitat de Girona, Girona, Spain
Abstract
Microbathymetry data, in situ observations, and sampling along the 138200N and 138200N oceanic core complexes (OCCs) reveal mechanisms of detachment fault denudation at the seafloor, links between tec- tonic extension and mass wasting, and expose the nature of corrugations, ubiquitous at OCCs. In the initial stages of detachment faulting and high-angle fault, scarps show extensive mass wasting that reduces their slope. Flexural rotation further lowers scarp slope, hinders mass wasting, resulting in morphologically complex chaotic terrainbetween the breakaway and the denuded corrugated surface. Extension and drag along the fault plane uplifts a wedge of hangingwall material (apron). The detachment surface emerges along a continuous moat that sheds rocks and covers it with unconsolidated rubble, while local slumping emplaces rubble ridges overlying corrugations. The detachment fault zone is a set of anostomosed slip planes, elongated in the along- extension direction. Slip planes bind fault rock bodies defining the corrugations observed in microbathymetry and sonar. Fault planes with extension-parallel stria are exposed along corrugation flanks, where the rubble cov- er is shed. Detachment fault rocks are primarily basalt fault breccia at 138200N OCC, and gabbro and peridotite at 138300N, demonstrating that brittle strain localization in shallow lithosphere form corrugations, regardless of lithologies in the detachment zone. Finally, faulting and volcanism dismember the 138300N OCC, with wide- spread present and past hydrothermal activity (Semenov fields), while the Irinovskoe hydrothermal field at the 138200N core complex suggests a magmatic source within the footwall. These results confirm the ubiquitous relationship between hydrothermal activity and oceanic detachment formation and evolution.Plain Language Summary
Oceanic detachments are long-lived faults that are exposed at the seafloor, often showing prominent corrugations. Detailed mapping and inset observations and sampling, using remotely operated and autonomous robots, demonstrate as these fault surfaces are exposed at the seafloor, erosion and deposition of debris cover these faults systematically with a thin layer of rubble, demonstrating that their evolu- tions intimately linked to surface processes. Locally, the fault itself is exposed, displaying striated fault planes on the flanks of corrugations. A complex, three-dimensional network of fault planes within the detachment zone defines elongated bodies of rock (corrugations).These detachments also confirm that there is a direct link between detachment formation and hydrothermal activity, as they host both active and inactive hydrothermal fields.1. Introduction
Seafloor spreading involving oceanic detachment faults, recognized as a distinct mode of oceanic accretion [Escartın and Canales, 2010], is inherently asymmetric and widespread both at slow and ultraslow spreading
Key Points:
Oceanic detachment fault corrugations correspond to anastomosing fault slip planes localizing brittle deformation in shallow lithosphere
Mass wasting is associated with detachment denudation and blankets its surface though shedding of material at termination
Faulting, associated with magmatism and hydrothermalis, terminates detachments, and hydrothermalism linked systematically to detachments
Supporting Information:
Supporting Information S1
Table S1
Correspondence to:
J. Escartin, escartin@ipgp.fr
Citation:
Escartın, J., et al. (2017), Tectonic structure, evolution, and the nature of oceanic core complexes and their detachment fault zones (138200N and 138300N, Mid Atlantic Ridge),Geochem.
Geophys. Geosyst.,18, 1451–1482, doi:10.1002/2016GC006775.
Received 20 DEC 2016 Accepted 16 FEB 2017
Accepted article online 23 FEB 2017 Published online 8 APR 2017
VC2017. American Geophysical Union.
All Rights Reserved.
Geochemistry, Geophysics, Geosystems
ridges [e.g.,Cannat et al., 2006;John and Cheadle, 2010;Smith et al., 2006]. It also results in an oceanic litho- sphere that is compositionally and tectonically complex. One of the most striking features of this mode of accretion is the long-term (up to>1 Myr) localization of strain along fault planes exposed at the seafloor as undulating, corrugated surfaces, often associated with elevated massifs [Cann et al., 1997;Tucholke et al., 1998] and referred to as oceanic core complexes (OCCs). These OCCs typically expose all types of eruptive and both plutonic and mantle-derived (ultramafic) rocks that are variably altered and deformed [Dick et al., 2008;Escartın et al., 2003a;MacLeod et al., 2002], suggesting a complex history of deformation and associat- ed fluid circulation along the fault zone. The link between deformation and hydrothermal activity is further confirmed by a robust association along the Mid-Atlantic Ridge (MAR) of oceanic detachment faults with both seismicity and hydrothermal activity [Escartın et al., 2008]. To date, all the OCCs that have been explored along the Mid-Atlantic Ridge (MAR) are known to host active hydrothermal vents, show extinct hydrothermal deposits, or both (e.g., Logatchev, TAG, Semenov, Lost City, Rainbow, Ashadze, and Von Damm) [Andreani et al., 2014;Connelly et al., 2012;Fr€uh-Green et al., 2003;German et al., 2010;Ondreas et al., 2012;Pertsev et al., 2012;Petersen et al., 2009;Tivey et al., 2003].
To understand the development of oceanic detachment faults and OCCs, and to ultimately constrain the interactions between crustal accretion and large-slip, long-term detachment faulting, in situ observations of these structures are critical. The detachment systems at Atlantis Massif and south of the Kane transform along the MAR are among the best studied of such structures, as both have been extensively explored and sampled using deep-sea vehicles [Blackman et al., 2001;Dick et al., 2008;Karson et al., 2006;Tucholke et al., 2013] and by drilling in the case of Atlantis Massif [Blackman and Collins, 2010;Fr€uh-Green et al., 2016;Ildefonse et al., 2007]. In situ observations and samples have also been acquired at other detach- ments elsewhere along the MAR (e.g., TAG, Logatchev, 158450N at MAR), as well as along other mid-ocean ridges (e.g., Mt Dent on the mid-Cayman Rise, Fuji Dome, and Atlantis Bank along the southwest Indian Ridge, and Godzilla along a back-arc ridge), but they are less well studied. However, the Kane area hosts several fossil detachment systems, and Atlantis Massif is likely inactive, with a major rift valley bounding fault dissecting its corrugated surface, as suggested also by microseismicity in the area [Collins et al., 2012].
In this paper, we present results from a recent cruise to the 138200N and 138300N OCCs on the MAR (Figure 1). Previous studies of this area have provided data on the morphology and seafloor characteristics [MacLeod et al., 2009;Smith et al., 2008, 2006], as well as the patterns of seismicity [Escartın et al., 2003b;
Olive and Escartın, 2016;Smith et al., 2003], suggesting that both detachments are likely active at the present time or have been until very recently. Here we present detailed microbathymetric data acquired by an autonomous underwater vehicle (AUV), as well as detailed geologic observations and sampling conducted during remotely operated vehicle (ROV) dives. These novel observations enable direct comparisons between two adjacent OCCs, and shed new light on (a) processes operating at oceanic detachments (e.g., deformation, exhumation, fluid flow, relationship to magmatism, and hydrothermal activity), (b) structure and composition of the underlying lithosphere throughout the area, and (c) the internal structure, composi- tion, and origin of the corrugated slip surface commonly observed on detachment footwalls. In situ sam- pling also enables comparisons with prior results of dredging campaigns, and to reevaluate aspects of previous geological interpretations of these tectonically and lithologically complex areas that characterize slow and ultraslow spreading segments.
2. Geological Setting and Prior Work
The 138200N and 138300N OCCs have developed on the western flank of the MAR axial rift valley, where they root. These detachments, first identified during shipboard geophysical surveys [Smith et al., 2006], formed along a ridge section (between128550N and 138450N) that is characterized by reduced melt supply to the ridge axis, as suggested by gravity data. This ridge section has produced over the past10 Myr a corridor of oceanic crust punctuated by numerous oceanic detachment faults and associated OCCs [Smith et al., 2008, 2006]. The corrugated 138200N and 138300N OCCs, which extend7 and12 km along axis, respec- tively, span5.5 and8 km in the spreading direction, and may record extension localized along the fault for0.5 and 0.7 Myr, assuming symmetric spreading at a half-rate of 12 km/Myr. Near-bottom sonar imag- ery and its tectonic interpretation [MacLeod et al., 2009;Mallows and Searle, 2012] suggested that the
Geochemistry, Geophysics, Geosystems
10.1002/2016GC006775138200N detachment, displaying a pristine morphology, may still be active, whereas the 138300N detach- ment may be inactive owing to the recent propagation of adjacent volcanic ridges to the north, and conse- quent termination of the detachment fault.
Dredge, TV-grab sampling, and seafloor rock drilling at these detachments faults yielded a wide range in rock types, consistent with the exposure of deep-seated rocks (gabbro and peridotite), in addition to basalt/
diabase, and including fault rocks [MacLeod et al., 2009; Pertsev et al., 2009]. The geochemistry of basalts recovered has been also interpreted as an indicator of a change in magmatic activity from a period of low supply of magma to the ridge axis at the initiation of detachment faulting, to more robust axial melt supply at the present time [Wilson et al., 2013].
Early surveys carried out during Russian cruises located and defined several extinct hydrothermal fields throughout the 138300N detachment using a deep-towed self-potential system, in addition to TV-camera surveys and sampling [Bortnikov et al., 2015;Cherkashev et al., 2013;Cherkashov et al., 2016, 2010b;Pertsev et al., 2012]. These data and results clearly demonstrate that hydrothermal activity has been present in space and time throughout the exposed fault surface, from its termination near the ridge axis to the limit of the corrugated surface to the west. In addition to inactive hydrothermal fields, an active hydrothermal field (Semenov-2) was observed [Beltenev et al., 2007;Cherkashov et al., 2010b;Pertsev et al., 2012]. Hydro- thermal deposits, which yield ages of up100 kyr, show no apparent progression with age (e.g., in the
45˚06'W 45˚00'W 44˚54'W 44˚48'W
13˚15'N 13˚20'N 13˚25'N 13˚30'N 13˚35'N
3.5 3.0 2.5 2.0
4.5 4.0
D epth, km
13°30’N OCC
13°20’N OCC
Neovolcanic zone ROV tracks
Fig. 2b
Fig. 2a
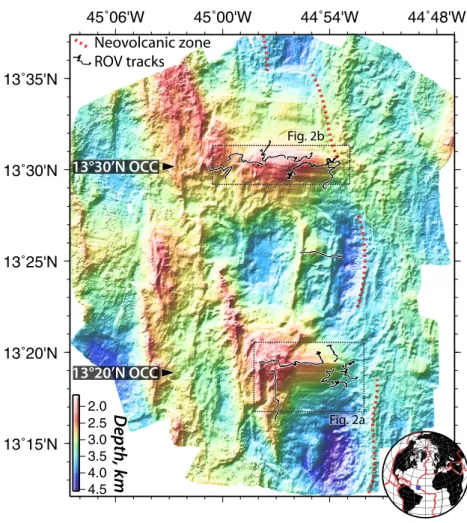
Figure 1.Shipboard bathymetry (gridded at 40 m) showing the 138200N and 138300N oceanic core complexes (OCCs), and the ROV VIC- TOR6000 tracks conducted during the ODEMAR cruise. Segments of the neovolcanic zone (red dashed lines) are located along the center of acoustically reflective volcanic seafloor at the rift valley floor [MacLeod et al., 2009], and confirmed by the magnetic data [Mallows and Searle, 2012]. Boxes correspond to AUV microbathymetry maps and sampling shown in Figure 2.
direction of spreading), as older deposits are found near the axis, while the active site is>5 km off axis [Cherkashov et al., 2010a].
3. Data and Methods
The ODEMAR cruise, which took place in November to December 2013 onboard N/O Pourquoi Pas?
(IFREMER, France), studied the 138200N and 138300N oceanic detachment faults along the MAR (Figure 1).
During the cruise, we deployed the autonomous underwater vehicle AUV Abyss (GEOMAR, Germany) to obtain microbathymetry over both detachment systems (Figure 2), in addition to water column data (neph- elometry and Eh). AUV microbathymetry data were processed onboard and the resulting microbathymetric grids used to plan dives with the ROV Victor6000 (IFREMER, France), for geologic observations and sampling (Figures 1 and 2). A full cruise report is available online (www.sismer.fr).
3.1. Shipboard and AUV Multibeam Bathymetry
Multibeam bathymetry data were acquired using a 12 kHz SeaBat 7150 system onboard N/O Pourquoi Pas?, and processed at a resolution of 40 m/pixel (Figure 1), improved on the existing80–100 m/pixel resolution available from prior cruises [MacLeod et al., 2009;Mallows and Searle, 2012;Smith et al., 2006].
Near-bottom bathymetry data were acquired with a 200 kHz RESON7125 multibeam during 8 AUV Abyss dives at an average altitude of70 m above seafloor. The combined AUV surveys cover76 km2of sea- floor. The AUV multibeam bathymetry data were first renavigated using the MBNAVADJUST routine (MB- System), and the data edited in QPS QINSYVR to obtain an initial grid for each AUV dive. The processed data were then used to generate a single combined grid for each OCC, at a resolution of2 m per pixel (Figure 2).
Shipboard bathymetry data is publicly available through the Sea Scientific Open Data site (SEANOE, www.sea- noe.org), and AUV microbathymetry is available upon request, and will be made publicly available in late 2017 through this same website.
3.2. ROV Sampling, Observations, and Image Surveys
We conducted 21 ROV dives (Figure 1) mostly based on targets identified in the AUV microbathymetry, which provided>210 h of video imagery along a total of100 km of dive tracks. From these dives, we recovered 422 samples, of which 172 were unequivocally in situ, based on onboard dive descriptions and observations, and a postcruise review of video imagery. Of these in situ samples, 52 were reoriented onboard correlating the ROVs’ video imagery of sampling sites with the samples themselves, in addition to the ROV navigation and orientation information (position, heading, pan and tilt of the camera). We estimate an orientation error of less than208.
All samples were cut and curated onboard, taking into account their orientation when available. Onboard sample descriptions were reviewed postcruise based on thin section observations, to report composition, alteration, deformation, texture, etc. Sample locations together with a lithologic summary (see below) are reported in supporting information Table S1.
We conducted systematic video surveys of selected outcrops of geological interest encountered during our VICTOR6000 dives. Video surveys fully imaged areas of interest (e.g., fault outcrops, see below) with crosscutting horizontal and vertical tracks. Video imagery was processed to generate both videomosaics and three-dimensional terrain models with a resolution of<20 cm, better than that from acoustic map- ping systems. Techniques of image processing, mosaicing, and video-based terrain modeling are described elsewhere [Nicosevici and Garcia, 2013]. All ROV video imagery is available online (video.ifremer.fr).
3.3. Dredging
We conducted a total of 14 dredges, which yielded more than 2.5 Tn rocks. Dredge samples were initially examined on board, and classified based on rock type, structure, and alteration history. A representative set of samples of each rock type and from each dredge was cut and described in detail onboard. Descriptions and rock types were subsequently refined postcruise. A summary of rock types (see below), in addition to relevant dredge information, is given in supporting information Table S2. Both ROV and rock samples are archived and stored at IPGP, and available upon request.
Geochemistry, Geophysics, Geosystems
10.1002/2016GC0067753.4. Lithological Description
Rock types from both ROV sampling and dredging (reported in supporting information Tables S1 and S2, respectively) are plotted in the maps (Figure 2), and correspond to simplified sample descriptions. In this paper,
45˚00'W 44˚58'W 44˚56'W 44˚54'W
13˚30'N 13˚31'N
13˚30'N 13˚31'N
13˚18'N 13˚20'N
44˚58'W 44˚56'W 44˚54'W
13˚18'N 13˚20'N
Peridotite Gabbro Basalt
DredgeNot in situIn situ
Hydrothermal
4.0 3.5 3.0 2.5
2.0 Depth, km
A)
B)
C)
D)
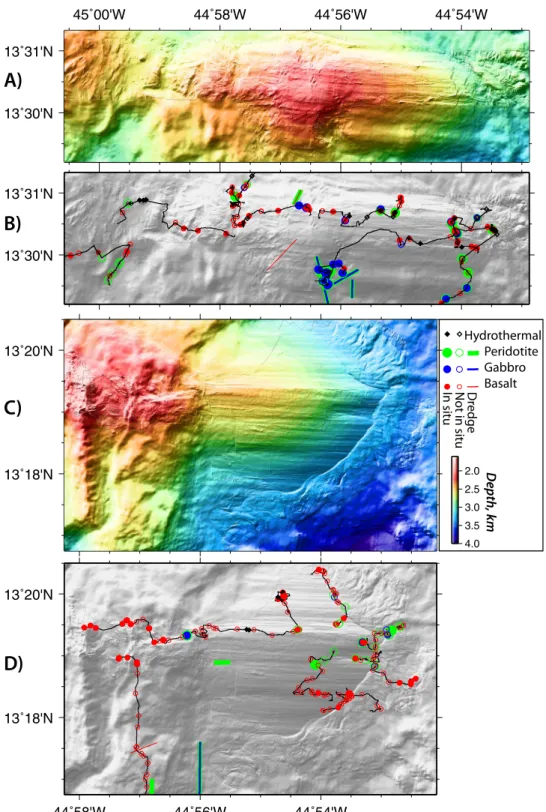
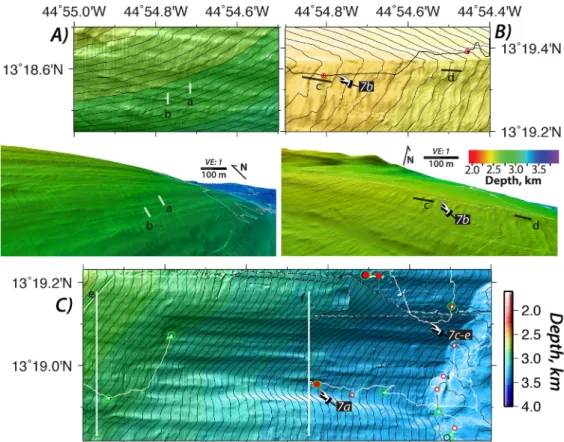
Figure 2.AUV microbathymetry (merged with shipboard bathymetry) and primary rock types of samples recovered during ODEMAR ROV dives (black thin lines) and dredges (colored lines of different thickness). (A) Microbathymetry of the 138300N OCC. (B) Shaded relief of the 138300N OCC and primary lithologies sampled. (C) Microbathymetry of the 138200N OCC. (D) Shaded relief of the 138200N OCC and primary rock types sampled. Locations of the two microbathymetric maps are shown in Figure 1. The limit of the AUV surveys is visible at the transition from the smooth shipboard bathymetry (40340 m pixels) and the AUV bathymetry (232 m pixels).
we focus on the primary lithology, as well as on the most important alteration and deformation characteristics, to understand the composition and architecture of the oceanic lithosphere. The distribution of rock types at each OCC and for each terrain described in section 4 below is also shown in supporting information Figure S2.
We have classified the samples into four primary rock types, which are briefly described below:basalt, gabbro, peridotite, and hydrothermal deposits. Some of these rocks are variably deformed and altered (including fault breccias, ultramafic-derived schists, etc.). A detailed study of deformation processes, condi- tions, and fluid-rock interactions within the detachment fault zone are beyond the scope of this paper and will be presented in a follow-up study (Bonnemains, et al., Pervasive silicification and hangingwall overplat- ing along the 138200N oceanic detachment fault (Mid-Atlantic Ridge), submitted toG-cubed, 2017). Finally, the tables also report samples of unknown primary lithology (e.g., unconsolidated clay fault gouges), in addition to specific comments and observations regarding the nature of deformation and deformation con- ditions, alteration, volcanic features, among others.
Basalt. This rock type encompasses all extrusive and dike rocks as deciphering them is often not possible.
The Comments column in supporting information Table S1 reports obvious pillow, sheet flow, and dike structures, either from the sample itself, or from outcrop observations at the sampling site. Basalts may have been brecciated or/and recrystallized; some of these breccias are of tectonic origin and associated with the detachment fault, whereas others have a sedimentary or volcanoclastic origin.
Many samples from the 138200N OCC have undergone greenschist facies alteration (chlorite, actinolite, albite, titanite, quartz). In some cases, pillow textures (variolitic rims) are still obvious. Brecciation is generally inferred to result from brittle deformation, although some fine-grained breccias involving pillow fragments and glassy shards can be interpreted as hyaloclastites. The greenschist facies alteration is indicated in the comments within supporting information Table S1.
Gabbro. This category covers all the plutonic rocks, from gabbro in a strict sense to felsic differentiates. Stat- ic hydrothermal recrystallization is ubiquitous, but with variable intensity (e.g., amphibole after pyroxenes and secondary plagioclase). In a few cases, felsic differentiates infiltrate mafic rocks. Some samples have undergone cataclastic deformation resulting in the transition from highly fractured gabbros with little dis- placement to cataclastic breccias. Ductile deformation may result in schistose rocks, namely amphibolite or chlorite schists. Given the context in which they occur, and in particular the field association with mafic and ultramafic rocks, we infer that most schists derive from gabbroic rocks, although some may derive from a basaltic protolith. In some cases, brecciated textures can still be identified. There is limited evidence for high-temperature crystal-plastic ductile deformation of the primary igneous assemblage of the gabbros, a deformation that is commonly observed at other oceanic core complexes such as Atlantis Bank or Kane [Cannat et al., 1991;Dick et al., 2010;Hansen et al., 2013;Miranda and John, 2010;Schroeder et al., 2007].
Peridotite. All peridotites are largely or totally serpentinized. Most rocks show serpentinization textures that indicate static conditions of hydration (e.g., mesh textures). Interaction between peridotite and magma is also recorded in samples infiltrated by gabbroic melts or crosscut by basaltic dikes. Some samples showing ductile deformation of secondary phases result in both talc and serpentinite schists. Samples diplaying alter- nating bands of both amphibolite/chlorite schists and serpentine/talc schists are interpreted as sheared gabbro/peridotite contacts.
Hydrothermal. This category covers all deposits related to both active and inactive hydrothermal discharge at the seafloor. Hydrothermal samples correspond primarily to massive sulfides from hydrothermal chim- neys and mounds, and to iron hydroxides.
Other. Other rock types, such as manganese crusts and calcareous sediments that are variably lithified, are reported under a broad category named ‘‘Other’’ in the supporting information Table S1.
4. Tectonic Structure, Geological Observations, and Rock Types
We differentiate three distinct structural domains at both the 138200N and 138300N detachments (Figure 3), based upon microbathymetry and seafloor observations conducted during the ODEMAR cruise (Figure 1), combined with previous data collected in this area and elsewhere. Below we describe these structural domains from off axis (west) toward the ridge axis (east), with the naming used hereon in italics:
Geochemistry, Geophysics, Geosystems
10.1002/2016GC0067751. Thechaotic terrain, i.e., the area between thefootwall cutoffof the fault, often referred to as breakaway, and the limit of thecorrugated surfaceaway from the axis (Figures 3–5);
2. The corrugated surface, i.e., the surface showing microbathymetric corrugations that are parallel to spreading (Figures 3 and 629);
3. Thehangingwall cutoff, where thecorrugated surfaceemerges from the rift valley floor, and including the adjacent seafloor that lies between the hangingwall cutoff and the volcanic rift valley floor, referred to as apronfrom here on (Figures 3, 10 and 11).
As the 138200N OCC is structurally intact, we describe it in detail and then compare it with 138300N OCC, which is being dismembered and appears to be in the process of being terminated (Figures 3B and 3D), if not already inactive [MacLeod et al., 2009]. Beyond the domal OCCs themselves, we describe two additional areas, i.e., theaxial valley floorwith recent volcanic deposits, and the e)inter-OCC seafloor, which corre- sponds to the faulted off-axis crust between the two OCCs (Figure 12). Figure 3 shows three-dimensional
Chaotic terrain
Corrugated surface
Apron (Breakaway)
(Termination)
Seamount Fault striations
5.
3 30.25.20.
Depth, km
N
1 km
1 km
A) 13°20’ OCC (view from SSE)
B) 13°30’ OCC (view from NNE)
Corrugated surface
Rift valley Fault
scarps
Mass wasting Mass wasting
Fault scarps (Termination)
Chaotic terrain
Fault striations
Semenov-2 HF (active) Irinovskoe HF
(active)
N Old volcanic
Ridge axis
13°30’N OCC
13°20’N OCC
Corrugated surface
Apron
Chaotic terrain
Rift valley 2000 m bsl
2000 m bsl
Termination
Breakaway
200 m 2 km
VE: 2
2200 2600 3000 3400
13°30’N OCC
13°20’N OCC
Depth, m 2 km
VE: 2 1 km
VE: 1
Depth, km 2.0 2.5 3.0 3.5 C) 13°20’ OCC(view from ESE)
1 km VE: 1
2.1 2.4 2.7 3.0
Depth, km D) 13°30’ OCC(view from ENE) N
N
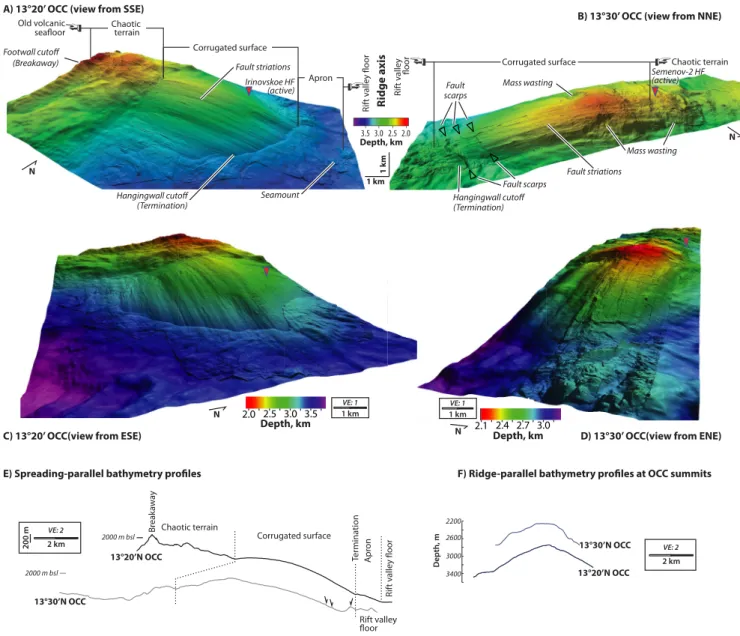
Figure 3.Three-dimensional views of (A) the 138200N OCC microbathymetry (Figures 2C and 2D), viewed from the SSE, and (B) the 138300N OCC (Figures 2A and 2B) viewed from the NNE, showing the different structural domains together with other morphologic features (all discussed in the text). Additional views from the ridge axis of both the (C) 138200N OCC and the (D) 138300N OCC are also shown. Active hydrothermal fields (HF) are indicated in the four panels (upside-down triangles, filled red). (E) Bathymetric profiles parallel to the spreading direction along the center of both detachments. Location and limits of the different terrains identified are shown. The profiles have been aligned at their terminations, and vertically offset for clarity. The 2000 m depth is indicated as a horizontal bar for each profile. (F) Bathymetric profiles parallel to the ridge axis and across the summit of both OCCs’corrugated surface. The along-axis profiles are shown with no offset in depth. Profiles in both Figures 3E and 3F are shown with a vertical exaggeration (VE) of 2.
views of both detachments with the different structural domains and other morphological features indicat- ed (faults, mass wasting structures, hydrothermal fields, etc.).
The chaotic terrain, the corrugated surface, and the axial valley floor are present both at 138200N and 138300N, while theapronis only observed at the active, well-preserved 138200N OCC. This terrain is likely masked by late faulting and mass wasting at the 138300N OCC (see section 6 and Figure 3). The description of theinter-OCC seafloorbelow is based on the shipboard bathymetry (Figure 1) and ROV observations and sampling solely, as we did not conduct a microbathymetric AUV survey here.
4.1. Footwall Cutoff and Chaotic Terrain
Oceanic detachment faults in the 138N area (Figure 1) develop ridgeward from prominent linear ridges that extend15–20 km along axis, slightly oblique to the ridge trend [Mallows and Searle, 2012;Smith et al., 2006]. Their outer boundaries, which structurally limit the oceanic detachments away from the ridge axis, are commonly referred to as the breakaway [MacLeod et al., 2009;Tucholke et al., 1998] and correspond directly to thefootwall cutoff.
The chaotic terrain extends between the ridgeward edge of the linear ridge and the initiation of the corrugated surface(Figure 4). Thechaotic terrainat the 138200N OCC has a width of3.5 km at the center of the OCC (Figure 4B), with the microbathymetric data indicating an overall ridgeward slope of88; at the breakaway itself the slopes are of308–358toward the ridge axis and158–208away from it (Figure 3E).
These slope angles are consistent with those reported earlier from profiler data acquired during sonar sur- veys to estimate the fault angle prior to rotation [MacLeod et al., 2009]. In contrast, at the 138300N OCC the breakaway is not fully imaged by the microbathymetry data, but it extends over a longer distance along spreading (>5.2 km, Figures 123 and 4A). There thechaotic terraindoes not show a progressive slope from the breakaway toward the ridge, and displays instead a relative low at its center.
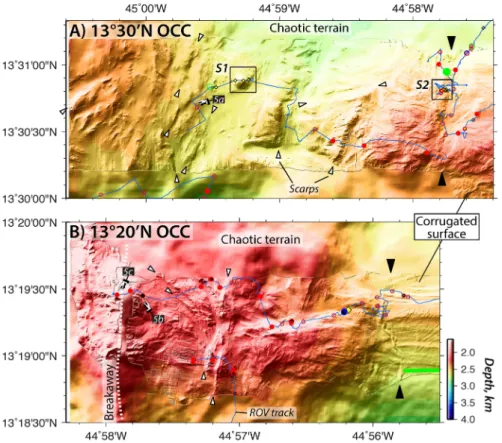
Figure 4.Detailed microbathymetry overchaotic terrainat the (A) 138300N OCC and (B) 138200N OCC. Rock types correspond to the legend in Figure 2. Maps show ROV tracks (blue lines), the limit between the chaotic terrain and thecorrugated surface(large black triangles), scarps within thechaotic terrain(small white triangles), the position of the breakaway (dashed white line) at the 138200N OCC in Figure 4B.
Squares labeled S1 and S2 in Figure 4A indicate the locations of the inactive Semenov-1 and the active Semenov-2 hydrothermal fields.
Labels in a black box (5a–5c) refer to the location of seafloor images in Figure 5.
Geochemistry, Geophysics, Geosystems
10.1002/2016GC006775Thechaotic terrainassociated with both OCCs are morphologically complex. Most of the topographic slopes are gentle (<208) and define short scarps, extending laterally from a few hundreds of m to a maximum of a few km, with no clear regional pattern. At 138200N, we observe greater scarp heights that face away from the ridge axis, often curved in plan view (Figure 4B). Geological observations during ROV dives confirms the com- plex nature of these domains, showing banks of talus with angular basaltic blocks, heavily sedimented areas with floating blocks, trails of angular blocks, and rubble-covered slopes (Figure 5A). While sonar data showed
Figure 5.ROV video captures from chaotic terrain seafloor. (A) Rubble and sediment along slope facing away from the ridge axis (field of view15 m across, dive 446, 138300N OCC). (B) View of the ridgeward scarp of the breakaway, showing rubble surrounding a fault surface that dips toward the axis (field of view15 m, dive 555, 138200N OCC). (C) In situ pillow lavas on sedimented seafloor at the summit of the breakaway and that slopes westward and away from the ridge axis (field of view10 m, dive 555, 138200N OCC). The location of images along corresponding ROV tracks is shown in Figure 4.
Figure 6.Microbathymetry of the 138200N OCC corrugated surface. (A) Detail of detachment fault corrugations in map view (top) and oblique view from the west-southwest (no verti- cal exaggeration). (B) Rubble ripples overimposed on the corrugations with perpendicular to highly oblique orientations with respect to extension direction, in map view (top) and oblique view from the south-southwest (no vertical exaggeration). ROV tracks correspond to black lines in maps and white lines in 3-D views. (C) Corrugated surface and its termina- tion on the southern flank of the OCC. The morphology shows a depression, elongated in the extension direction, exposing deeper structural levels of the detachment fault zone, and where corrugations are ubiquitous. All maps show 10 m contours. The bathymetric profiles, indicated by letters and lines in Figures 6A–6C correspond to (D) individual corruga- tions (along lines a and b), (E) the ripples overlying the corrugated surface (along lines c and d), and (F) profiles across the corrugations and the structural low (lines e and f), showing the thickness of the fault zone missing in the area shown in Figure 6C. The shaded areas in Figures 6D and 6E indicate the relief of corrugations and ridges relative to regional slope along profiles. The location of images in Figure 7 is also indicated, as well as ROV tracks and recovered rock types (see legend in Figure 2). Black labels correspond to seafloor images in Figure 7.
Geochemistry, Geophysics, Geosystems
10.1002/2016GC006775structures in this terrain that were interpreted as corrugations [MacLeod et al., 2009], we could not identify any morphological features confirming the presence of these corrugations. On both detachments, isolated rock outcrops are primarily basaltic, locally showing in situ pillow lavas at outcrop scale, sometimes interlocking.
These outcrops lack lateral continuity at scales greater than 50–100 m, and pillows in some cases appear to be steeply dipping. Gabbro and peridotite samples that are in situ and within the fault zone are scarce, with a single occurrence of sheared peridotite at each of the detachments, in addition to one gabbro and one peri- dotite sample at the 138200N detachment (see supporting information Table S1 and Figure 4).
ROV observations at the summit of the 138200Nfootwall cutoffridge (breakaway, Figure 4B) show that the ridge-facing scarp is steep, showing areas with rubble, sediment, and locally steep, flat fault surfaces (Figure 5B). The ridge edge shows an abrupt transition to the slope dipping away from the ridge axis at308, where the sedimented seafloor shows pillow lavas that are in situ in sedimented seafloor. These pillow lavas do not show downslope elongation, suggesting eruption on subhorizontal seafloor. These ROV observations are consistent with the microbathymetry data (Figure 4B), which shows a sharp contrast between the mass- wasted ridge-ward slope of the breakaway, showing gullies and debris chutes, and the outward-facing slope. The westward slope displays instead a hummocky terrain consistent with volcanic seafloor [Smith and Cann, 1990;Yeo et al., 2011], that is also recognizable in the previously acquired near-bottom sonar imagery [MacLeod et al., 2009].
Geologic observations from ROV dives and sampling along thechaotic terrainassociated with the 138300N OCC confirms the presence of hydrothermal deposits (supporting information Table S1), associated with the hydrothermal fields Semenov-1 and Semenov-2 (S1 and S2 in Figure 4A) identified in earlier surveys of
Rubble
Rubble + sediment Striated fault plane
~10 m Dolerite fault breccia
View in C)
A)
B) C)
D)
E)
Figure 7.Seafloor images of the 138200N corrugated surface. (A) Extension-parallel view (toward the W) of the flank of a corrugation (see location in Figure 6), covered with rubble, and sedimented seafloor at its base (dive 550, field of view10 m in foreground). (B) Extension- parallel view (toward the W) of the ridgeward face of a ‘‘ripple’’ ridge crosscutting the corrugation (dive 557, field of view15 m in fore- ground). (C) View of a striated fault plane at the flank of a corrugation (oblique view to striations, see scale and image position in videomo- saic in Figure 7E). Striations are subhorizontal and extension-parallel. The fault plane is covered by rubble above, and sediment and rubble at its base. View toward the SSE and see Figure 7E for scale (dive 547). (D) Videomosaic of the40 m long striated fault plane in Figure 7C, and (E) the corresponding geologic interpretation (E or ridge axis to the left). Striations are shown in red, fractures at the fault outcrop in blue, and limits of fault surfaces in dashed yellow. The location of a fault breccia sample (diabase) is also indicated.
the area [Beltenev et al., 2009;Pertsev et al., 2012]. Our microbathymetry shows that the inactive Semenov-1 hydrothermal mound is 60 m high with a basal diameter of 200 m, and that is situated in an area of flat and smooth seafloor within thechaotic terrain. The active Semenov-2 field is located along a ridge-parallel fault scarp bounding a local depression (see Figure 4A); the detailed description of these hydrothermal sites is presented in section 5 below. In contrast, thechaotic terrainat the 138200N detachment does not show any evidence of past nor present hydrothermal activity.
4.2. Corrugated Surfaces
Both OCCs display a curved fault surface at the seafloor, with what we refer to in this paper as corruga- tions. These corrugations are observed over a wide range of spatial scales, from broad ones that have widths of100 m and amplitudes of tens of m, and that are characteristic of OCCs as they are widely recognized in multibeam shipboard data, to finer-scale corrugations revealed only by the microbathy- metric data (Figure 2), that can extend more than1 km in the extension direction, and have much smaller amplitudes (a few m). These finer-scale corrugations undoubtedly correspond to the lineaments observed in the sidescan sonar data from OCCs in this same area [MacLeod et al., 2009; Mallows and Searle, 2012;Smith et al., 2006], and elsewhere [Cann et al., 1997;Searle et al., 2003], as they have compa- rable amplitude and wavelengths, and dimensions parallel to plate spreading. In this paper, we refer to as striations the linear features that are visually identifiable along individual fault slip planes both at out- crop and sample scales. The corrugated surfaces on both OCCs share some broad morphological charac- teristics, including doming both along and across axis, the geometry (width, height length) of individual
44˚54.4'W 44˚54.0'W 44˚53.6'W 44˚53.2'W
13˚30.4'N 13˚30.8'N
44˚56.4'W 44˚56.0'W 13˚29.6'N
13˚30.0'N
44˚55.2'W 44˚55.0'W
13˚30.2'N 13˚30.4'N
4.0 3.5 3.0 2.5
2.0
D epth, km
faults
s s s
Corrugations
Termination
cs cs cs
cs cs
cs
Scarp head ssures 9b
9c
9d
A)
B) C)
a V
Figure 8.(A) Eastern portion of the corrugated surface associated with the 138300N OCC; note crosscutting faults facing both toward and away from the present-day ridge axis (indicated by white triangles), and a portion of the corrugated surface tectonically dissected (cs).
Corrugations (red arrows) are continuous across faults, that define a graben where fresh lavas and a recent volcanic construction are observed (V, dashed red contour). The rift valley floor hosts recent, unfaulted seamounts (s), some with clear craters, and the possible remains of theapron(a) between the volcanic rift valley floor and the termination (see section 4.3). ROV tracks and recovered rock types (see legend in Figure 2) are also indicated. (B) Mass wasting scar on the southern flank of the OCC dissecting the detachment fault. (C) Summit of the 138300N corrugated surface showing late fissures (indicated with white-filled triangles). Note straight artifacts in the microbathymetry trending north-south. Black labels correspond to position of seafloor images in Figure 9.
Geochemistry, Geophysics, Geosystems
10.1002/2016GC006775corrugations. Our geologic observations and sampling, however, reveal major differences in fault zone composition between these two detachments.
4.2.1. 138200N OCC Corrugated Surface
Thecorrugated surfaceof the southern detachment is curved parallel to the spreading direction, emerging at the rift valley floor at an angle of148–188, flattening at its summit, and tilted away from the axis by58 (Figure 3E). The trace of the hangingwall cutoff, where the corrugated fault surface emerges from the sea- floor, is curved and reflects the three-dimensional geometry of the corrugated fault (Figures 2C, 3A, and 3C). Off axis the transition with thechaotic terrainis abrupt, and marked by an undulating and discontinu- ous ridge that is subparallel to the present-day ridge axis, that has a relief from a few m and up to10 m (Figure 4B). Seven ROV dives over this corrugated surface provide extensive geological observations and sampling (Figure 2D).
Detachment fault surface corrugations observed in the microbathymetry correspond both to ridges and breaks in the local slope that are subparallel to the extension direction (Figure 6A). These are spaced100–
1000 m apart laterally, extending from a few hundreds of meters to2 km in the extension direction. Corru- gations have vertical reliefs typically in the range of a few m relative to local relief (Figure 6D) to a maximum of10 m for the most prominent ones (Figure 6B). Close examination of the microbathymetry also shows a series of superimposed, fine-scale ridges oriented from roughly normal to oblique to the corrugations long axis (extension direction, Figure 6B). Vertical relief of these structures crosscutting the corrugations is typi- cally from1 m up to5 m, and are spaced parallel to the extension direction at a few tens of meters.
A) B)
C)
D)
~1 m
FT
R
DFZ R+H
R
F S
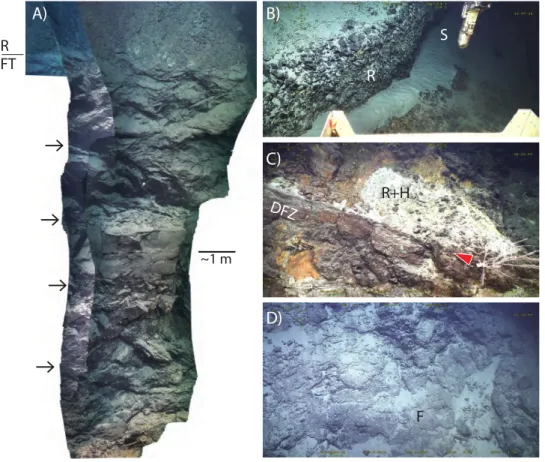
Figure 9.(A) Videomosaic of a10 m high vertical section through the detachment fault zone exposed by a ridge-facing normal fault crosscutting the 138300N detachment fault (dive 558). The detachment fault zone shows numerous zones of localized deformation (arrows), with the upper surface of the fault zone clearly identified (FT), overlain by unconsolidated sediment and rubble (R). (B) Late fissure, trendingN–S, dissecting the rubble layer (R) and the underlying detachment, and with sediment (S) infill (dive 544, field of view 10 m horizontally). (C) Detachment fault zone (DFZ), exposed along the scarp of a fault facing away from the ridge, with its upper surface (red arrow) overlain by rubble. Hydrothermal staining and deposits are observed throughout both in the rubble layer (R1H) and through the detachment fault zone (dive 558, field of view10 m horizontally). (D) Fault plane within the detachment fault (steeply dipping toward the ESE, indicated by the label F) exposed along the mass-wasting scarp dissecting the 138300N detachment fault zone (dive 651, field of view15 m horizontally). Locations of images are shown in Figures 8A and B.
They tend to display steeper slopes ridgeward, with an their overall shape that is reminiscent of ripples (Fig- ure 6B).
The 138200N detachment surface is structurally continuous and regular (Figure 2C), except for an area imme- diately south of the eastern tip at the termination (Figure 6C). At this location, we observe a bathymetric low relative to the surrounding detachment fault surface, extending1400 m and up to 500 m in the
Figure 10.Termination of the corrugated surface andapronat both (A) the northern and (B) southern flanks of the 138200N OCC. Contact of theapronand the volcanic seafloor is also shown in Figure 10B. Contours in Figures 10A and 10B are every 10 m. (C) Oblique view of the moat shown in Figure 10B, with (left) thecorrugated surfaceto the west and (right) theapronto the east, and the volcanic seafloor and seamounts at the rift valley floor in the background (top right). (D) Extension-parallel profiles across the termination,apron, and the adjacent volcanic sea- floor. Gray box corresponds to the inset showing the detailed morphology of the moat (profiles have been shifted vertically and stacked for clarity). The termination is laterally continuous, and is associated with a moat that is10–20 m deep, and bound by the ridgeward dipping cor- rugated surface and a scarp facing the corrugated surface. Theapronsurface shows extension-parallel lineaments that correspond to larger corrugations of the detachment fault (red arrows), in addition to oblique structures associated with its deformation.
Geochemistry, Geophysics, Geosystems
10.1002/2016GC006775along- and across-extension directions, respectively, showing corrugations indistinguishable from those of the corrugated surface elsewhere (Figure 6C). Comparison of across axis profiles away from and close to the ridge axis (profiles e and f respectively, Figures 6C and 6F) clearly shows a structural low>70 m deeper than the detachment fault surface surrounding this low (grey line in Figure 6F).
Figure 11.ROV Video captures of the termination,apron, and volcanic seafloor at the rift valley floor at 138200N. (A) View toward the south of the termination area, showing the scarp facing the corrugated surface and defining the moat at the termination (see inset in Figure 10D, dive 548). The scarp in the view is10 m high, exposes unconsolidated rubble in finer-grained material, and displays extensive mass wasting that accumulates at the base of the scarp and over the termination where the corrugated surface emerges. (B) Ridgeward (east dipping) slope of theapron, showing a sedimented surface with rubble (dive 548). (C) In situ pillows and lobate basalt flows, showing a light sediment cover, at the summit of a small volcanic seamount immediately adjacent to the base of theapron(dive 547, field of view 10 m). See Figure 10B for location of views.
ROV observations along the corrugated surface show almost continuous blanketing by sediment and rub- ble. Areas with fine-grained sediment are located primarily in bathymetric lows at the base of slopes or along troughs between ridges that define the corrugations. Unconsolidated rubble is found primarily along the top and flanks of corrugations (Figure 7A). The ripple-like structures across these corrugations (Figure 6B) display packets of rubble on the ridgeward slopes, and fine-grained sediment cover between the ridges (Figure 7B). Sampling of this sediment and rubble blanket yielded primarily basalt, with some samples showing pillow margins, and hosting greenschist grade alteration minerals, in addition to peridotites (see supporting information Table S1 for complete lithological summary).
Locally and along the steeper slopes of the corrugations, we have identified fault planes exposed at the sea- floor (Figure 7C). Of the seven outcrops that we have identified, one is on the flank of a corrugation within the structural low shown in Figures 6C and 6F. These outcrops extend30 and100 m in the spreading direction, and up to 100 m laterally. They emerge from the sediment and rubble that otherwise covers the seafloor pervasively across the entirecorrugated surfaceand that blankets the corrugations both at their top and their base (Figures 7C–7E). Field observations also suggest that this sediment and rubble cover is thin, and that is locally shed from steeper portions of the corrugated fault surfaces, hence exposing the underly- ing fault plane at the seafloor. Videomosaics of the fault planes (Figures 7D and 7E), that extend laterally from a few m to a few tens of m, show clear subhorizontal striations along these surfaces. These outcrops also display a complex tectonic structure, with individual striated fault planes terminating against or cross- cutting each other, a geometry reminiscent of that observed at striated fault outcrops on land [Candela and Renard, 2012]. These anastomosing fault planes define bodies of rock that are elongate in the extension direction, and flattened subparallel to the overall fault plane orientation and dip. In situ samples of the fault planes are primarily fault breccia with angular basalt clasts. In some oucrops, in addition to the basaltic fault breccias, fault rocks show clasts of serpentinized peridotite together with basalt clasts.
12D 12C 12B
44˚56'W 44˚54'W 44˚52'W
13˚25'N 13˚26'N
4.5 4.0 3.5 3.0 2.5 2.0Depth,km
A)
B C)
B) C) C C C C C C C C C C C C C C C C C C C C C C C C C C C C C C C C C) ) ) ) ) ) ) ) ) ) ) ) ) ) ) ) ) ) ) ) ) ) ) ) ) ) ) ) ) D)
P f1
f2
P P
S
S
Figure 12.(A) Shipboard multibeam bathymetry of the inter-OCC seafloor showing the track and sampling of ROV dive 545. Labelsf1 and f2 indicate the fault scarps by the rift valley and off axis, respectively. (B) View of in situ pillows (including cross sections) exposed along the base of the rift-bounding scarp (field of view8 m). (C) Lobate and pillow lavas at the summit of the off-axis seamount (field of view 10 m). (D) Pillow lavas (P) in sedimented seafloor showing ripples (S), adjacent to edge of Western fault scarp (view to the north-north- east). View taken at the western end of the 545 dive track (field of view in foreground15 m). Location of seafloor images B–D are shown in Figure 12A; black labels).
Geochemistry, Geophysics, Geosystems
10.1002/2016GC0067754.2.2. 138300N OCC Corrugated Surface
In contrast to the oceanic detachment fault system exposed at the 138200N OCC, which is structurally intact (Figure 2B), the 138300N OCC detachment surface is disrupted by normal faulting, fissuring, and mass wast- ing (Figures 2 and 9), but show corrugations that are otherwise morphologically similar to those of the 138200OCC (Figure 9A). Near its termination, the detachment is tectonically dismembered (Figure 9A), with an oblique normal fault scarp facing away from the axis up to100 m high, and a series of smaller (10–
30 m high) fault scarps facing the ridge axis (Figures 3F and 9A). These faults bound a small local graben cutting the corrugated surface, and isolate a tectonic block toward the termination with the corrugated sur- face on its ridgeward, northeast slope (csin Figure 8A).
The 138300N corrugated surface is also affected by mass wasting, with coalescing crescent-shaped and steep slump scarps associated with debris deposits downslope (Figures 3B and 8B). The mass wasting features develop on the north and south flanks of the corrugated surface, at the inflexion from subhorizontal to slopes of158southward and258northward (Figures 2 and 8B). We also observe fissures crosscut the cor- rugations at the structurally shallowest areas of the corrugated surface (Figure 8C), that expose both the capping sediment and rubble layer, and the underlying detachment fault zone in their walls (Figure 9B).
ROV observations show that these fissures attain widths of up to a few meters across, are up to several tens of centimeter deep, and that are partially infilled with unconsolidated sediment (Figure 9B).
Cross-sections through the detachment fault zone in the footwall are exposed along the scarps of both faults (Figures 9A and 9C) and mass wasting scarps (Figure 9D), and along fissures (Figure 9B) dissecting the 138300N OCC. The top of the detachment is subhorizontal at outcrop scale, and ubiquitously covered by a lay- er of rubble and sediment (Figures 9A and 9C) that is also observed along fissures and faults. The rubble layer thickness is variable, but ROV observations suggest that it can reach up to a few meters (typically<5 m).
The detachment fault zone is exposed along mass-wasting scarps and crosscutting normal faults, and reveals an internal architecture with shear zones varying laterally both in thickness and nature both parallel and perpendicular to the extension direction. Visual ROV observations document discrete fault planes that localize deformation, or damage zones up to a few tens of cm thick that probably correspond to more dis- tributed deformation (Figure 9A). At the scale of outcrops, these high strain shear zones are spaced vertically between a few tens of cm to a few meters (arrows in Figure 9A), and anastomose bounding rock blocks that that visually appear to be undeformed internally.
As at the 138200N OCC, the corrugated surface is covered by sediment and rubble, with hydrothermal deposits limited to the active Irinovskoe hydrothermal field (see below). In contrast, the 138300N corrugated surface shows sulfide rubble and mounds across much of its surface, corresponding to the hydrothermal fields identi- fied in prior studies [Cherkashov et al., 2016;Pertsev et al., 2012]. The fault scarps also reveal hydrothermal deposits resulting from fluid percolation both through the detachment fault zone and the overlying sediment and rubble (Figure 9C). We have also identified recent volcanics emplaced over this detachment fault surface.
These include fresh pillows lavas with fresh glass over the easternmost faulted block of the detachment sur- face, and the recent volcanic construction (30 m high) emplaced within the small graben bound by these later faults, and that seems unfaulted (outlined by red dashed line and labeledVin Figure 8A).
4.3. Hangingwall Cutoff and Apron
The hangingwall cutoff (termination) of the 138200N corrugated surface toward the ridge axis corresponds to a laterally continuous and well-defined depression or moat (Figures 10A–10C). This moat has variable width, ranging from a few tens of m to250 m, and a vertical relief of10 m in average, reaching40 m locally (Figures 10C and 10D). This moat is also visible in available side-scan sonar data as a bright, acousti- cally reflective line [MacLeod et al., 2009], and corresponds to the hangingwall cut off, and thus to the struc- tural transition between the footwall (corrugated surface) and the hangingwall. We conducted several ROV dives to obtain geological observations and samples, exploring>8 km of the moat (Figures 2C and 2E).
These observations show that the ridgeward, east-dipping western slope of the moat, which corresponds thus to the emerging corrugated detachment surface, is covered by pervasive sediment and rubble, with no outcrop of the detachment fault surface at the seafloor. The eastern moat flank, facing away from the ridge, corresponds to the western limit of the hangingwall (Figures 2C, 2D, 3A, and 10). The steeper and higher scarps show extensive evidence of mass wasting that is likely continuous in time and active at the present time (Figure 11A) This results in rock and debris chutes derived from the hangingwall that
pervasively cover the moat floor. Geologic observations of the moat did not reveal any evidence of recent deformation structures (e.g., newly open fissures or fresh scarps) despite the continued extension and denu- dation of the detachment system that is inferred.
Both the shipboard and AUV bathymetry show that the seafloor immediately adjacent to the corrugated surface, to the east of the moat, is elevated up to100 m above the adjacent volcanic seafloor at the rift valley floor (Figure 10D). This uplifted terrain defines an arcuateapronthat follows the curved geometry in plan view of the hangingwall cutoff (Figures (2 and 10)). ROV observations show steep screes that provide evidence of active mass wasting (Figure 11A) westward and toward the center of the moat. Theapron’s sur- face also shows a gentler dip than that of the corrugated surface near its termination (108–128 versus 158respectively, Figure 10D). Theapron’s surface lacks the volcanic morphology found at the rift valley floor (hummocks, volcanic cones), and is instead smoother (Figure 10). The microbathymetry shows two main structures throughout theapron: First, there are lineaments parallel to extension and continuous with the larger bathymetric corrugations of the detachment surface (red arrows in Figures 10A and 10B), and sec- ond, we observe ridges and troughs dissecting the apron, with orientations relative to the termination that can be both subperpendicular (apronby the northern part of the termination, Figure 2C), or subparallel (southern part of theapron, Figure 2C). Dives on the apron surface (Figures 10A and 10B) reveals pervasive pelagic sediment cover together with loose rubble and blocks.
The rock types recovered during ROV dives show that the composition of theapronis heterogeneous.
Along smooth areas lacking marked ridges and troughs, the rubble on theapron’s surface is composed primarily of basalt and diabase (Figure 10B). In contrast, sampling during dives along steep flanks of troughs and ridges dissecting theapron(e.g., near its western tip, Figure 10A), and along the walls and floor of the moat (termination, Figure 11B), yielded gabbro and peridotite in addition to basaltic rocks.
The geological observations both along theapron and the eastern wall of the moat (Figure 11B) also revealed outcrops with angular blocks and rocks of variable sizes (up to several m) embedded in an unli- thified matrix.
The termination andapronat the 138300N detachment (Figure 8A) are not clearly defined, likely due to the late faulting dissecting it near axis. Between the rift valley floor seamounts (sin Figure 8A) and the faulted block of corrugated surface (csin Figure 8A), we observe and an area with irregular topography (ain Figure 8A). In this same area, the termination extends for1 km (dashed line in Figure 8A), and along a local depression that is10–20 m deep, and that may correspond to a now dissected moat similar to that observed at the 138200N OCC.
4.4. Axial Valley Floor
The microbathymetry of the axial valley floor immediately adjacent to the terminations of both the 138200N and 138300N detachment systems reveals a volcanic textured seafloor with both hummocks and volcanic cones. The latter often host summit craters (Figures 8A and 10B). Seamounts can reach500 m in diameter and summit100 m above the surrounding seafloor. Faulting is limited to small scarps (<10 m in vertical offset) dissecting the volcanic cones locally, and fissures. The axial volcanic seafloor adjacent to the 138200N was visited at the start of ROV dive 548 (Figure 10B). Sonar maps of this section of the rift valley floor show an acoustic backscatter that is lower than that of the reflective neovolcanic terrain to the North and South of the OCC. This difference in acoustic reflectivity was interpreted to indi- cate a less magmatic ridge section not resurfaced recently by lava flows [MacLeod et al., 2009;Mallows and Searle, 2012].
ROV observations showed lobate lava flows at the summit of a flat-topped seamount that are lightly sedi- mented, and elongated pillows and rubble on its flanks. The seafloor between the base of the volcano and that of theapronshows in situ pillow lavas, also with a light sediment cover (Figure 11C). All basalts recov- ered are fresh and often show glassy rims. The transition from volcanic seafloor to the base of theapronat 138200N (Figure 10B) shows a rapid although gradual decrease of pillow abundance on the seafloor, and an increase in thickness of the sediment cover and its thickness.
4.5. Inter-OCC Seafloor
The seafloor between the two OCCs is characterized by a4000 m deep basin west of the axial volcanic ridge (Figure 1), bound to the west by a normal fault that extends20 km along axis (labeledf1in Figure
Geochemistry, Geophysics, Geosystems
10.1002/2016GC00677512A) and a second one3–4 km further off axis to the west (f2in Figure 12A), both with a vertical relief of
>500 m. The multibeam bathymetry shows that these fault scarps have back tilts of108–158and 258–308,
respectively, consistent with progressive increase of the tectonic rotation with distance from the ridge axis, as documented in earlier studies in this and other areas along the MAR [MacLeod et al., 2009;Schouten et al., 2010]. The bathymetry between these two fault scarps also shows a large seamount2 km in diame- ter and350 m high (Figure 12A). The summit of this volcano is flat topped and shows a10 m deep, elon- gated crater. Bathymetric profiles across the seamount summit parallel to the extension direction show that the crater rim is subhorizontal, suggesting volcanic emplacement that postdates any tectonic rotation due to faulting. Observations during ROV dive 545 (Figure 12A) show in situ pillow lavas at the summit of the off-axis seamount, that are lightly sedimented but have a fresh visual appearance; samples show glassy rims (Figure 12C). As with the case of the axial valley floor seamounts, the flanks of this off-axis volcano con- struct show both in situ pillow lavas and basaltic rubble.
The two main fault scarps are morphologically complex, with mass wasting and large-scale fissures, locally exposing in situ pillows and lava tubes. As in the case of the breakaway of the 138200N OCC (Figures 4 and 5C), we observe an abrupt transition at the summit of the second scarp to west-dipping seafloor that is heavily sedimented, and locally hosts in situ pillow lavas. All samples recovered along this ROV transect, including those at the seamount described earlier, are basaltic, often show glassy rims, and lack any greens- chist facies hydrothermal alteration (supporting information Table S1).
5. Hydrothermal Activity
Previous studies reported an active hydrothermal field (Semenov-2) at the 138300N OCC, in addition to numerous inactive vents across the OCC (Semenov-1, 3, 4, and 5), and the presence of massive sulfides that were dredged from the surface the 138200N OCC [Cherkashev et al., 2013;MacLeod et al., 2009;Pertsev et al., 2012], without confirming any activity. The ODEMAR cruise identified a water-column Eh and neph- elometry anomaly during AUV surveys over the 138200N corrugated surface, and ROV seafloor observa- tions confirmed the presence of active venting at the Irinovskoe hydrothermal field. We also extensively studied the Semenov-2 active vent field on the 138300N OCC, as well as the fossil hydrothermal deposits throughout the northern OCC (Figures 2A, 2B, 8A, and 9C). Here we provide a brief overview of these results and of the active Irinovskoe and Semenov-2 hydrothermal sites. Detailed description of the active and inactive hydrothermal deposits, and of the chemistry of fluids sampled during the cruise, will be pro- vided elsewhere.
5.1. Irinovskoe Active Hydrothermal Field
The Irinovskoe hydrothermal field, explored during ROV dives 553 and 557, is located on the northern region of the 138200Ncorrugated surface,1.8 km from the footwall cutoff in the direction of extension (Figures 2C, 2D, and 3A). The microbathymetry of the area shows irregular topography that is typical of hydrothermal deposits elsewhere [Escartin et al., 2015;Ferrini et al., 2008]. Coalescing mounds rise up to 10–20 m above surrounding seafloor, masking corrugations of the detachment surface over an area 3003200 m in the across- and along-extension directions, respectively (Figure 13A). During two ROV dives we identified two active vents at the summit of hydrothermal mounds, Active Pot and Pinnacle Ridge (Table 1). Both show black smoker fluids venting at3658C from1 to 2 m high cauldron-shaped structures (Figure 13C) with large exit orifices (several decimeters in diameter), clearly associated with very elevated heat and mass fluxes. We did not observe any associated macrofauna, while bacterial mats and diffuse lower-temperature outflow were limited to the immediate vicinity of these two active vents.
The nearby hydrothermal mounds show both fallen and standing hydrothermal chimneys, up to10 m in height.
5.2. Semenov-2 Active Hydrothermal Field and Other Sulfide Deposits
Active venting at the Semenov-2 hydrothermal field was first identified in 2007 and later explored with towed camera systems in 2009 during Russian cruises [Cherkashev et al., 2013; Pertsev et al., 2012]. ROV exploration of the site during the ODEMAR cruise shows that the site is located along a fault scarp facing the ridge axis within thechaotic terrainwest of the corrugated surface, and5.5 km from the hangingwall cutoff at the rift valley floor, corresponding to a spreading age of470 ka assuming symmetric spreading