1
Additional file 4
1
Response (Gene expression
vs. Fat intake)
Proximal Middle Distal
Gene
(count) Relative % GOBP (count)
Gene
(count) Relative % GOBP (count)
Gene
(count) Relative % GOBP (count)
Linear 1219 48.18 6 1439 50.03 16 366 50.76 3
Logarithmic 719 28.42 7 443 15.40 11 45 6.24 -
Exponential 148 5.85 2 461 16.03 17 121 16.78 6
Quadratic 212 8.38 - 326 11.34 - 85 11.79 -
Cubic 232 9.17 1 207 7.20 - 104 14.42 4
2
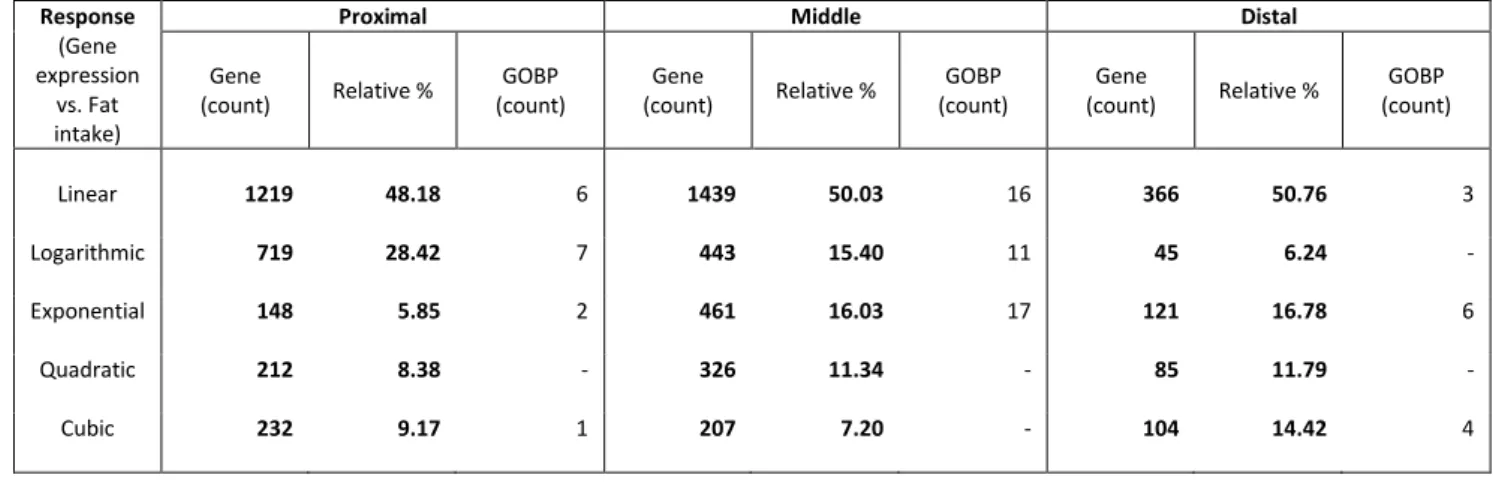
Table A4: Count of genes that responded in a significant, dose-dependent way to fat intake (model 3
selection based on AIC). We identified the significant responses in three sections of small intestine (limma 4
library, adjusted p-value < 0.1). Differential gene expression was modelled as either a linear or nonlinear 5
(i.e., logarithmic, exponential, quadratic or cubic) function of dietary fat intake. For each section, we 6
reported the percentage of genes per response type (%) and the number of significant GO terms (Biological 7
Processes - GOBP; hypergeometric test, adjusted p-value < 0. 1). Only GOBP terms with, at least, six 8
differentially expressed genes (in the whole small intestine) have been taken into account. Outcomes 9
obtained by using AIC for model selection were coherent with the trends reported in the manuscript (i.e., 10
model selection based on the lowest p-value; see Table 1). In particular, with AIC we found: (I) the 11
prevalence of linear-responding genes in all intestine sections; (II) the decreasing relative importance of the 12
logarithmic response when moving from the proximal to the distal section (while the opposite pattern 13
holds for the exponential response); (III) the marginal relevance of other response types (i.e., quadratic and 14
cubic functions).
15