Additional file 7
1
Section and
responses GO ID GOBP
Proximal Middle Distal
Set
size Hits Adjusted p-value
Set
size Hits Adjusted p-value
Set
size Hits Adjusted p-value
Prox – Mid – Dist (all linear)
GO:0006749 glutathione
metabolic process 24 5 0.01 24 6 0.01 24 2 0.04
GO:0006888 ER to Golgi vesicle-
mediated transport 22 4 0.05 22 5 0.02 22 2 0.03
Prox – Mid – Dist (lm – log -lm)
GO:0006749 glutathione
metabolic process 24 5 0.01 24 4 <0.01 24 2 0.04
GO:0042632 cholesterol
homeostasis 33 5 0.06 33 3 0.04 33 2 0.08
Prox – Mid (lm - lm)
GO:0006629 lipid metabolic
process 184 26 <0.01 183 38 <0.01
GO:0006631 fatty acid metabolic
process 68 19 <0.01 67 28 <0.01
GO:0006635 fatty acid beta-
oxidation 21 9 <0.01 21 11 <0.01
GO:0006637 acyl-CoA metabolic
process 19 6 <0.01 19 6 <0.01
GO:0006695 cholesterol
biosynthetic process 18 5 <0.01 18 4 0.04
GO:0008610 lipid biosynthetic
process 81 10 0.01 81 11 0.02
GO:0016192 vesicle-mediated
transport 134 13 0.03 134 19 <0.01
GO:0022900 electron transport
chain 69 11 <0.01 69 14 <0.01
GO:0045454 cell redox
homeostasis 47 6 0.07 47 9 <0.01
GO:0051289 protein
homotetramerization 38 7 <0.01 38 6 0.07 Prox – Mid
(lm - log) GO:0022900 electron transport
chain 69 11 <0.01 69 5 0.03
Prox – Mid
(log - lm) GO:0006631 fatty acid metabolic
process 68 6 0.07 67 28 <0.01
Mid – Dist (log - lm)
GO:0033344 cholesterol efflux 17 2 0.04 17 2 0.02
GO:0042325 regulation of
phosphorylation 34 3 0.04 34 2 0.08
2
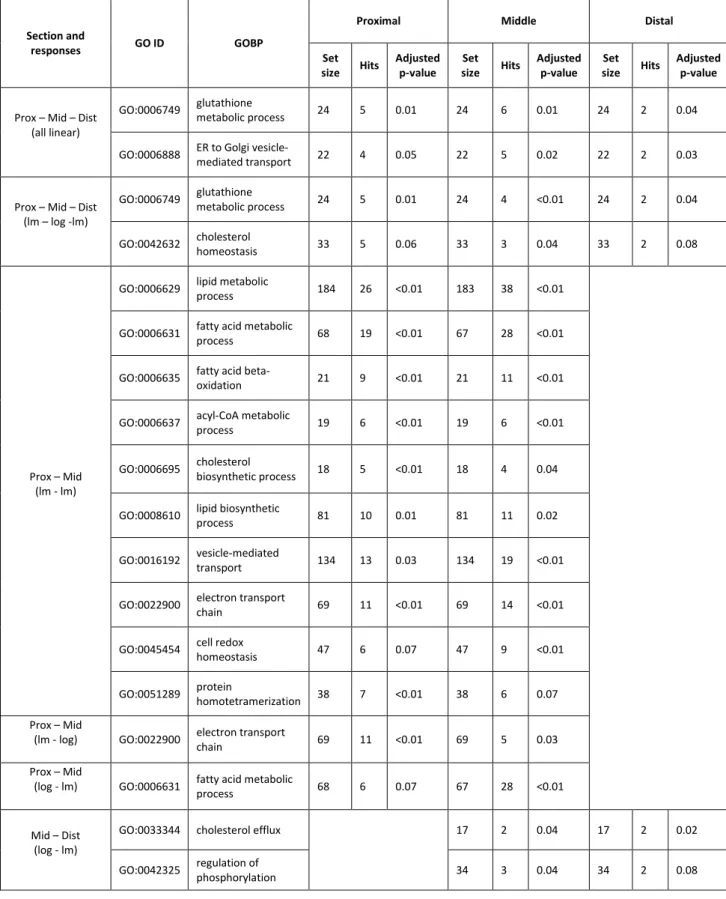
Table A7: Over-represented Gene Ontology Biological Process (GOBP) terms that are completely up-regulated and can be found
3
in various intestinal sections. For each GOBP term we summarize: the total number of genes in the microarray (gene set size,
4
labelled as Set size), the count of genes extracted with our analysis (observed hits, labelled as Hits), and the adjusted p-values.
5
Intestine sections: Prox = proximal; Mid = middle; Dist = distal. Response types: lm = linear; log = logarithm; exp = exponential.