Additional file 9
1
Section and
responses GO ID GOBP
Proximal Middle Distal
Set size Hits Adjusted
p-value Set size Hits Adjusted
p-value Set size Hits Adjusted p-value Prox – Mid –
Dist (all linear)
GO:0045785 positive regulation
of cell adhesion 26 4 0.05 26 5 0.08 25 2 0.03
Prox – Mid – Dist (lm – exp -
lm)
GO:0003333
amino acid transmembrane transport
39 5 0.05 39 3 0.09 39 2 0.07
Prox – Mid (lm - lm)
GO:0007040 lysosome
organization 18 4 0.02 18 4 0.08
GO:0009615 response to virus 59 7 0.03 59 9 0.07
GO:0030335 positive regulation
of cell migration 83 10 0.01 83 10 0.08
Prox – Mid (lm - exp)
GO:0007243 intracellular protein
kinase cascade 56 7 0.03 56 6 0.01
GO:0009615 response to virus 59 7 0.03 59 5 0.04
GO:0030301 cholesterol
transport 15 3 0.05 15 4 <0.01
GO:0033344 cholesterol efflux 17 4 0.01 17 3 0.03
GO:0042632 cholesterol
homeostasis 33 6 0.01 33 3 0.07
GO:0046777 protein
autophosphorylation 91 9 0.04 90 5 0.09
GO:0071300 cellular response to
retinoic acid 17 5 <0.01 17 3 0.03
Prox – Mid
(log - lm) GO:0009615 response to virus 59 6 0.04 59 9 0.07
Prox – Mid
(log - log) GO:0043029 T cell homeostasis 15 3 0.03 15 2 0.08
Prox – Mid (log - exp)
GO:0009615 response to virus 59 6 0.04 59 5 0.04
GO:0016358 dendrite
development 18 4 0.01 20 2 0.09
Mid - Dist (lm - lm)
GO:0006953 acute-phase
response 22 5 0.07 21 2 0.02
GO:0016042 lipid catabolic
process 69 9 0.08 69 4 0.02
2
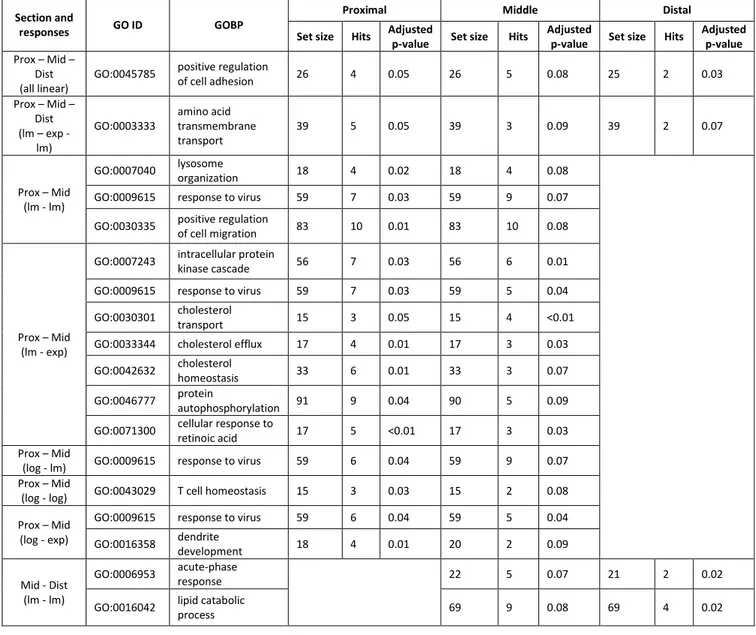
Table A9: Over-represented Gene Ontology Biological Process (GOBP) terms with down-regulated genes only. Data refer to GOBP
3
terms that can be found in various intestinal sections. The following details are provided for each GOBP term: total number of
4
genes in the microarray (gene set size, labelled as Set size), count of genes extracted with our analysis (observed hits, labelled as
5
Hits), and adjusted p-values. Intestine sections: Prox = proximal; Mid = middle; Dist = distal. Response types: lm = linear; log =
6
logarithm; exp = exponential.