Are they any good at all? A
financial and ethical analysis of socially responsible mutual funds
Sebastian Utz
is a research fellow in the Department of Finance, University of Regensburg, Germany. He holds a master’s degree in mathematics from the University of Augsburg and a Ph.D. in business administration from the University of Regensburg. His research interests are in the areas of multicriteria portfolio theory and socially responsible investing.
Maximilian Wimmer
is a research fellow in the Department of Finance, University of Regensburg, Germany, and a visiting professor in the Area Finance, University of Mannheim, Germany. He holds a master’s degree in mathematics from Iowa State University, a master’s degree in business mathematics from the University of Augsburg, and a Ph.D. in business administration from the University of Regensburg.
His research interests include multicriteria portfolio selection, socially responsible investing, risk capital allocation, and weather derivatives.
Correspondence: Maximilian Wimmer, Department of Finance, University of Regensburg, 93040 Regensburg, Germany, maximilian.wimmer@ur.de
ABSTRACT In this article, we examine a broad sample of socially responsible (SR) and conventional mutual funds with respect to financial and ethical parameters. We cannot document profound differences in their financial performance. With regard to ethical perfor- mance, we indeed find that an investor who seeks to avoid the least ethical of all available funds can do so by purchasing SR mutual funds. Still, we also demonstrate that SR mutual funds are not holding considerably more ethical assets on average. Moreover, the label ‘SR mutual fund’ does not in any way guarantee the exclusion of clearly unethical firms, which contrasts to the common perception of screening out poor assets.
Keywords: socially responsible investment; performance analysis; mutual funds; ESG- scores
INTRODUCTION
When socially responsible investment (SRI) emerged in the 1960s, it was first consid- ered to be a small niche market for philan- thropists and do-gooders. However, with
$3.74 trillion assets under management in the United States (US SIF, 2012) and
$13.57 trillion worldwide (GSIA, 2013) in
2012, SRI has matured into a significant and influential investment class.
Since the beginning of the evolution of SRI in the 1960s, academics have sought to analyze and monitor the financial perfor- mance of SRI. While there are some studies that report upon a superior financial perfor- mance of certain SRI criteria (Moskowitz,
1972; Luck and Pilotte, 1993; Derwallet al, 2005; Edmans, 2011), others find empir- ical evidence of a financial underperfor- mance (Brammeret al, 2006; Renneboog et al, 2008a; Hong and Kacperczyk, 2009;
Mˇanescu, 2011). There is also a bulk of studies which sees no significant differences between the financial performance of SRI and conventional investments (Hamilton et al, 1993; Kurtz and DiBartolomeo, 1996;
Guerard, 1997; Baueret al, 2005; Schröder, 2007; Statman and Glushkov, 2008). For more details on the financial performance of SRI, we refer to the excellent review articles of Rennebooget al(2008b), Margoliset al (2009), and Capelle-Blancard and Monjon (2012).
While these studies do a good job in as- sessing the financial performance of socially responsible (SR) mutual funds, they mostly ignore the fact that, besides generating an acceptable financial performance, SRI also strives to satisfy another, possibly even op- posing, objective: That is, complying with ethical principles. As Capelle-Blancard and Monjon (2012) point out, there are only few scholarly articles which even consider this second objective. In this paper, we examine a broad sample of SR and conventional mutual funds from the United States with respect to both their financialandethical performance. Akin to our study is Utzet al (2014), who put emphasis on implicit risk tolerances of SR mutual funds using an elaborated multi-criterial decision model though. We attach a different focus to this paper and contribute to the literature in two ways. Firstly, with regard to financial performance, we analyze the two types of funds with common performance measures, but we cannot find any profound differences in their performances in either way. Sec- ondly, with regard to ethical performance, we cannot find much compelling evidence for a conspicuously higher ranking for SR mutual funds compared to conventional
funds either. However, while there are a few rotten apples among the conventional funds from an ethical perspective, there appears to be no single SR mutual fund which holds a similarly unethical portfolio. Yet, when considering the individual assets in which the funds invest, it does not appear that SR funds shun unethical investments to the slightest degree—a somewhat confusing re- sult which contradicts the idea of screening out poor assets. Therefore, the label ‘SRI’
appears to have become more of a marketing tool than a guarantee for complying with ethical principles.
The remainder of this article is orga- nized as follows. In the next section, we introduce and describe our data in detail.
After that, we lay out our methodological and conceptual framework before reporting upon our results and discussing their im- plications. We conclude our paper with a summary and a few remarks.
DATA
Our study is based on data obtained from several sources. We use mutual fund data and financial returns from the CRSP Survivor-Bias-Free US Mutual Fund database. This database contains monthly net returns, i.e., after management fees and costs have been deducted, of more than 59,000 US mutual funds which we will use to assess financial performance. Moreover, the database documents the holdings of the funds (which we callfund portfolios) on certain reporting dates (usually quarterly) which we will match with ethical scores of the individual assets to assess ethical performance. To classify the mutual funds contained in the CRSP database into SR funds and conventional funds, we use a list provided by the US Social Investment Forum (US SIF, 2013). This list contains all socially responsible mutual funds offered by
Table 1: Overview of available data for ESG analysis.
2002 2003 2004 2005 2006 2007 2008 2009 2010 2011 2012 Panel Asset4
No. firm ratings 1,088 1,092 1,486 1,712 1,727 1,855 2,261 2,474 2,591 2,604 2,611
No. SR fund portf. 2 17 25 35 37 51 84 154 159 312 284
No. conv. funds portf. 179 1,367 1,442 1,761 2,747 2,907 5,786 9,542 7,933 13,805 12,385 Panel Bloomberg
No. firm ratings 1 2 21 180 365 923 1,194 1,216 1,225 1,253 1,253
No. SR fund portf. 0 0 0 0 0 14 51 119 92 175 138
No. conv. funds portf. 0 0 0 1 51 884 3,108 6,216 3,814 6,203 3,959
In each panel, the first row reports upon the number of ESG-rated firms by year. The last two rows in each panel show the number of reported fund holdings for SR and conventional mutual funds, respectively. Most funds report their holdings more frequently than yearly. The latest reporting date considered is December 31, 2012.
US SIF’s institutional member firms. Since, in contrast to the CRSP database, this list is not survivorship-bias-free, we identify older SRI funds by using several key words (clean, environment, environmental, ethic, ethical, green, responsibility, social, sustainable, sustainability). For the financial parameters, we require the documentation of at least 36 monthly returns in order to ensure stable es- timates. This leads to the exclusion of some funds, so that we eventually end up working with financial data for 37,398 conventional mutual funds (123.3 monthly returns per fund on average) and for 230 SR mutual funds (102.6 monthly returns per fund on average).
Moreover, we make use of ratings re- garding the ethical performance of firms from two different providers, namely from the Asset4 module of Thomson Reuters Datastream and from Bloomberg. Both contain ratings for more than one thousand firms according to their environment, social, and corporate governance (ESG) issues in at least one year. In the following we give an exemplary overview of the rating procedure of ESG issues by detailing the approach em- ployed by Asset4. The analysts of this rating agency score information upon an enormous number (686 in total) of datapoints. Every datapoint corresponds to a single question such as ‘Does the company produce alco- holic beverages,’ ‘Does the company have
a provision or comply with regulations protecting whistleblowers,’ or ‘Broad gen- der diversity: Proportion of female broad members.’ Most of these datapoints are binary variables. In the next step, datapoints regarding similar topics or related areas are condensed into a so-called key performance indicator. But there are still 282 of them in the Asset4 environment. Therefore, Asset4 applies a second aggregation in several cate- gories which are assigned to one of the four pillars ‘economic,’ ‘environment,’ ‘social,’
and ‘corporate governance.’ The environ- ment pillar, for instance, is subdivided into the three categories ‘resource reduction,’
‘emission reduction,’ and ‘product innova- tion.’ Each firms has an aggregated score re- flecting the assessment of its strategy and ef- forts regarding each pillar. We use the three pillars ‘environment,’ ‘social,’ and ‘corporate governance’ and take the arithmetic average of these three scores as the ESG score of each firm in our sample. These scores are usually updated every year and available as historical time series from 2002 onwards.
Therefore, our sample contains yearly ESG data for every firm in the period from 2002 to 2012. Both Asset4 and Bloomberg rate ESG scores on a scale from 0 to 100% and have in common that a higher score means higher ethical performance. The precise number of available ESG data per year is reported in Table 1.
In the next step, we match the ESG scores to our mutual fund data. While the mutual funds’ holdings are classified using the NASDAQ ticker symbols, ESG scores are classified by ISINs . Therefore, we man- ually match both variables for all available assets. As the Asset4 and the Bloomberg rating universes do not cover all traded as- sets, it arises that a fund portfolio comprises rated and non-rated assets. Therefore, we use two slightly different samples in the financial and ESG analysis. Whereas we use the actual mutual fund returns of the entire fund portfolio by utilizing the return data from CRSP as described above, our analysis regarding the ESG performance is based on the subportfolios of assets for which we have ESG scores available. In this approach, we implicitly assume that non-rated firms ex- hibit similar properties regarding the ethical performance as the rated firms in a portfolio.
In order not to include subportfolios which are too distinct from the actual fund port- folio, we disregard all subportfolios where less than 70% of the allocated fund’s wealth are covered by ESG scores. Subsequently, we scale the portfolio weights of our ESG- covered subportfolios so that they sum up to one. Finally, we exclude small fund holdings with less than 10 assets. Table 1 displays the exact number of fund portfolios remaining for our analysis regarding the ethical di- mension for the Asset4 dataset and for the Bloomberg dataset separately.
In order to compute financial risk- adjusted performance measures we need, be- sides the actual returns of the mutual funds, monthly returns of the market portfolio, the small-minus-big (SMB) portfolio, the high- minus-low (HML) portfolio, the winners- minus-losers (WML) portfolio, and monthly risk-free rates. We take these monthly time series from Kenneth French’s website (http://mba.tuck.dartmouth.edu/pages/
faculty/ken.french/data_library.html). The market, SMB, HML, and WML portfolios
consist of all stocks from the three major US equity exchanges, namely NYSE, AMEX, and NASDAQ, that are reported in the CRSP database. The 1-month T-Bill return is reported by Ibbotson and Associates, Inc.
METHODOLOGY
We commence this section by detailing the precise measures which we will use to assess the financial and ethical performance of mu- tual funds. Afterward, we develop testable hypotheses regarding the differences of SR mutual funds and conventional mutual funds.
Measures
To compare the financial performance of conventional with SR mutual funds, we rely on a battery of classical risk-adjusted performance measures which we briefly introduce in the following. We begin with computing the excess return
return= ¯rP−¯rf
of a fund, whererPdenotes a fund’s monthly returns over a sample period andrfdenotes the monthly risk-free rate over that period.
We place bars on top of the variables to express average returns over the sample period. To be able to account for risk, we compute the risk as the standard deviation of the excess returns
risk=Std(rP−rf).
Our first actual risk-adjusted perfor- mance measure is the Sharpe ratio in the revised form of Sharpe (1994), which quan- tifies the reward to volatility trade-off and is given by
SR= r¯P−¯rf Std(rP−rf).
Thus, the Sharpe ratio divides the average
excess fund return by the standard deviation of the excess fund return.
While the Sharpe ratio takes total volatility as a risk measure in the denomina- tor, the Treynor (1965) ratio considers only the systematic risk. Formally, it is defined by
TR= r¯P−¯rf
βP ,
whereβPis the funds’ sample CAPM beta.
Using the returns of the market portfoliorM, beta can be computed as
βP= Cov(rP,rM) Var(rM) .
Notice that both the Sharpe ratio and the Treynor ratio suffer from the fact that negative values are hard to interpret. In particular, while for positive values a higher ratio signifies superior performance, it might be the opposite for negative values. Thus, while we report on the ratios for informa- tional purposes, it is difficult to use them in a statistic for comparing a large amount of funds.
Hence, we incorporate three further performance measures which entail a nat- ural ranking of the funds. One is the Jensen (1968) alpha. It measures the average excess return of the fund,r¯P−¯rf, over that predicted by the market model,βP( ¯rM−¯rf). Therefore, it can be computed as
αMM= ( ¯rP−¯rf)−βP( ¯rM−¯rf).
We also calculate alpha based on a Carhart (1997) four-factor model by
αC=( ¯rP−¯rf)−βP( ¯rM−¯rf)
−βSMBSMB¯ −βHMLHML¯
−βWMLWML,¯
whereSMBdenotes the small-minus-big portfolio,HMLdenotes the high-minus- low portfolio, andWMLdenotes winners- minus-losers portfolio.
Our last risk-adjusted performance mea- sure is theM2measure of Modigliani and Modigliani (1997). It denotes a fund’s excess returnr¯P−¯rf, which is adjusted to match the volatility of the market portfolio. Formally, it can be computed by
M2= ( ¯rP−¯rf)Std(rM−rf) Std(rP−rf) + ¯rf. Another advantage of the last-mentioned measures, the two alphas andM2, is that they are expressed in units of percent return, which makes them easily interpretable as risk-adjusted returns.
In order to assess the ethical perfor- mance of the funds, we start by analyzing each reported fund portfolio (or actually subportfolio, as described above) separately on all reporting dates and calculate the port- folio ESG score in accordance to Dorfleitner et al(2012) as
ESGP=
∑n i=1
wi·ESGi, i.e., as the weighted sum of its individual assets’ ESG scores. Here,widenotes the weight of thei-th asset in a portfolio (con- tainingnassets) andESGiits respective ESG score.
Since ESG scores are updated once annually, we wish to operate on a yearly basis when analyzing portfolio ESG scores as well. Therefore, we consolidate all re- ported portfolios of a fund in a specific year and consider only the yearly average of the individual portfolio ESG scores:
ESGY =meanESGP,
where the mean is taken over all portfolios of a certain fund in a certain year. Thus, ESGY denotes a fund’s average ESG score in a certain year. We callESGY thefund ESG score.
Furthermore, we analyze the least ethical individual asset in a fund’s portfolio and denote its ESG score by
ESGminP = min
i=1,...,nESGi. As above, we consider the minimum ESG scores on a yearly basis and define the yearly minimum ESG score of a certain fund as
ESGminY = minESGminP ,
where the minimum is taken over all portfo- lios of the respective fund in the respective year. We callESGminY theminimum asset ESG scoreof a fund.
Hypothesis development
The question of whether conventional and SR mutual funds differ in terms of financial performance is a widely discussed topic in the academic literature (see the discussion in the introduction), but the studies do not converge upon one of the following three alternatives: First, that there is no statistically significant evidence for different financial performance, second, that conventional mutual funds perform better financially, and third, that SR mutual funds perform better financially. In a thorough analysis regarding the distinct results in the former studies, Derwallet al(2011) explain the out- and underperformance using theshunned-stock hypothesisand theerrors-in-expectations hypoth- esis. On the one hand, the shunned-stock hypothesis depicts the fact that a significant demand for SR investments depresses the price of stocks related to firms with socially divisive issues as SR investors shun to buy them. Thus, controversial firms exhibit superior returns. On the other hand, the error-in-expectations hypothesis predicts that SR investments can provide superior returns because the market systematically underestimates the financial importance of a firm’s social responsibility. According to
Derwallet al(2011), both anomalies could occur in short-term analyses, but may be smoothed out in the long-run. Besides the time period, the size and the composition of the sample as well as the methodology are parameters that influence the results.
With that said we perform a comprehensive investigation for all US mutual funds in the CRSP database until 2012 with several standard measures described in the subsec- tion above to elicit evidence according the following four hypotheses regarding the financial performance:
Hypothesis F1: Conventional and SR mutual funds do not differ in terms of return.
Hypothesis F2: Conventional and SR mutual funds do not differ in terms of risk.
Hypothesis F3a: Conventional and SR mutual funds do not differ in terms of market model alpha.
Hypothesis F3b: Conventional and SR mutual funds do not differ in terms of Carhart four-factor alpha.
Hypothesis F4: Conventional and SR mutual funds do not differ in terms ofM2.
In contrast to the bulk of studies con- sidering the financial performance of con- ventional and SR mutual funds, there are far less articles examining differences in the ethical performance of both types of funds.
The only one we are aware of is Kempf and Osthoff (2008) who employ KLD ratings as proxies for the social responsibility for the CRSP fund sample, but during an earlier period (1991–2004). They find that SR mutual funds have significantly higher eth- ical ranks than conventional mutual funds.
Since they use ESG ratings from a different provider and a different time period, we
first intend to gauge the robustness and persistence of their result by replicating their methodology with our data, which is formalized in hypothesis S1 (notice that we wish to reject the null hypothesis, and it is therefore stated reversely).
Hypothesis S1: When ranked among ESG scores, SR mutual funds do not show higher ranks than conventional mutual funds.
Beyond that we wish to examine the struc- ture of ESG scores in the conventional and SR mutual funds more precisely. The mu- tual fund’s ESG score—the weighted sum of the single firms’ ESG scores with the portfolio weights—displays the aggregated level of social responsibility of all firms a fund comprises. Therefore, we utilize this score as a proxy for the ethical performance the portfolio is able to create. All assets in one fund share the characteristic which is that the included firms comply with the ethical requirements of the fund. Thus, we conjecture the average ESG score of a SR mutual fund to be higher than that of a conventional mutual fund.
Hypothesis S2: On average, SR mutual funds do not show higher fund ESG scores than conventional mutual funds.
Ethically driven investors might shy away from unethical funds in general and are therefore also interested in the lowest fund ESG score of both types of funds. An in- vestor who allocates her wealth to the same number of conventional and SR mutual funds would assume that the worst SR mutual fund is still doing better than the worst conventional fund from an ethical perspective. This is due to the fact that fund managers are supposed to exclude the least socially responsible firms and create a port- folio based upon the screened asset universe.
Thus, we conjecture that our sample of SR mutual funds exhibits a higher minimum fund ESG score than a sample consisting of the same amount of conventional mutual funds.
Hypothesis S3: The minimum of SR mu- tual funds’ ESG scores is not higher than the minimum of conventional mutual funds’ ESG scores.
Among SR mutual funds in the US, the approach of negative screening (i.e. ex- cluding firms with involvements in specific branches) is widespread practice. Therefore, our last hypothesis regards the ESG scores on an asset level. Funds which are screened in a socially responsible way are supposed to be free of assets with low ethical per- formance (i.e., low ESG scores) in general.
This motivates our last hypothesis:
Hypothesis S4: On average, the minimum asset ESG score of SR mutual funds is not higher than the minimum asset ESG score of conventional mutual funds.
RESULTS AND DISCUSSION
We present our results separately for the financial parameters, which correspond to hypotheses F1–F4 and for the ethical per- formance, which correspond to hypotheses S1–S4.
Financial
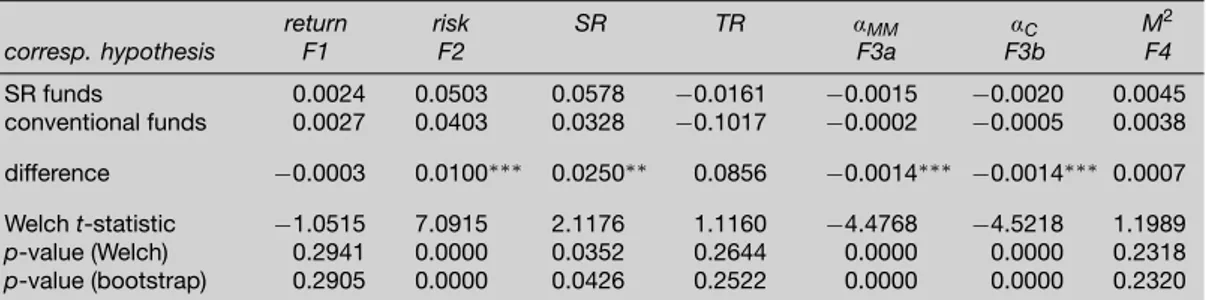
We apply our financial performance mea- sures, introduced above, to the monthly returns of all mutual funds reported in the CRSP database. The first three rows in Table 2 summarize the results, segmented in SR and conventional mutual funds. For each measure, we test the differences of the two types of funds by employing two statis-
Table 2: Financial performance measures based on monthly data.
return risk SR TR αMM αC M2
corresp. hypothesis F1 F2 F3a F3b F4
SR funds 0.0024 0.0503 0.0578 −0.0161 −0.0015 −0.0020 0.0045
conventional funds 0.0027 0.0403 0.0328 −0.1017 −0.0002 −0.0005 0.0038 difference −0.0003 0.0100∗∗∗ 0.0250∗∗ 0.0856 −0.0014∗∗∗ −0.0014∗∗∗ 0.0007 Welcht-statistic −1.0515 7.0915 2.1176 1.1160 −4.4768 −4.5218 1.1989 p-value (Welch) 0.2941 0.0000 0.0352 0.2644 0.0000 0.0000 0.2318 p-value (bootstrap) 0.2905 0.0000 0.0426 0.2522 0.0000 0.0000 0.2320 We report upon the averages of the financial performance measures for the 230 SR mutual funds and for the 37,398 conventional mutual funds. Significances of the differences are marked with∗,∗∗, and∗∗∗for a 10%, 5%, and 1% level, respectively.
tical tests. The first one is a classical Welch t-test, which is an adoption of a standard Studentt-test to allow for different sample sizes and heterogeneous variances. Our second test comprises a bootstrap approach with one million resamples. Here, for each resample, we draw an estimator for the mean of the respective performance measure from the data of the SR funds and from the data of the conventional funds, respectively. The p-value is then computed by counting the relative amount of rejections of the null hypothesis. When inspecting thep-values for the two tests in the bottom two rows of Table 2, it becomes apparent that the results of the two tests do not differ to a large de- gree. In particular, when working with the usual significance levels of 1%, 5%, and 10%, both tests yield the same significances for the differences of all performance measures.
When considering plain excess returns, we can document a slight, albeit not signif- icant, underperformance of 3 basis points (bp) monthly of the SR mutual funds. At the same time, the SR fund returns are riskier than their conventional counterparts, showing a highly significant increase in stan- dard deviation of 1.00%. Thus, while we cannot reject our hypothesis F1 regarding return, we can reject hypothesis F2 regard- ing risk on a 1% level.
When considering composite risk- adjusted performance measures, our results
are not conclusive in favor of either type of fund. While the SR funds perform worse (on a 1% level) according to the two alphas, there is no significant difference to their conventional peers with regard to theM2 measure.
When considering the classical finan- cial risk-adjusted ratios, i.e., Sharpe ratio and Treynor ratio, we encounter negative ratios for some of the funds (for both ratios, roughly 20% of all funds exhibit negative values). Since negative ratios do not allow a natural ranking for risk-return orientated investors (e.g., it could be that a fund with the same return but less risk exhibits a lesser performance ratio), we do not analyze these ratio any further and only document their averages in the table for informational pur- poses.
To summarize, when comparing the financial results, we find no compelling evidence to either document an out- or un- derperformance of SR mutual funds. When considering pure average excess return, both types of funds show quite sobering results, with monthly average excess returns of 24 bp for SR mutual funds and 27 bp for conventional mutual funds, respectively.
Additionally, no type of fund was able to generate a positive alpha on average. Yet, such numbers are in line with academic literature on mutual fund performance. This literature shows that after costs (mainly man-
agement expenses and fees) most actively managed funds underperform a benchmark index (see e.g. Gruber, 1996; Carhart, 1997;
Wermers, 2000).
Ethical
Although ESG scores are provided by several sustainability rating agencies, there has been very little research carried out on ethical performance of mutual funds up until now.
Nevertheless, ESG scores put researchers and practitioners into a position to analyze the ethical performance in more detail. Our first analysis attributes to the question of
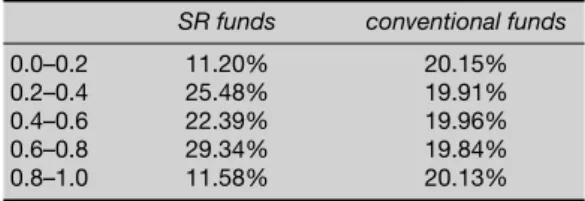
‘Nomen est omen’ (Kempf and Osthoff, 2008). We divide all 15,810 mutual funds portfolios (Asset4) and 7,070 mutual fund portfolios (Bloomberg), respectively, into quintiles according to their yearly fund ESG scores. Afterward, we compute the portion of SR mutual funds contained in each of the quintiles as well as the portions of their conventional counterparts. The results are reported in Table 3a (Asset4) and Table 3b (Bloomberg). The range of the portions selects values from 11.20% to 29.34% for the Asset4 ESG scores for the SR mutual funds (Bloomberg: 9.77% to 35.34%). Notice that the conventional funds are approximately equally distributed over the quintiles. However, the portion of SR mutual funds in a quintile does not increase with the ESG score quintiles, a contrasting result to Kempf and Osthoff (2008). For statistical purposes, we apply the Wilcoxon (1945) rank sum test to review our sample regarding hypothesis S1. Thep-values are 0.65 (Asset4) and 0.06 (Bloomberg) which indicate that the ranks of SR mutual are not statistically significantly different from the ranks of their conventional counterparts for the Asset4 data, and only on a very low significance level of 10% for the Bloomberg data. Yet, even in the Bloomberg data only
Table 3a: Funds sorted in quintiles of fund ESG score (Asset4).
SR funds conventional funds
0.0–0.2 11.20% 20.15%
0.2–0.4 25.48% 19.91%
0.4–0.6 22.39% 19.96%
0.6–0.8 29.34% 19.84%
0.8–1.0 11.58% 20.13%
Table 3b: Funds sorted in quintiles of fund ESG score (Bloomberg)
SR funds conventional funds
0.0–0.2 9.77% 20.20%
0.2–0.4 16.54% 20.07%
0.4–0.6 25.56% 19.89%
0.6–0.8 35.34% 19.71%
0.8–1.0 12.78% 20.12%
12.78% of the SR mutual funds are in the top quintile—an astonishing low number compared to the 20.12% of the conventional funds.
Considering hypotheses S2–S4, the results are summarized in Table 4. As above, we use the bootstrap methodology to test for differences in the mean and minimum ESG scores. Notice, however, that while thep-values for the financial parameters in Table 2 were calculated for two-sided tests, the ethicalp-values are for one-sided tests.
An obvious question concerns the aver- age fund ESG scores. We presumed SR mu- tual funds, which are expected to be more ethical than conventional funds in the public view, to exhibit a higher average ESG fund score than conventional mutual funds (S2).
Indeed we find that the average fund ESG score of the SR mutual funds in our sample is significantly (on a 1% significance level) higher than the average fund ESG score of conventional mutual funds using both ESG score datasets. However, in absolute numbers the difference is quite marginal by 0.0117 (Asset 4) and 0.0118 (Bloomberg).
When testing the minimum fund ESG scores as hypothesized in S3, we find that the minimum of fund ESG scores of SR mutual funds (0.4565) over our sample
Table 4: Results for three ESG measures based on 1,000,000 bootstraps.
mean ESGY min ESGY mean ESGminY
corresponding hypothesis S2 S3 S4
Asset4 SR funds 0.6953 0.4565 0.2048
conventional funds 0.6836 0.3168 0.2099
difference 0.0117∗∗∗ 0.1397∗∗∗ −0.0051
(0.0032) (0.0097) (0.8453)
Bloomberg SR funds 0.2864 0.1633 0.1060
conventional funds 0.2746 0.1301 0.1050
difference 0.0118∗∗∗ 0.0332∗∗∗ 0.0010
(0.0010) (0.0043) (0.3211)
We report upon the statistics of the ESG scores for the SR mutual fund portfolios and for the conventional mutual fund portfolios for Asset4 in the first four rows and Bloomberg in the last four rows. Thep-values in parentheses are based on one-sided bootstrap tests. Significances of the differences are denoted with∗,∗∗, and∗∗∗for a 10%, 5%, and 1% level, respectively.
period is significantly higher than the re- spective statistic of the conventional mutual funds (0.3168) on a significance level of 1%
for the Asset4 data. That indicates that when investing into the same amount of either type of mutual funds, the ethically worst SR fund is generally better than the worst conventional fund, i.e., we reject S3. Again, using the Bloomberg data we can confirm the result. With this data, the worst SR fund to exceed the worst conventional fund by 3.32%.
The results regarding S4 are again con- sistent for both ESG score datasets. We see that the average ESG score of the worst firm in a fund does not differ between SR and conventional mutual funds. While the differences of the statistics of both types of funds show different signs (−0.0051 for Asset4 and 0.0010 for Bloomberg), bothp- values exceed 30% and therefore indicate us not to reject S4. Whereas the evidence derived from the results according to S3 sug- gests that the screening approach works, this result shows that the worst firm is similarly unethical in conventional and SR mutual funds. Thus, fund managers are not shy in also including less ethical firms in their investment universe.
This result is also confirmed by Figure 1.
We use the qq-plot methodology to create graphs displaying the quantiles of the mean
fund ESG scores on the horizontal axis and the corresponding ESG scores on the verti- cal axis. For instance, the 0% quantile shows the average ESG score of the worst asset in each fund, and the 100% quantile shows the average ESG score of the best asset in each fund. The distributions of mean fund ESG scores are fairly similar for conventional and SR mutual funds especially for the lower quantiles.
CONCLUSIONS
Nowadays, socially responsible investment is a matured investment industry with a huge number of assets under management.
Over the last two decades several studies have examined differences in the financial performance of conventional and SR mu- tual funds to find contradictory results. We contribute to this literature by analyzing a comprehensive sample of US mutual funds taken from the CRSP database. Moreover, we examine the ethical performance apply- ing ESG scores. Since there is no common standard for rating ESG issues, we employ data from two different providers, Asset4 and Bloomberg, to gain robust conclusions.
The financial results show no com- pelling evidence to either document an out- or underperformance of SR mutual
...
0%
.
20%
.
40%
.
60%
.
80%
.
100%
.
20
.
40
.
60
.
80
.
100
.
Quantile
.
ESGscoreinpercent(Asset4)
.
. ..SR funds
. ..Conventional funds
...
0%
.
20%
.
40%
.
60%
.
80%
.
100%
.
20
.
40
.
60
.
80
.
100
.
Quantile
.
ESGscoreinpercent(Bloomberg)
.
. ..SR funds
. ..Conventional funds
Figure 1: Average ESG scores depending on the quantile considered.
funds. When considering pure average excess return, both types of funds show quite sobering results, with monthly average excess returns of 24 bp for SR mutual funds and 27 bp for conventional mutual funds, respectively. Also, no type of fund was able to generate a positive alpha on average.
Our findings regarding the ethical per- formance are partially surprising. We are well aware that SRI is a heterogeneous field of investment with different strategies re- garding all kinds of environmental, social, and ethical issues. Yet, all these funds oper- ate under the label ‘SRI.’ In this article, it was our intention to analyze whether these SR mutual funds are more ethical in general than conventional mutual funds. Indeed, an investor who seeks to avoid the least ethical of all available funds can do so by purchasing SR mutual funds. Yet, when analyzing the actual fund holdings, the label ‘SR mutual fund’ does not in any way guarantee the exclusion of clearly unethical firms. This contrasts to earlier results which reported that SR mutual funds hold significantly higher ethical ranks which are nevertheless based on an earlier period. Notice that in the 1990s, SRI was still a niche investment market carried out by a small number of pioneering fund managers, who were value-
driven themselves. With the maturing of the SRI market and the promising billions worth of investments, SRI appears to have become more of a sales pitch than a reliable path to accomplish ethical preferences.
REFERENCES
Bauer, R., Koedijk, K. and Otten, R. (2005) International evidence on ethical mutual fund performance and investment style.Journal of Banking and Finance29(7):
1761–1767.
Brammer, S., Brooks, C. and Pavelin, S. (2006) Corporate social performance and stock returns: UK evidence from disaggregate measures.Financial Management35(3):
97–116.
Capelle-Blancard, G. and Monjon, S. (2012) Trends in the literature on socially responsible investment: Looking for the keys under the lamppost.Business Ethics: A European Review21(3): 239–250.
Carhart, M. (1997) On persistence in mutual fund perfor- mance.Journal of Finance52(1): 57–82.
Derwall, J., Guenster, N., Bauer, R. and Koedijk, K. (2005) The eco-efficiency premium puzzle.Financial Analysts Journal61(2): 51–63.
Derwall, J., Koedijk, K. and Horst, J. T. (2011) A tale of values-driven and profit-seeking social investors.Journal of Banking and Finance35(8): 2137–2147.
Dorfleitner, G., Leidl, M. and Reeder, J. (2012) Theory of social returns in portfolio choice with application to microfinance.Journal of Asset Management13(6): 384–400.
Edmans, A. (2011) Does the stock market fully value intan- gibles? Employee satisfaction and equity prices.Journal of Financial Economics101(3): 621–640.
Gruber, M. J. (1996) Another puzzle: The growth in actively managed mutual funds.Journal of Finance51(3): 783–810.
GSIA (2013) Global sustainable investment review 2012.
Guerard, J. B. (1997) Additional evidence on the cost of being socially responsible in investing.Journal of Investing 6(4): 31–36.
Hamilton, S., Jo, H. and Statman, M. (1993) Doing well
while doing good? The investment performance of socially responsible mutual funds.Financial Analysts Journal 49(6): 62–66.
Hong, H. and Kacperczyk, M. (2009) The price of sin:
The effect of social norms on markets.Journal of Financial Economics93(1): 15–36.
Jensen, M. C. (1968) The performance of mutual funds in the period 1945-1964.Journal of Finance23: 389–416.
Kempf, A. and Osthoff, P. (2008) SRI funds: Nomen est omen.Journal of Business Finance & Accounting35(9-10):
1276–1294.
Kurtz, L. and DiBartolomeo, D. (1996) Socially screened portfolios: An attribution analysis of relative performance.
Journal of Investing5(3): 35–41.
Luck, C. and Pilotte, N. (1993) Domini social index perfor- mance.Journal of Investing2(3): 60–62.
Mˇanescu, C. (2011) Stock returns in relation to environ- mental, social and governance performance: Mispricing or compensation for risk?Sustainable Development19(2):
95–118.
Margolis, J. D., Elfenbein, H. A. and Walsh, J. P. (2009) Does it pay to be good…and does it matter? A meta- analysis of the relationship between corporate so- cial and financial performance. Available at SSRN:
http://ssrn.com/abstract=1866371.
Modigliani, F. and Modigliani, L. (1997) Risk-adjusted performance. How to measure it and why.Journal of Portfolio Management23(2): 45–54.
Moskowitz, M. (1972) Choosing socially responsible stocks.
Business and Society Review1: 71–75.
Renneboog, L., ter Horst, J. and Zhang, C. (2008a) The price of ethics and stakeholder governance: The per- formance of socially responsible mutual funds.Journal of Corporate Finance14(3): 302–322.
Renneboog, L., ter Horst, J. and Zhang, C. (2008b) Socially responsible investments: Institutional aspects, perfor- mance, and investor behavior.Journal of Banking and Finance32(9): 1723–1742.
Schröder, M. (2007) Is there a difference? The performance characteristics of SRI equity indices.Journal of Business Finance and Accounting34(1-2): 331–348.
Sharpe, W. F. (1994) The Sharpe ratio.Journal of Portfolio Management21(4): 49–58.
Statman, M. and Glushkov, D. (2008) The wages of social responsibility.Financial Analysts Journal65(4): 33–46.
Treynor, J. L. (1965) How to rate management of investment funds.Harvard Business Review43: 63–75.
US SIF (2012) Report on sustainable and responsible invest- ing trends in the United States 2012.
US SIF (2013) Sustainable & responsible mutual fund chart.
http://charts.ussif.org/mfpc/, accessed 20 February 2013.
Utz, S., Wimmer, M., Hirschberger, M. and Steuer, R. E.
(2014) Tri-criterion inverse portfolio optimization with application to socially responsible mutual funds.European Journal of Operational Research234(2): 491–498.
Wermers, R. (2000) Mutual fund performance: An em- pirical decomposition into stock-picking talent, style, transactions costs, and expenses.Journal of Finance55(4):
1655–1703.
Wilcoxon, F. (1945) Individual comparison by ranking methods.Biometrics Bulletin1: 80–83.